当前位置:网站首页>Compose canvas pie chart effect drawing
Compose canvas pie chart effect drawing
2022-07-23 16:59:00 【Nine stream generation】
Compose Canvas Pie chart effect drawing
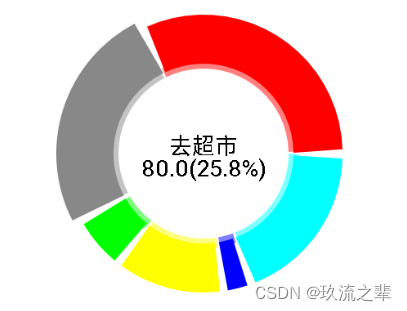
This use case is based on Compose Development adopt Canvas To draw a pie chart The pie chart data display is realized, and different data can be selected by clicking .
Final effect and code
- Stereo rendering effect
- Each section can be clicked and responded
- The whole pie chart can be touched, dragged and rotated

The final code
import android.content.Context
import android.graphics.Paint
import android.widget.Toast
import androidx.compose.animation.core.FloatTweenSpec
import androidx.compose.animation.core.animateFloatAsState
import androidx.compose.foundation.Canvas
import androidx.compose.foundation.background
import androidx.compose.foundation.gestures.detectDragGestures
import androidx.compose.foundation.gestures.detectTapGestures
import androidx.compose.foundation.layout.*
import androidx.compose.material.Text
import androidx.compose.runtime.*
import androidx.compose.ui.Alignment
import androidx.compose.ui.Modifier
import androidx.compose.ui.geometry.Offset
import androidx.compose.ui.geometry.Size
import androidx.compose.ui.graphics.Color
import androidx.compose.ui.graphics.StrokeCap
import androidx.compose.ui.graphics.drawscope.Stroke
import androidx.compose.ui.graphics.drawscope.translate
import androidx.compose.ui.graphics.nativeCanvas
import androidx.compose.ui.graphics.toArgb
import androidx.compose.ui.input.pointer.PointerInputChange
import androidx.compose.ui.input.pointer.pointerInput
import androidx.compose.ui.platform.LocalContext
import androidx.compose.ui.unit.dp
import androidx.compose.ui.unit.sp
import com.ftd.journal.utils.px2dip

private fun getPositionFromAngle(angles: List<Float>, touchAngle: Double, startAngle: Float): Int {

    var totalanagle = 0f
    for ((i, angle) in angles.withIndex()) {

        totalanagle += angle
        if (touchAngle >= startAngle && touchAngle <= (startAngle + totalanagle) % 360) {

            return i
        } else if (startAngle + totalanagle > 360) {

            if (touchAngle >= startAngle || touchAngle < (startAngle + totalanagle) % 360) {

                return i
            }
        }// Angle calculation
    }
    return -1
}

@Composable
fun PieChart(title:String,color: List<Color>, point: List<Float>, labels: List<String>) {

    Column(
        modifier = Modifier.fillMaxWidth(),
        verticalArrangement = Arrangement.Top,
        horizontalAlignment = Alignment.CenterHorizontally
    ) {

        Text(title)
        Row(
            verticalAlignment = Alignment.CenterVertically,
            horizontalArrangement = Arrangement.Center
        ) {

            CenterPieChart(context = LocalContext.current, color, point, labels)
            Column(
                modifier = Modifier
                    .padding(start = 30.dp, end = 10.dp), horizontalAlignment = Alignment.Start
            ) {

                for ((i, p) in point.withIndex()) {

                    Row(horizontalArrangement = Arrangement.Start, verticalAlignment = Alignment.CenterVertically) {

                        Box(
                            modifier = Modifier
                                .size(10.dp, 10.dp)
                                .background(color = color[i])
                        )
                        Text(
                            text = "${
      labels[i]} ($p)",
                            fontSize = 12.sp,
                            modifier = Modifier.padding(start = 5.dp, end = 5.dp)
                        )
                    }
                }
            }
        }

    }
}

@Composable
fun CenterPieChart(context: Context, color: List<Color>, point: List<Float>, labels: List<String>) {

    val sum = point.sum()
    val ViewWeight = 400f // Customize View Width   Here is a square   So the width and height are consistent
    val drawHeight = 60f // Internal line height   That is, the width of the colored part
    val selecyAddHeight = 10f // Increase the height after clicking
    val partpadding = 3f // Spacing between parts
    val angles = mutableListOf<Float>()

    var start by remember {
     mutableStateOf(false) }
    var position by remember {
     mutableStateOf(0) }
    var dragOffest by remember {
     mutableStateOf(0f) }
    val sweepPre by animateFloatAsState(
        targetValue = if (start) 1f else 0f,
        animationSpec = FloatTweenSpec(duration = 1000)
    )
    val paint = Paint()
    paint.color = Color.Black.toArgb()
    paint.textSize = 28f // Middle text font size
    paint.style = Paint.Style.STROKE
    Canvas(
        modifier = Modifier
            .width(px2dip(LocalContext.current, ViewWeight))
            .height(px2dip(LocalContext.current, ViewWeight))
            .background(Color.White)
            .pointerInput(Unit) {


                detectTapGestures(
                    onTap = {

                        val x = it.x - ViewWeight / 2
                        val y = it.y - ViewWeight / 2
                        var touchAngle = Math.toDegrees(Math.atan2(y.toDouble(), x.toDouble()))
                        // coordinate 1,2 Quadrant return -180~0 3,4 Quadrant return 0~180
                        if (x < 0 && y < 0 || x > 0 && y < 0) {
    //1,2 quadrant
                            touchAngle += 360
                        }

                        val nowpostion =
                            getPositionFromAngle(
                                touchAngle = touchAngle,
                                angles = angles,
                                startAngle = dragOffest % 360
                            )
                        if (nowpostion == position) {

                            position = -1;
                        } else {

                            position = nowpostion;
                        }
                        Toast
                            .makeText(
                                context,
                                "onTap: $position",
                                Toast.LENGTH_SHORT
                            )
                            .show()
                    }
                )
            }
            .pointerInput(Unit) {


                var dragstartx = 0f
                var dragstarty = 0f
                detectDragGestures(
                    onDragStart = {
     offset ->
                        //  Drag to start
                        dragstartx = offset.x
                        dragstarty = offset.y
                    },
                    onDragEnd = {

                        //  Drag end
                    },
                    onDragCancel = {

                        //  Drag cancel
                    },
                    onDrag = {
     change: PointerInputChange, dragAmount: Offset ->
                        //  Dragging
                        dragstartx += dragAmount.x
                        dragstarty += dragAmount.y
                        var x = 0f
                        var y = 0f
                        if (dragstarty < ViewWeight / 2) {

                            x = dragAmount.x
                        } else {

                            x = -dragAmount.x
                        }
                        if (dragstartx < ViewWeight / 2) {

                            y = -dragAmount.y
                        } else {

                            y = dragAmount.y
                        }// Split the coordinate components to judge the pros and cons
                        dragOffest = dragOffest + x + y

                    }
                )
            }
    ) {

        translate(0f, 0f) {

            start = true// Start animating
            var startAngle = dragOffest// Initial angle
            var selectAngle = 0f// Record the initial angle of the clicked item
            for ((i, p) in point.withIndex()) {

                val sweepAngle = p / sum * 360f// Biased angle
                if (angles.size < point.size) {

                    angles.add(sweepAngle)
                }
                if (position != i) {

                    drawArc(
                        color = color[i],
                        startAngle = startAngle + partpadding,
                        sweepAngle = sweepAngle * sweepPre - partpadding,
                        useCenter = false, //  A sign indicating whether the arc closes the center of the boundary
                        //  style
                        style = Stroke(width = drawHeight, miter = 10f, cap = StrokeCap.Butt),
                        size = Size(ViewWeight - drawHeight * 2, ViewWeight - drawHeight * 2),
                        topLeft = Offset(drawHeight, drawHeight)
                    )
                    drawArc(
                        color = color[i],
                        alpha = 0.5f,
                        startAngle = startAngle + partpadding / 2,
                        sweepAngle = sweepAngle * sweepPre - partpadding / 2,
                        useCenter = false, //  A sign indicating whether the arc closes the center of the boundary
                        //  style
                        style = Stroke(width = drawHeight / 5, miter = 10f, cap = StrokeCap.Butt),
                        size = Size(ViewWeight - drawHeight * 3, ViewWeight - drawHeight * 3),
                        topLeft = Offset(drawHeight * 1.5f, drawHeight * 1.5f)
                    )
                } else {

                    selectAngle = startAngle;
                }
                startAngle += sweepAngle
            }

            // Middle text drawing
            var textweight = paint.measureText(" All ")
            var text = "$sum"
            var pointweight = paint.measureText(text)
            if (position != -1) {

                // Selected content
                val sweepAngle = point[position] / sum * 360f
                drawArc(
                    color = color[position],
                    startAngle = selectAngle + partpadding,
                    sweepAngle = sweepAngle * sweepPre - partpadding,
                    useCenter = false, //  A sign indicating whether the arc closes the center of the boundary
                    //  style
                    style = Stroke(
                        width = drawHeight + selecyAddHeight,
                        miter = 10f,
                        cap = StrokeCap.Butt
                    ),
                    size = Size(
                        ViewWeight - drawHeight * 2 + selecyAddHeight,
                        ViewWeight - drawHeight * 2 + selecyAddHeight
                    ),
                    topLeft = Offset(
                        drawHeight - selecyAddHeight / 2,
                        drawHeight - selecyAddHeight / 2
                    )
                )// Select the back width

                drawArc(
                    color = color[position],
                    alpha = 0.5f,
                    startAngle = selectAngle + partpadding,
                    sweepAngle = sweepAngle * sweepPre - partpadding,
                    useCenter = false, //  A sign indicating whether the arc closes the center of the boundary
                    //  style
                    style = Stroke(width = drawHeight / 5, miter = 10f, cap = StrokeCap.Butt),
                    size = Size(ViewWeight - drawHeight * 3, ViewWeight - drawHeight * 3),
                    topLeft = Offset(drawHeight * 1.5f, drawHeight * 1.5f)
                )
                // Middle text drawing
                textweight = paint.measureText(labels[position])
                val pointF = "%.1f".format(sweepAngle * 100 / 360)
                val positionF = point[position]
                text = "$positionF($pointF%)"
                pointweight = paint.measureText(text)
                // Use native Canvas To draw
                drawContext.canvas.nativeCanvas.drawText(
                    labels[position],
                    ViewWeight / 2 - textweight / 2,
                    ViewWeight / 2,
                    paint
                )
                drawContext.canvas.nativeCanvas.drawText(
                    text,
                    ViewWeight / 2 - pointweight / 2,
                    ViewWeight / 2 + paint.textSize,
                    paint
                )
            }
            // Use native Canvas To draw
            drawContext.canvas.nativeCanvas.drawText(
                if (position == -1) " All " else labels[position],
                ViewWeight / 2 - textweight / 2,
                ViewWeight / 2,
                paint
            )
            drawContext.canvas.nativeCanvas.drawText(
                text,
                ViewWeight / 2 - pointweight / 2,
                ViewWeight / 2 + paint.textSize,
                paint
            )

        }

    }
}
The actual use
@Composable
fun Content() {

    Column(
        modifier = Modifier.fillMaxWidth(),
        verticalArrangement = Arrangement.Top,
        horizontalAlignment = Alignment.CenterHorizontally
    ) {


        val point = listOf(10f, 40f, 20f, 80f, 100f, 60f)
        val labels = listOf(" having dinner ", " sleep ", " Playing CARDS ", " Go to the supermarket ", " Go to work ", " Wages ")
        val color = listOf(Color.Blue, Color.Yellow, Color.Green, Color.Gray, Color.Red, Color.Cyan)

        PieChart(" Proportion of total expenditure ",color, point, labels)
    }
}
Code analysis
If you want to know more about how I achieved , You can continue to read and understand
Circle drawing
Because the pie chart is round , So we put all the data together as a circle , The proportion of each piece of data inside , Is its radian , For radians, we can use Canvas Medium drawArc You can draw an arc
- color Draw colors
- startAngle Starting angle
- sweepAngle Arc passing angle
- useCenter Whether the arc closes the mark of the boundary Center
- style style Here we use the thickness of the set style to set the width of the outer circle , That is, the width of the colored part in the figure below (drawHeight)
- size The full circle size of the overall radian It mainly controls the distance between the arc and the center point
- topLeft The position of the base point of the upper left corner Because considering drawing in a circle So the distance correction is carried out
 			  drawArc(
                        color = color[i],
                        startAngle = startAngle + partpadding,
                        sweepAngle = sweepAngle * sweepPre - partpadding,//1f  Make up for the lack of accuracy
                        useCenter = false, //  A sign indicating whether the arc closes the center of the boundary
                        //  style
                        style = Stroke(width = drawHeight, miter = 10f, cap = StrokeCap.Butt),
                        size = Size(ViewWeight - drawHeight * 2, ViewWeight - drawHeight * 2),
                        topLeft = Offset(drawHeight, drawHeight)
                    )
Then calculate the offset angle of each part of the data in turn , And then add it all up , Then the whole circle can be spliced and drawn .
Stereoscopic effect
Again , We draw a small arc on the inner circle , And set the transparency , Finally, separate each part to have a three-dimensional effect . The following is the drawing of the inner arc , The angle is basically the same , As follows partpadding Is the separation angle
                   drawArc(
                        color = color[i],
                        startAngle = startAngle + partpadding,
                        sweepAngle = sweepAngle * sweepPre - partpadding,
                        useCenter = false, //  A sign indicating whether the arc closes the center of the boundary
                        //  style
                        style = Stroke(width = drawHeight, miter = 10f, cap = StrokeCap.Butt),
                        size = Size(ViewWeight - drawHeight * 2, ViewWeight - drawHeight * 2),
                        topLeft = Offset(drawHeight, drawHeight)
                    )
                    drawArc(
                        color = color[i],
                        alpha = 0.5f,
                        startAngle = startAngle + partpadding / 2,
                        sweepAngle = sweepAngle * sweepPre - partpadding / 2,
                        useCenter = false, //  A sign indicating whether the arc closes the center of the boundary
                        //  style
                        style = Stroke(width = drawHeight / 5, miter = 10f, cap = StrokeCap.Butt),
                        size = Size(ViewWeight - drawHeight * 3, ViewWeight - drawHeight * 3),
                        topLeft = Offset(drawHeight * 1.5f, drawHeight * 1.5f)
                    )

Drag rotation
Use touch gestures , Take the center point of the original drawing as the benchmark , Split each moving component , To judge whether the interval is for x Weight and y The weight should be increased by adding or subtracting , for instance , When at the bottom of the pie chart ( Below half the height ), The direction of movement is timing , Its growth rate is positive , This direction is clockwise , So the angle can be increased , When on the left side of the pie chart ( Half the width is left ), When the moving direction is down , Its growth rate is negative , This direction is counterclockwise , So the angle needs to be reduced .
                var dragstartx = 0f
                var dragstarty = 0f
                detectDragGestures(
                    onDragStart = {
     offset ->
                        //  Drag to start
                        Log.d(
                            "pointerInput",
                            "onDragStart: ${
      offset.x} : ${
      offset.y}"
                        )
                        dragstartx = offset.x
                        dragstarty = offset.y
                    },
                    onDragEnd = {

                        //  Drag end
                    },
                    onDragCancel = {

                        //  Drag cancel
                    },
                    onDrag = {
     change: PointerInputChange, dragAmount: Offset ->
                        //  Dragging
                        Log.d(
                            "pointerInput",
                            "onDrag: $dragAmount"
                        )
                        dragstartx += dragAmount.x
                        dragstarty += dragAmount.y
                        var x = 0f
                        var y = 0f
                        if (dragstarty < ViewWeight / 2 ) {

                            x=dragAmount.x
                        }else{

                            x=-dragAmount.x
                        }
                        if (dragstartx < ViewWeight / 2 ) {

                            y=-dragAmount.y
                        }else{

                            y=dragAmount.y
                        }// Split the coordinate components to judge the pros and cons
                        dragOffest = dragOffest + x + y

                    }
                )
            }
Click to enlarge
As shown in the figure above, we can see that some areas will be enlarged after clicking , The logic is also very simple , Where you need to zoom in We draw at the end , On the one hand, it can ensure that this part will be at the upper level compared with other parts , On the other hand, we can use different widths when drawing radians , Then adjust the position , The enlarged part is finished .
               drawArc(
                    color = color[position],
                    startAngle = selectAngle + partpadding,
                    sweepAngle = sweepAngle * sweepPre - partpadding,
                    useCenter = false, //  A sign indicating whether the arc closes the center of the boundary
                    //  style
                    style = Stroke(
                        width = drawHeight + selecyAddHeight,
                        miter = 10f,
                        cap = StrokeCap.Butt
                    ),
                    size = Size(
                        ViewWeight - drawHeight * 2 + selecyAddHeight,
                        ViewWeight - drawHeight * 2 + selecyAddHeight
                    ),
                    topLeft = Offset(
                        drawHeight - selecyAddHeight / 2,
                        drawHeight - selecyAddHeight / 2
                    )
                )// Select the back width

                drawArc(
                    color = color[position],
                    alpha = 0.5f,
                    startAngle = selectAngle + partpadding,
                    sweepAngle = sweepAngle * sweepPre - partpadding,
                    useCenter = false, //  A sign indicating whether the arc closes the center of the boundary
                    //  style
                    style = Stroke(width = drawHeight / 5, miter = 10f, cap = StrokeCap.Butt),
                    size = Size(ViewWeight - drawHeight * 3, ViewWeight - drawHeight * 3),
                    topLeft = Offset(drawHeight * 1.5f, drawHeight * 1.5f)
                )
Click to listen , We can use gestures to monitor
                 detectTapGestures(
                    onTap = {

                        Log.d(
                            "pointerInput",
                            "onTap: ${
      it.x - ViewWeight / 2} ${
      it.y - ViewWeight / 2}"
                        )
                        val x = it.x - ViewWeight / 2
                        val y = it.y - ViewWeight / 2
                        var touchAngle = Math.toDegrees(Math.atan2(y.toDouble(), x.toDouble()))
                        // coordinate 1,2 Quadrant return -180~0 3,4 Quadrant return 0~180
                        if (x < 0 && y < 0 || x > 0 && y < 0) {
    //1,2 quadrant
                            touchAngle += 360
                        }

                        val nowpostion =
                            getPositionFromAngle(touchAngle = touchAngle, angles = angles, startAngle = dragOffest%360)
                        if (nowpostion == position) {

                            position = -1;
                        } else {

                            position = nowpostion;
                        }
                        Toast
                            .makeText(
                                context,
                                "onTap: $position",
                                Toast.LENGTH_SHORT
                            )
                            .show()
                    }
                )
Angle position judgment , If the offset angle just falls within the position range of this part , Indicates that it hits and returns
private fun getPositionFromAngle(angles: List<Float>, touchAngle: Double,startAngle:Float): Int {

    var totalanagle=0f
    for ((i, angle) in angles.withIndex()) {

        totalanagle+=angle
        if (touchAngle>=startAngle&&touchAngle<=(startAngle+totalanagle)%360){

            return i
        }else if (startAngle+totalanagle>360){

            if (touchAngle>=startAngle||touchAngle<(startAngle+totalanagle)%360){

                return i
            }
        }// Angle calculation
    }
    return -1
}
Arrange elements
Last , adopt compose The combination of , Encapsulate and display the title and arrangement elements
@Composable
fun PieChart(title:String,color: List<Color>, point: List<Float>, labels: List<String>) {

    Column(
        modifier = Modifier.fillMaxWidth(),
        verticalArrangement = Arrangement.Top,
        horizontalAlignment = Alignment.CenterHorizontally
    ) {

        Text(title)
        Row(
            verticalAlignment = Alignment.CenterVertically,
            horizontalArrangement = Arrangement.Center
        ) {

            CenterPieChart(context = LocalContext.current, color, point, labels)
            Column(
                modifier = Modifier
                    .padding(start = 30.dp, end = 10.dp), horizontalAlignment = Alignment.Start
            ) {

                for ((i, p) in point.withIndex()) {

                    Row(horizontalArrangement = Arrangement.Start, verticalAlignment = Alignment.CenterVertically) {

                        Box(
                            modifier = Modifier
                                .size(10.dp, 10.dp)
                                .background(color = color[i])
                        )
                        Text(
                            text = "${
      labels[i]} ($p)",
                            fontSize = 12.sp,
                            modifier = Modifier.padding(start = 5.dp, end = 5.dp)
                        )
                    }
                }// Loop to add the right arrangement elements
            }
        }// Arrange on the right

    }
}

Last
I think it's good , Collection , Like or follow a wave ! Everyone grows and gains together !
边栏推荐
猜你喜欢

js如果小数是0就减去,不是就保留

Priyanka Sharma, general manager of CNCF Foundation: read CNCF operation mechanism

Bag of Tricks for Image Classification with Convolutional Neural Networks(卷积神经网络在图像分类中的技巧)

Cuibaoqiu, vice president of Xiaomi group: open source is the best platform and model for human technological progress

Deep learning convolutional neural network paper study alexnet

层次分析法(MATLAB)

Notes on Microcomputer Principle and technical interface
Priyanka Sharma, general manager of CNCF Foundation: read CNCF operation mechanism

解决data functions should return an object 并(Property “visible“ must be accessed with “$data.visible“)

基于APISIX的basic-auth插件对Minio文件上传功能进行授权
随机推荐
阿里平头哥CPU技术生态负责人陈炜:平头哥的发展之路
Study note 7 -- traffic environment behavior prediction
mysql如何查询不在数据库里的数据?
Eureka笔记
MATLAB基础
Weisfeiler-Lehman图同构测试及其他
Solve data functions should return an object (property "visible" must be accessed with "$data.visible")
FIO performance testing tool
【31. 走迷宫(BFS)】
【无标题】
Wechat applet wx.hideloading() will close the toast prompt box
使用“soup.h1.text”爬虫提取标题会多一个\
怎么正确设置路由器
学习MySQL这一篇就够了
熵权法优化TOPSIS(MATLAB)
YOLOv4: Optimal Speed and Accuracy of Object Detection
距离IoU损失:包围盒回归更快更好的学习(Distance-IoU Loss: Faster and Better Learning for Bounding Box Regression)
TOPSIS法(MATLAB)
How to buy financial products with a return of more than 6%?
Squeeze and incentive networks