当前位置:网站首页>/silicosis/geo/GSE184854_scRNA-seq_mouse_lung_ccr2/GSE184854_RAW/GSM5598265_matrix_inflection_demult
/silicosis/geo/GSE184854_scRNA-seq_mouse_lung_ccr2/GSE184854_RAW/GSM5598265_matrix_inflection_demult
2022-07-02 03:06:00 【youngleeyoung】
step1
library(Seurat)
#https://www.jianshu.com/p/5b26d7bc37b7


getwd()
path="G:/silicosis/geo/GSE184854_scRNA-seq_mouse_lung_ccr2/GSE184854_RAW/"
setwd(path)
getwd()


#new_counts=read.table(file = "G:/silicosis/geo/GSE184854_scRNA-seq_mouse_lung_ccr2/GSE184854_RAW/GSM5598265_matrix_inflection_demulti_SilicaWT.txt/GSM5598265_matrix_inflection_demulti_SilicaWT.txt")
head(new_counts)
#或者可以直接 create色urat object(counts=counts)
mydata <- CreateSeuratObject(counts = read.table(file = "G:/silicosis/geo/GSE184854_scRNA-seq_mouse_lung_ccr2/GSE184854_RAW/GSM5598265_matrix_inflection_demulti_SilicaWT.txt/GSM5598265_matrix_inflection_demulti_SilicaWT.txt"),
                             min.cells = 10, project = "mydata_scRNAseq")

dim(mydata)
Idents(mydata)
mydata$orig_stim=Idents(mydata)
table(Idents(mydata))
colnames(mydata)
library(stringr)

teststring=colnames(mydata)[1:50]
str_split(teststring,"_",simplify = T)
str_split(teststring,"_",simplify = T)[,2]

table(str_split(colnames(mydata),"_",simplify = T)[,2])
table(str_split(colnames(mydata),"_",simplify = T)[,1])


mydata$percent.mt=PercentageFeatureSet(mydata,pattern = "^Mt")
Idents(mydata)


grepl(colnames(mydata),pattern = 'A0301')
colnames(mydata)[grepl(colnames(mydata),pattern = 'A0301')]

table(Idents(mydata))
mydata=RenameIdents(mydata,'A0301'='day_21_1','A0302'='day_21_2','A0303'='day_21_3',
                    'A0304'='day_7_1','A0305'='day_7_2','A0306'='day_7_3',
                    'A0307'='day_3_1','A0308'='day_3_2','A0309'='day_3_3',
                    'doublet'='doublet')
mydata$mystim=Idents(mydata)
table(mydata$mystim)
dim(mydata)


Idents(mydata)=mydata$orig_stim
mydata=RenameIdents(mydata,'A0301'='Day_21','A0302'='Day_21','A0303'='Day_21',
                    'A0304'='Day_7','A0305'='Day_7','A0306'='Day_7',
                    'A0307'='Day_3','A0308'='Day_3','A0309'='Day_3',
                    'doublet'='Doublet')
mydata$my_stim_3=Idents(mydata)


save(mydata,file = "G:/silicosis/geo/GSE184854_scRNA-seq_mouse_lung_ccr2/GSE184854_RAW/mydata.rds")
step2
library(dplyr)
library(cowplot)
library(Seurat)
library(harmony)


getwd()
path="G:/silicosis/geo/GSE184854_scRNA-seq_mouse_lung_ccr2/GSE184854_RAW_all_merged/step_2_harmony/"
dir.create(path)
setwd(path)
getwd()


#load("G:/silicosis/geo/GSE184854_scRNA-seq_mouse_lung_ccr2/GSE184854_RAW/mydata.rds")
load("G:/silicosis/geo/GSE184854_scRNA-seq_mouse_lung_ccr2/GSE184854_RAW_all_merged/merged.rds")
table(Idents(All.merge))
All=subset(All.merge,idents = c('A0301',  'A0302',   'A0303',
                                'A0304',   'A0305' ,'A0306',
                                'A0307' , 'A0308',   'A0309'))
dim(All)
table(Idents(All))

#All$percent.mt=PercentageFeatureSet(All,pattern = "^mt-")
pdf("1_contorl_QC.pdf")
VlnPlot(All, features = c("nFeature_RNA", "nCount_RNA", "percent.mt"), ncol = 3)
dev.off()
All <- subset(All, subset = nFeature_RNA > 200 & percent.mt < 20)## 15499,16133;

All = All%>%Seurat::NormalizeData(verbose = FALSE) %>%
  FindVariableFeatures(selection.method = "vst", nfeatures = 2000) %>%
  ScaleData(verbose = FALSE)
All = RunPCA(All, npcs = 50, verbose = FALSE)

pdf("2_ElbowPlot.pdf")
ElbowPlot(All, ndims = 50)
dev.off()


table(Idents(All))
All$stim=Idents(All)
#All@meta.data$stim <- c(rep("case", length(grep("1$", All@assays$RNA@counts@Dimnames[[2]]))), rep("ctrl", length(grep("2$", All@assays$RNA@counts@Dimnames[[2]])))) ## 8186,7947;
pdf("2_pre_harmony_harmony_plot.pdf")
options(repr.plot.height = 5, repr.plot.width = 12)
p1 <- DimPlot(object = All, reduction = "pca", pt.size = .1, group.by = "stim")
p2 <- VlnPlot(object = All, features = "PC_1", group.by = "stim", pt.size = .1)
plot_grid(p1, p2)
dev.off()
##########################run harmony

All <- All %>% RunHarmony("stim", plot_convergence = TRUE)
harmony_embeddings <- Embeddings(All, 'harmony')
pdf("1_contorl_QC_.pdf")
VlnPlot(All, features = c("nFeature_RNA", "nCount_RNA", "percent.mt"), ncol = 3)
dev.off()

pdf("2_after_harmony_harmony_plot.pdf")
options(repr.plot.height = 5, repr.plot.width = 12)
p3 <- DimPlot(object = All, reduction = "harmony", pt.size = .1, group.by = "stim")
p4 <- VlnPlot(object = All, features = "harmony_1", group.by = "stim", pt.size = .1)
plot_grid(p3, p4)
dev.off()

#######################cluster
All <- All %>%
  RunUMAP(reduction = "harmony", dims = 1:30) %>%
  RunTSNE(reduction = "harmony", dims = 1:30) %>%
  FindNeighbors(reduction = "harmony", dims = 1:30)
All<-All%>% FindClusters(resolution = 3) %>% identity()

options(repr.plot.height = 4, repr.plot.width = 10)
pdf("3_after_harmony_umap_two_group.pdf")
DimPlot(All, reduction = "umap", group.by = "stim", pt.size = .1)
dev.off()
pdf("3_after_harmony_cluster_UMAP.pdf")
DimPlot(All, reduction = "umap", label = TRUE, pt.size = .1)
dev.off()
pdf("3_umap_samples_split.pdf")
DimPlot(All, reduction = "umap", pt.size = .1, split.by = "stim", label = T)
dev.off()
pdf("3_after_harmony_tsne_two_group.pdf")
DimPlot(All, reduction = "tsne", group.by = "stim", pt.size = .1)
dev.off()
pdf("3_after_harmony_cluster_tSNE.pdf")
DimPlot(All, reduction = "tsne", label = TRUE, pt.size = .1)
dev.off()
pdf("3_tSNE_samples_split.pdf")
DimPlot(All, reduction = "tsne", pt.size = .1, split.by = "stim", label = T)
dev.off()

#######################################################################
stat = as.matrix(table(Idents(All), All$stim))
write.table(stat, "cluster_stat.txt", sep = "\t", quote = F, col.names = T, row.names = T)
################################################################
All<-All%>% FindClusters(resolution = 2) %>% identity()

Disease.markers <- FindAllMarkers(All, min.pct = 0.25, logfc.threshold = 0.35, only.pos = T)
head(Disease.markers)
top100markers <- Disease.markers %>% group_by(cluster) %>% slice_max(avg_log2FC,n=100)
openxlsx::write.xlsx(top100markers,'top100markers_for_all_res2.xlsx')
#write.table(top20markers, "top20_markers.txt", sep = "\t", quote = F, col.names = T, row.names = F)
#save(All, file = "G:/silicosis/geo/GSE184854_scRNA-seq_mouse_lung_ccr2/GSE184854_RAW_all_merged/step_2_harmony/all_harmony.rds")
load("G:/silicosis/geo/GSE184854_scRNA-seq_mouse_lung_ccr2/GSE184854_RAW_all_merged/step_2_harmony/all_harmony.rds")

getwd()
DimPlot(All,label = T)
FeaturePlot(All,features = c('Cd68'))
FeaturePlot(All,features = c('Lyz2'))
FeaturePlot(All,features = c('Mrc1'))
FeaturePlot(All,features = c('Adgre1'))
FeaturePlot(All,features = c('Axl'))

FeaturePlot(All,features = c('Csf1r'))
FeaturePlot(All,features = c('Ly6c2'))
FeaturePlot(All,features = c('Il7r'))
FeaturePlot(All,features = c('Car4'))
FeaturePlot(All,features = c('Siglecf'))
FeaturePlot(All,features = c('Mki67'))
FeaturePlot(All,features = c('Jchain','Tnfrsf17'),split.by = 'mystim')
DotPlot(All,features = c('Jchain','Tnfrsf17'),split.by = 'mystim')+RotatedAxis()+ggplot2::coord_flip()

colnames(All)
grepl(colnames(All),pattern = 'WT')
table(grepl(colnames(All),pattern = 'WT'))
table(grepl(colnames(All),pattern = 'CCR'))

All$orig_stim=Idents(All)
if(1==1){

  All$mystim_validate=ifelse(grepl(colnames(All),pattern = 'WT') &
                               (grepl(colnames(All),pattern = 'A0301')|grepl(colnames(All),pattern = 'A0302')|grepl(colnames(All),pattern = 'A0303')),
                             paste0(colnames(All),'_Day_21_WT'),
                             ifelse(grepl(colnames(All),pattern = 'WT') &
                                      (grepl(colnames(All),pattern = 'A0304')|grepl(colnames(All),pattern = 'A0305')|grepl(colnames(All),pattern = 'A0306'))
                                    ,paste0(colnames(All),'_Day_7_WT'),
                                    ifelse(grepl(colnames(All),pattern = 'WT') &
                                             (grepl(colnames(All),pattern = 'A0307')|grepl(colnames(All),pattern = 'A0308')|grepl(colnames(All),pattern = 'A0309'))
                                           ,paste0(colnames(All),'_Day_3_WT'),
                                           ifelse(grepl(colnames(All),pattern = 'CCR') &
                                                    (grepl(colnames(All),pattern = 'A0301')|grepl(colnames(All),pattern = 'A0302')|grepl(colnames(All),pattern = 'A0303'))
                                                  ,paste0(colnames(All),'_Day_21_CCR'),
                                                  ifelse(grepl(colnames(All),pattern = 'CCR') &
                                                           (grepl(colnames(All),pattern = 'A0304')|grepl(colnames(All),pattern = 'A0305')|grepl(colnames(All),pattern = 'A0306'))
                                                         ,paste0(colnames(All),'_Day_7_CCR'),
                                                         ifelse(grepl(colnames(All),pattern = 'CCR') &
                                                                  (grepl(colnames(All),pattern = 'A0307'))
                                                                ,paste0(colnames(All),'_Day_3_CCR'),paste0(colnames(All),'_Day_3_CCR'))
                                                  )
                                           ))
                             )
  )

  All$mystim=ifelse(grepl(colnames(All),pattern = 'WT') &
                      (grepl(colnames(All),pattern = 'A0301')|grepl(colnames(All),pattern = 'A0302')|grepl(colnames(All),pattern = 'A0303')),
                    paste0('_Day_21_WT'),
                    ifelse(grepl(colnames(All),pattern = 'WT') &
                             (grepl(colnames(All),pattern = 'A0304')|grepl(colnames(All),pattern = 'A0305')|grepl(colnames(All),pattern = 'A0306'))
                           ,paste0('_Day_7_WT'),
                           ifelse(grepl(colnames(All),pattern = 'WT') &
                                    (grepl(colnames(All),pattern = 'A0307')|grepl(colnames(All),pattern = 'A0308')|grepl(colnames(All),pattern = 'A0309'))
                                  ,paste0('_Day_3_WT'),
                                  ifelse(grepl(colnames(All),pattern = 'CCR') &
                                           (grepl(colnames(All),pattern = 'A0301')|grepl(colnames(All),pattern = 'A0302')|grepl(colnames(All),pattern = 'A0303'))
                                         ,paste0('_Day_21_CCR'),
                                         ifelse(grepl(colnames(All),pattern = 'CCR') &
                                                  (grepl(colnames(All),pattern = 'A0304')|grepl(colnames(All),pattern = 'A0305')|grepl(colnames(All),pattern = 'A0306'))
                                                ,paste0('_Day_7_CCR'),
                                                ifelse(grepl(colnames(All),pattern = 'CCR') &
                                                         (grepl(colnames(All),pattern = 'A0307'))
                                                       ,paste0('_Day_3_CCR'),paste0('_Day_3_CCR'))
                                         )
                                  ))
                    )
  )
  }
table(All$mystim)
table(All$orig_stim)
table(All$orig.ident)
table(grep(colnames(All),pattern = 'WT') & (grep(colnames(All),pattern = 'A0301')|
                                              grep(colnames(All),pattern = 'A0302')|
                                              grep(colnames(All),pattern = 'A0303'))
      )

All$mystim=ifelse(grepl(colnames(All),pattern = 'WT'),'WT','CCR')
table(All$mystim)
table(ifelse(grepl(colnames(All),pattern = 'WT'),'WT','CCR'))
length(grep(colnames(All),pattern = 'WT'))
table(All$orig.ident)
Idents(All)=All$mystim
table(grepl(colnames(All),pattern = 'WT') )
grepl(c('af','faf','cd'),pattern = 'a')
step3
getwd()
path="G:/silicosis/geo/GSE184854_scRNA-seq_mouse_lung_ccr2/step_3_mono_macrophage/"
dir.create(path)
setwd(path)
getwd()


load("G:/silicosis/geo/GSE184854_scRNA-seq_mouse_lung_ccr2/step_2_harmony/silicosis_mouse_harmony.rds")

table(Idents(All))
#csf1r and cd68
macrophage_and_monocyte=subset(All,idents =c('1','7','11','12','15','22',
                                             '31','35') )

table(Idents(macrophage_and_monocyte))
DimPlot(macrophage_and_monocyte)
macrophage_and_monocyte$orig_idents_from_All=Idents(macrophage_and_monocyte)

table(Idents(macrophage_and_monocyte),macrophage_and_monocyte$stim)

subset_data=macrophage_and_monocyte
subset_data = subset_data %>%
  Seurat::NormalizeData(verbose = FALSE) %>%
  FindVariableFeatures(selection.method = "vst", nfeatures = 2000) %>%
  ScaleData(verbose = FALSE) %>%
  RunPCA(npcs = 50, verbose = FALSE)
ElbowPlot(subset_data, ndims = 50)
VlnPlot(subset_data, features = c("nFeature_RNA", "nCount_RNA", "percent.mt"), ncol = 3)
##########################run harmony
#BiocManager::install('harmony')
library('harmony')

subset_data <- subset_data %>% RunHarmony("stim", plot_convergence = TRUE)
harmony_embeddings <- Embeddings(subset_data, 'harmony')
#######################cluster
dims = 1:30
subset_data <- subset_data %>%
  RunUMAP(reduction = "harmony", dims = dims) %>%
  RunTSNE(reduction = "harmony", dims = dims) %>%
  FindNeighbors(reduction = "harmony", dims = dims)

DimPlot(subset_data)
save(subset_data, file="sepsis_Endothelial.rds")

file=getwd()
r = 0.2
load(paste(file, "sepsis_Endothelial.rds", sep="/"))
dir.create(paste(file,r,sep="/"))
setwd(paste(file,r,sep="/"))
subset_data <- FindClusters(subset_data, resolution = r)
save(subset_data, file=paste0("sepsis_Endothelial_r", r, ".rds"))
subset_data <- ScaleData(subset_data, verbose = FALSE, features = rownames(subset_data))

pdf("1_Endothelial_cluster_TSNE.pdf")
p = DimPlot(subset_data, reduction = "tsne", label = TRUE, pt.size = 1,label.size = 6)
print(p)
dev.off()

pdf("1_Endothelial_cluster_UMAP.pdf")
p = DimPlot(subset_data, reduction = "umap", label = TRUE, pt.size = 1,label.size = 6)
print(p)
dev.off()
stat = cbind(table(Idents(subset_data), subset_data$stim), All = rowSums(table(Idents(subset_data), subset_data$stim)))
stat = rbind(stat, All = colSums(stat))
stat<-as.data.frame(stat)
stat
openxlsx::write.xlsx(stat, "2_Endothelial_cluster_stat.xlsx", col.names=T, row.names=T)
######################## find marker
markers <- FindAllMarkers(subset_data,  min.pct = 0.25, logfc.threshold = 0.25, only.pos=T)
openxlsx::write.xlsx(markers,"3_Endothelial_cluster_markers.xlsx", col.names=T,row.names=F)


FeaturePlot(subset_data,features = c('C1qa',
                                     'C1qb',
                                     'C1qc'))

FeaturePlot(subset_data,features = c('Mmp9',
                                     'Spp1',
                                     'Marcks',
                                     'Il1rn'))


FeaturePlot(subset_data,features = c('Mmp9',
                                     'Spp1',
                                     'Marcks',
                                     'Il1rn'),split.by = 'stim')

DotPlot(subset_data,features = c('Mmp9',
                                 'Spp1',
                                 'Marcks',
                                 'Il1rn',
                                 'C1qa','C1qb','C1qc'))

r=0.3

load(paste(file, "sepsis_Endothelial.rds", sep="/"))
dir.create(paste(file,r,sep="/"))
setwd(paste(file,r,sep="/"))
subset_data <- FindClusters(subset_data, resolution = r)
save(subset_data, file=paste0("sepsis_Endothelial_r", r, ".rds"))
subset_data <- ScaleData(subset_data, verbose = FALSE, features = rownames(subset_data))

pdf("1_Endothelial_cluster_TSNE.pdf")
p = DimPlot(subset_data, reduction = "tsne", label = TRUE, pt.size = 1,label.size = 6)
print(p)
dev.off()

pdf("1_Endothelial_cluster_UMAP.pdf")
p = DimPlot(subset_data, reduction = "umap", label = TRUE, pt.size = 1,label.size = 6)
print(p)
dev.off()
stat = cbind(table(Idents(subset_data), subset_data$stim), All = rowSums(table(Idents(subset_data), subset_data$stim)))
stat = rbind(stat, All = colSums(stat))
stat<-as.data.frame(stat)
stat
openxlsx::write.xlsx(stat, "2_Endothelial_cluster_stat.xlsx", col.names=T, row.names=T)
######################## find marker
markers <- FindAllMarkers(subset_data,  min.pct = 0.25, logfc.threshold = 0.25, only.pos=T)
openxlsx::write.xlsx(markers,"3_Endothelial_cluster_markers.xlsx", col.names=T,row.names=F)


DimPlot(subset_data,label = T)
step4
getwd()
path="G:/silicosis/geo/GSE184854_scRNA-seq_mouse_lung_ccr2/step_4_macrophage_from_0.3"
dir.create(path)
setwd(path)
getwd()

load("G:/silicosis/geo/GSE184854_scRNA-seq_mouse_lung_ccr2/step_3_mono_macrophage/0.3/sepsis_Endothelial_r0.3.rds")


DimPlot(subset_data,label = T)
subset_data=subset(subset_data,idents = c('1','2','4'))

DimPlot(subset_data,label = T)
subset_data$cluster124=Idents(subset_data)

#合并
subset_data = subset_data %>%
  Seurat::NormalizeData(verbose = FALSE) %>%
  FindVariableFeatures(selection.method = "vst", nfeatures = 2000) %>%
  ScaleData(verbose = FALSE) %>%
  RunPCA(npcs = 50, verbose = FALSE)
ElbowPlot(subset_data, ndims = 50)
VlnPlot(subset_data, features = c("nFeature_RNA", "nCount_RNA", "percent.mt"), ncol = 3)
##########################run harmony
#BiocManager::install('harmony')
library('harmony')

subset_data <- subset_data %>% RunHarmony("stim", plot_convergence = TRUE)
harmony_embeddings <- Embeddings(subset_data, 'harmony')
#######################cluster
dims = 1:30
subset_data <- subset_data %>%
  RunUMAP(reduction = "harmony", dims = dims) %>%
  RunTSNE(reduction = "harmony", dims = dims) %>%
  FindNeighbors(reduction = "harmony", dims = dims)

DimPlot(subset_data)

FeaturePlot(subset_data,features = c('C1qa',
                                     'C1qb',
                                     'C1qc'))

FeaturePlot(subset_data,features = c('Mmp9',
                                     'Spp1',
                                     'Marcks',
                                     'Il1rn'))


FeaturePlot(subset_data,features = c('Mmp9',
                                     'Spp1',
                                     'Marcks',
                                     'Il1rn'),split.by = 'stim')

DotPlot(subset_data,features = c('Mmp9',
                                 'Spp1',
                                 'Marcks',
                                 'Il1rn',
                                 'C1qa','C1qb','C1qc',
                                 'Csf1','Csf1r',
                                 'Car4', 'Ctsk', 'Chil3', 'S100a1','Wfdc21',
                                 'Ear1', 'Fabp1',
                                 'Itgam', 'Cd36','Gpnmb',
                                 'Litaf', 'Jund', 'Bhlhe40', 'Bhlhe41','Klf9'))
subset_data=RenameIdents(subset_data,'4'='IM','2'='AM','1'='Mo-AM')
getwd()


#save(subset_data,file = "G:/silicosis/geo/GSE184854_scRNA-seq_mouse_lung_ccr2/step_4_macrophage_from_0.3/im_am_from_res0.3.rds")
load("G:/silicosis/geo/GSE184854_scRNA-seq_mouse_lung_ccr2/step_4_macrophage_from_0.3/im_am_from_res0.3.rds")
library(Seurat)


DotPlot(subset_data,features = c('Chi3l1', 'Marcks', 'Il1rn', 'Pla2g7', 'Mmp9', 'Spp1',
                                 'Mmp12','Mmp14'))
DotPlot(All.merge,features = c('Spp1','Mmp14','Il1rn','Marcks','Pla2g7'))

VlnPlot(subset_data,features = c('Chi3l1', 'Marcks', 'Il1rn', 'Pla2g7', 'Mmp9', 'Spp1',
                                 'Mmp12','Mmp14'))
#'Apoe', 'Mafb',
DotPlot(subset_data,features = c('C1qa','C1qb','C1qc',
  'Ear1','Fabp1', 'Ctsk','Car4', 'Chil3', 'S100a1' , 'Wfdc21',
  'Itgam',  'Litaf', 'Gpnmb','Apoe','Mafb',
  'Mmp14','Spp1'))+RotatedAxis()+ggplot2:::coord_flip()

DotPlot(All.merge,features = c('Il34','Csf1'))
VlnPlot(All.merge,features = 'Il34')
VlnPlot(All.merge,features = 'Csf1')

VlnPlot(All.merge,features = c('Pdgfa','App','Tgfb1'))
DotPlot(All.merge,features = c('Il34','Csf1','Fgf2'))
边栏推荐
- Find duplicates [Abstract binary / fast and slow pointer / binary enumeration]
- 3048. Number of words
- Systemserver service and servicemanager service analysis
- 2022-2028 global wood vacuum coating machine industry research and trend analysis report
- 超图iServer rest服务之feature查询
- Missing numbers from 0 to n-1 (simple difficulty)
- 只需简单几步 - 开始玩耍微信小程序
- 命名块 verilog
- 连通块模板及变式(共4题)
- 2022-2028 global human internal visualization system industry research and trend analysis report
猜你喜欢

Framing in data transmission

Baohong industry | what misunderstandings should we pay attention to when diversifying investment
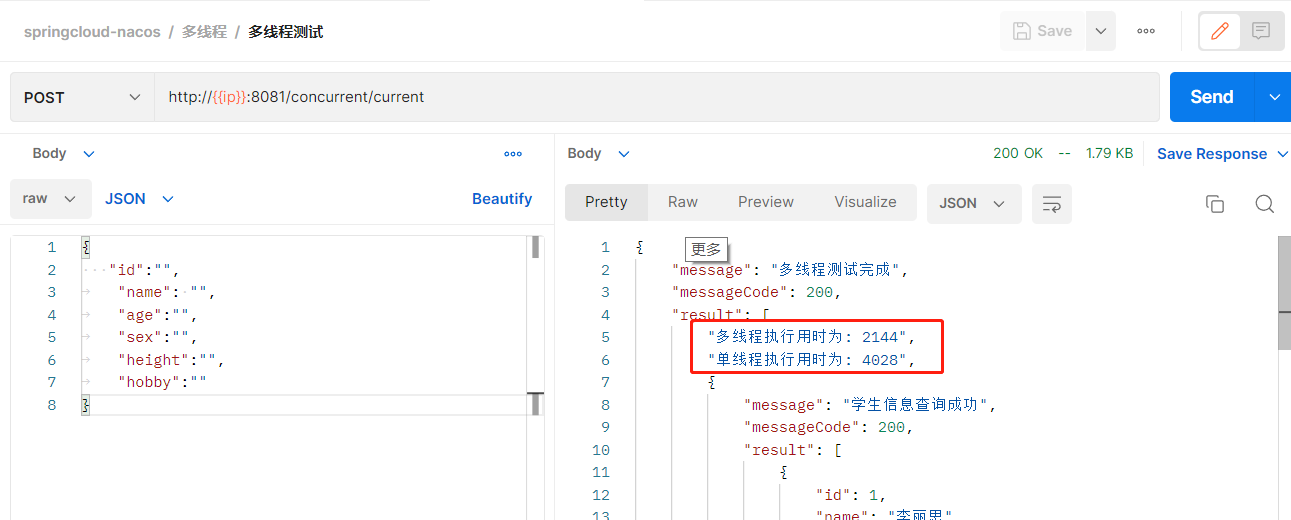
Multi threaded query, double efficiency

创业了...

Tupu software has passed CMMI5 certification| High authority and high-level certification in the international software field

Mmsegmentation series training and reasoning their own data set (3)

小米青年工程师,本来只是去打个酱油

C shallow copy and deep copy
JS introduction < 1 >
数据传输中的成帧
随机推荐
Yyds dry goods inventory accelerating vacuum in PG
Qualcomm platform wifi-- WPA_ supplicant issue
Baohong industry | 6 financial management models at different stages of life
Competition and adventure burr
Unit · elementary C # learning notes
[staff] diacritical mark (ascending sign | descending sign B | double ascending sign x | double descending sign BB)
buu_ re_ crackMe
What kind of good and cost-effective Bluetooth sports headset to buy
GB/T-2423.xx 环境试验文件,整理包括了最新的文件里面
【做题打卡】集成每日5题分享(第二期)
LeetCode刷题(十)——顺序刷题46至50
【JVM】创建对象的流程详解
Is bone conduction earphone better than traditional earphones? The sound production principle of bone conduction earphones is popular science
Jointly developed by nailing, the exclusive functions of glory tablet V7 series were officially launched
How to create an instance of the control defined in SAP ui5 XML view at runtime?
Mongodb non relational database
Xiaomi, a young engineer, was just going to make soy sauce
Calculation of page table size of level 2, level 3 and level 4 in protection mode (4k=4*2^10)
Verilog 时序控制
2022-2028 global soft capsule manufacturing machine industry research and trend analysis report