当前位置:网站首页>Implementation analysis of single image haze removal using dark channel prior
Implementation analysis of single image haze removal using dark channel prior
2022-06-10 19:13:00 【_ xwh】
This article is mainly to analyze the code , Help to learn more about 《Single Image Haze Removal Using Dark Channel Prior》 Operation steps of .
Before reading this article , Need to be right 《Single Image Haze Removal Using Dark Channel Prior》 Have a general understanding of . Provide a connection for the article resolution reference :https://www.cnblogs.com/Imageshop/p/3281703.html
The code analysis of this article is also based on the code resources in the above article , This article mainly lies in combing out clearer ideas with the code , And the code is annotated in detail .
One 、 The main program
First, the main program and its related comments are given here
clear
clc
close all

kenlRatio = 0.01;
minAtomsLight = 240;            % Set the upper limit of atmospheric light
% image_name =  'test images\21.bmp';
image_name =  'D:\1.png';       % Original image
img=imread(image_name);         % Read the data in the original picture file
figure,imshow(uint8(img)), title('src');   % Show the original image    And display the title

sz=size(img);       % Returns a row vector sz, The first element of the row vector is the number of rows of the matrix , The second element is the number of columns in the matrix .
w=sz(2);            % Read the number of columns of the extracted matrix
h=sz(1);             % Read the rows of the extracted matrix
dc = zeros(h,w);      % Return to one h×w Of 0 Matrix to dc, In fact, this matrix is size= Original input image size

for y=1:h               % Traveled through
    for x=1:w           % Column traversal
        dc(y,x) = min(img(y,x,:));  % For each pixel of the original image RGB3 The minimum luminance value in the channels , And then assign it to dc Matrix y That's ok x Column
    end
end

figure,imshow(uint8(dc)), title('Min(R,G,B)');  % Display the grayscale image of the original image

krnlsz = floor(max([3, w*kenlRatio, h*kenlRatio])) %krnlsz Is the side length size of the minimum filter window
%kenlRatio Is a preset value , Take... When seeking dimensions kenlRatio And the length and width of the gray image matrix ( namely w and h) Multiply by this default and 3 Compare , Select the maximum number as the window size
dc2 = minfilt2(dc, [krnlsz,krnlsz]);        % The dark channel image is obtained by minimum filtering on the obtained gray image

dc2(h,w)=0;             %dc2 Matrix h That's ok w Column assignment 0
figure,imshow(uint8(dc2)), title('After filter ');  % Display the filtered image
t = 255 - dc2;          % below 4 Row corresponding formula 11, That is, the transmission characteristics are obtained t(x) The estimate of
figure,imshow(uint8(t)),title('t');     % Display transmission characteristics t Image ( The original method is to find t)
t_d=double(t)/255;
sum(sum(t_d))/(h*w)     %t(x) It means x Pixels t The estimate of , And here t_d The matrix is averaged to find an average t value


A = min([minAtomsLight, max(max(dc2))]) % According to the method suggested in the paper A value , But to prevent A Too high , An upper limit value is set minAtomsLight
                                         %max(max(dc2)) Indicates that the front... Is taken from the dark channel diagram according to the brightness 0.1% The pixel . In these positions , There are fog images in the original I Find the value of the corresponding point with the highest brightness , As A value
J = zeros(h,w,3);       % Generate a 0 matrix J  The size is h×w  Here 3 Express rgb3 Channels
img_d = double(img);    % The original image type is converted to double

J(:,:,1) = (img_d(:,:,1) - (1-t_d)*A)./t_d; % According to the formula 22 Find all the elements of the image matrix R The value of the channel , The following two actions G and B Value
J(:,:,2) = (img_d(:,:,2) - (1-t_d)*A)./t_d;
J(:,:,3) = (img_d(:,:,3) - (1-t_d)*A)./t_d;

figure,imshow(uint8(J)), title('J');    % Display demist image J


%----------------------------------
% Because the transmittance diagram is too rough , A better transmittance map can be obtained by guiding filter , The following is the guidance filter calculation t The way
r = krnlsz*4
eps = 10^-6;

% filtered = guidedfilter_color(double(img)/255, t_d, r, eps);
filtered = guidedfilter(double(rgb2gray(img))/255, t_d, r, eps);% Guided filter calculation t

t_d = filtered;% The value calculated by the pilot filter is assigned to t_d matrix
figure,imshow(t_d,[]),title('filtered t');  % Display the result of guidance filtering t value

J(:,:,1) = (img_d(:,:,1) - (1-t_d)*A)./t_d; % According to the formula 22 Find all the elements of the image matrix R The value of the channel , The following two actions G and B Value
J(:,:,2) = (img_d(:,:,2) - (1-t_d)*A)./t_d;
J(:,:,3) = (img_d(:,:,3) - (1-t_d)*A)./t_d;

imwrite(uint8(J),'D:\11.bmp');% Write the demisted image data to a file
figure,imshow(uint8(J)), title('J_guild_filter');% Display the defogging image obtained after guidance filtering J
Two 、 Main program disassembly and analysis
1. First , According to the article, we can know : Based on the idea of dark channel a priori , We can find out t The estimated value of :
Under the principle of dark channel a priori , seek t The formula of the estimated value is transformed into :
For a certain graph , We think Ac Atmospheric light is a constant value .
We first calculate the gray image of the original input image , That is, the part in brackets minc Ic(y). The general idea is to compare all pixels of the original image x seek RGB The value with the lowest brightness in the channel , So we can get the gray image .
image_name =  'D:\1.png';       % Original image
img=imread(image_name);         % Read the data in the original picture file
figure,imshow(uint8(img)), title('src');   % Show the original image    And display the title
sz=size(img);       % Returns a row vector sz, The first element of the row vector is the number of rows of the matrix , The second element is the number of columns in the matrix .
w=sz(2);            % Read the number of columns of the extracted matrix
h=sz(1);             % Read the rows of the extracted matrix
dc = zeros(h,w);      % Return to one h×w Of 0 Matrix to dc, In fact, this matrix is size= Original input image size
for y=1:h               % Traveled through
    for x=1:w           % Column traversal
        dc(y,x) = min(img(y,x,:));  % For each pixel of the original image RGB3 The minimum luminance value in the channels , And then assign it to dc Matrix y That's ok x Column
    end
end
figure,imshow(uint8(dc)), title('Min(R,G,B)');  % Display the grayscale image of the original image
For the formula 11 The implementation of the content after the minus sign : Filter the minimum value of the gray image obtained above ,minfilt2 Is a minimum filtering function .
kenlRatio = 0.01;
krnlsz = floor(max([3, w*kenlRatio, h*kenlRatio])) %krnlsz Is the side length size of the minimum filter window
%kenlRatio Is a preset value , Take... When seeking dimensions kenlRatio And the length and width of the gray image matrix ( namely w and h) Multiply by this default and 3 Compare , Select the maximum number as the window size
dc2 = minfilt2(dc, [krnlsz,krnlsz]);        % The dark channel image is obtained by minimum filtering on the obtained gray image
Finally, normalization is carried out 、 Mean value processing implementation formula 11 The effect of :
dc2(h,w)=0;             %dc2 Matrix h That's ok w Column assignment 0
figure,imshow(uint8(dc2)), title('After filter ');  % Filtered image results
t = 255 - dc2;          % below 4 Row corresponding formula 11, That is, the transmission characteristics are obtained t(x) The estimate of
figure,imshow(uint8(t)),title('t');     % Display transmission characteristics t Image ( The original method is to find t)
t_d=double(t)/255;
sum(sum(t_d))/(h*w)     %t(x) It means x Pixels t The estimate of , And here t_d The matrix is averaged to find an average t value
2. The transmission characteristics are estimated t After value , Now we can calculate the atmospheric light according to the article A Valuation of .
minAtomsLight = 240;            % Set the upper limit of atmospheric light
A = min([minAtomsLight, max(max(dc2))]) % According to the method suggested in the paper A value , But to prevent A Too high , An upper limit value is set minAtomsLight
3. According to the final solution to the fog image J To restore the defog image , According to the following formula :
Average valuation in code t_d The replacement is... In the formula max(t(x),t0) part .
J = zeros(h,w,3);       % Generate a 0 matrix J  The size is h×w  Here 3 Express rgb3 Channels
img_d = double(img);    % The original image type is converted to double
J(:,:,1) = (img_d(:,:,1) - (1-t_d)*A)./t_d; % According to the formula 22 Find all the elements of the image matrix R The value of the channel , The following two actions G and B Value
J(:,:,2) = (img_d(:,:,2) - (1-t_d)*A)./t_d;
J(:,:,3) = (img_d(:,:,3) - (1-t_d)*A)./t_d;
figure,imshow(uint8(J)), title('J');    % Display demist image J
4. Because the transmittance diagram is too rough , A better transmittance map can be obtained by guiding filter , The following is the guidance filter calculation t The way .
r = krnlsz*4
eps = 10^-6;
filtered = guidedfilter(double(rgb2gray(img))/255, t_d, r, eps);% Guided filter calculation t
t_d = filtered;% The value calculated by the pilot filter is assigned to t_d matrix
figure,imshow(t_d,[]),title('filtered t');  % Display the result of guidance filtering t value
5. Calculated by guided filtering t_d Get the final defog image
J(:,:,1) = (img_d(:,:,1) - (1-t_d)*A)./t_d; % According to the formula 22 Find all the elements of the image matrix R The value of the channel , The following two actions G and B Value
J(:,:,2) = (img_d(:,:,2) - (1-t_d)*A)./t_d;
J(:,:,3) = (img_d(:,:,3) - (1-t_d)*A)./t_d;

imwrite(uint8(J),'D:\11.bmp');% Write the demisted image data to a file
figure,imshow(uint8(J)), title('J_guild_filter');% Display the defogging image obtained after guidance filtering J
3、 ... and 、 Program run results
1. Display the original input image 
2. Displays a grayscale image of the original image 
3. Display the result of minimum filtering on the gray image of the original image 
4. A priori calculation using dark channels is obtained t
5. According to the calculated t and A Calculate the fog image J
6. To refine t, Here, find the... After guidance filtering t
7. Using the defogging image obtained after guided filtering 
Four 、 explain
Here we analyze the idea of the main program , The procedures for minimum filtering and guided filtering are not analyzed , See the link at the beginning of the article for the specific code .
边栏推荐
- Adobe Premiere基础-工具使用(选择工具,剃刀工具,等常用工具)(三)
- nodejs-判断系统类型-获取主机名称-执行控制台命令-中文乱码
- 【代理】10分钟掌握正向代理和反向代理的本质区别
- Wireshark learning notes (I) common function cases and skills
- [Agency] 10 minutes to master the essential difference between forward agency and reverse agency
- 基于JSP的医院预约挂号平台设计与开发.zip(论文+项目源码)
- lingo12软件下载及lingo语言入门资源
- 【数据库语言SPL】写着简单跑得又快的数据库语言 SPL
- Adobe Premiere基础-素材嵌套(制作抖音结尾头像动画)(九)
- Rewrite clear Bayesian formula with base ratio
猜你喜欢

Adobe Premiere foundation - Import and export, merge materials, source file compilation, offline (II)
mysql8.0(新特性小结)

Opencv does not rely on any third-party database for face detection

Adobe Premiere基础(视频的最后一步字幕添加)(六)
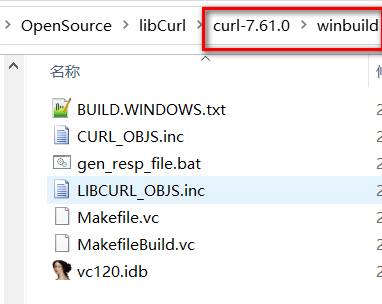
libcurl 7.61.0 VS2013 编译教程

Adobe Premiere foundation - time remapping (10)

Adobe Premiere基础-素材嵌套(制作抖音结尾头像动画)(九)
Adobe Premiere foundation - material nesting (animation of Tiktok ending avatar) (IX)
OPENCV 检测人脸 不依赖于任何第三方库

5. golang generics and reflection
随机推荐
瑞芯微RK1126平台 平台移植libevent 交叉编译libevent
Win32-子窗口-父窗口-窗口所有者
Mysql (17 déclencheurs)
5. golang generics and reflection
Adobe Premiere基础(轨道相关)(五)
Adobe Premiere基础(动画制作-弹性动画)(八)
[vulnhub range] janchow: 1.0.1
Adobe Premiere基础(视频的最后一步字幕添加)(六)
Anchor type and row data type of DB2 SQL pl
Dynamic SQL of DB2 SQL pl
Rk1126 adds a new module
OPENCV 检测人脸 不依赖于任何第三方库
3. getting started with golang concurrency
nodejs-基本架构分析-解析引擎目录-插件安装-核心模块
MySQL index invalidation scenario
Adobe Premiere Foundation (track related) (V)
Adobe Premiere Basics - introduction, configuration, shortcut keys, creating projects, creating sequences (I)
Adobe Premiere基础-不透明度(蒙版)(十一)
2022.05.28(LC_5_最长回文子串)
Live broadcast preview | deconstruct OLAP! The new multidimensional analysis architecture paradigm is fully open! Apache Doris will bring five big issues!