当前位置:网站首页>Full link service tracking implementation scheme
Full link service tracking implementation scheme
2022-06-24 19:27:00 【Cloud smart aiops community】
- The business deployment model is extremely flexible : Public cloud 、 Private cloud 、 A hybrid cloud
- Business nodes are widely distributed : It's hard to get to support the business XaaS The location of the instance
- The call hosting relationship is extremely complex : The number of invocation dependencies between microservices is exponentially higher than before
- Production problems are not found in time : Because the service invocation relationship between systems is not transparent , And tradition “ Total amount monitoring ” The pattern of , This results in... In the transaction link “ Problem service ” The impact of can not be quickly warned and notified , There is a certain lag in operation monitoring .
- The workload of troubleshooting is heavy : Due to the limitation of monitoring means , And the operation data standards of each system are not unified , To solve the production problem, a large number of “ Development ” And “ Operation and maintenance ” resources , And the communication cost is high .
- Inefficient problem solving : Because there is no unified serial identification for the operation data between systems , And different recording standards , It makes it impossible to locate quickly “ Problem service ”.
Observability
- indicators (Metrics): A form of aggregated data , I often come into contact with QPS、TP99、TP999 And so on Metrics The category of , Generally, the design and implementation are based on statistical principles ;
- journal (Logging): In a broad sense, logging is triggered by business requests or events , Record a snapshot of the application's state information . Unified collection of log data 、 Storage and parsing are affected by many factors , For example, structured and unstructured log processing , You often need a high-performance parser and cache ;
- Call chain (Tracing): Come of SOA Technology era , The long call chain brought by servitization , It's hard to locate the problem by just relying on the log , Some measures are needed to compensate for complexity . So it's more expressive than Metrics More complicated .

- In the cloud native scene , Virtualization is more thorough 、 The environment is more dynamic . Make full use of observability to realize full link tracking , To achieve high business availability 、 Satisfy SLA Other requirements .
- Track the whole transaction link in a visual way , Realize rapid problem discovery 、 Location problem 、 Assist in problem solving ; To be more intuitive 、 Generate and use the observation data in a scientific way for real-time monitoring and analysis .
- introduce AI Technology for automated exception discovery 、 Location and repair .
Problems and challenges
Overall solution for full link tracking
Applicable scenario
No monitoring tools
There are a few monitoring tools
There are relatively complete tools
Unified management and intelligence of operation and maintenance data
Solution

- Failure prevention phase : Full link tracking index planning and observation , At the same time, the indicator is converted to the alarm threshold , If the fault occurs, predict and alarm in advance , The operation and maintenance issues can be handled at the first time ;
- Fault discovery stage : The alarm shall be quickly notified to the operation and maintenance team ,
- Analysis and solution stage : Fast fault analysis and processing based on full link service tracking , Quickly analyze and locate O & M problems through link tracking and visualization , Be measurable and observable .
- The second round and conclusion stage : Historical data analysis , Full link optimization and supplement , Root cause location analysis , Business system optimization suggestions .

summary
The difficulty of using observational data
- adopt AI Algorithm ability combined with expert experience , The implementation is complex IT Fast fault detection in environment 、 Root cause location 、 performance optimization ;
- Identify the global performance of key call chains in business scenarios , Auxiliary business optimization ;
- Provide traceable performance data , Quantify the business value of the operation and maintenance department
It is difficult to build a chain of observation data
- Based on the processing capacity of the operation and maintenance data center , Collect rich observation data in real time / Handle / Storage / analysis , Build a fusion observation data system ;
- Conduct whole process display and upstream and downstream impact analysis through multi-dimensional topology .
The problem of difficult access to observation data
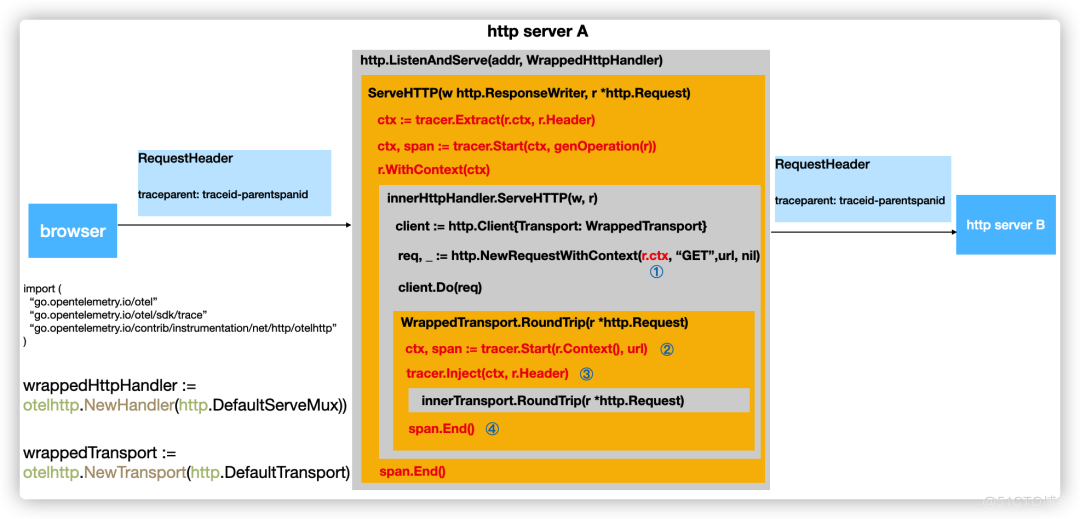
- Multiple sources : Front and rear ends 、 Cross cloud deployment 、 Third party tools, etc ; Multiple data types : journal 、 indicators 、 Call chain 、 The network traffic 、 Tripartite topology, etc ;
- Multilingual :Java 、Go etc. ;
- multi-protocol :OpenTracing、OpenTelemetry etc. ;
Open source benefits
Cloud intelligence has become an open source data visualization platform FlyFish . By configuring the data model, it provides users with hundreds of visual graphics components , Zero coding can achieve a cool visual large screen that meets your business needs . meanwhile , Flying fish also provides flexible expansion ability , Support component development 、 Customize the configuration of functions and global events , Facing complex demand scenarios can ensure efficient development and delivery .
Click the address link below , Welcome to FlyFish Like to send Star. Participate in component development , There are ten thousand yuan in cash waiting for you to get .
GitHub Address : https://github.com/CloudWise-OpenSource/FlyFish
Gitee Address :https://gitee.com/CloudWise/fly-fish
Ten thousand yuan cash activities : http://bbs.aiops.cloudwise.com/t/Activity
Wechat scanning identifies the QR code below , remarks 【 Flying fish 】 Join in AIOps Community flying fish developer exchange group , And FlyFish project PMC Face to face communication ~

边栏推荐
- Mq-2 smoke concentration sensor (STM32F103)
- 特尔携手微软发挥边云协同势能,推动AI规模化部署
- How to protect biological privacy in the AI era? Overview of the latest "privacy enhancement technology in biometrics" of the Autonomous University of Madrid, comprehensively detailing the biometric p
- ###脚本实现raid0自动化部署
- How to customize cursor position in wechat applet rotation chart
- Interpreting harmonyos application and service ecology
- Buddha bless you that there will never be a bug
- flink-sql的kafka的这个设置,group-offsets,如果指定的groupid没有提
- Multi segment curve temperature control FB (SCL program) of PLC function block series
- Technology implementation | Apache Doris cold and hot data storage (I)
猜你喜欢

使用阿里云RDS for SQL Server性能洞察优化数据库负载-初识性能洞察

Volcano成Spark默認batch調度器

IBPS开源表单设计器有什么功能?
一文详解|Go 分布式链路追踪实现原理

Source code analysis of ArrayList

对国产数据库厂商提几个关于SQL引擎的小需求

技术实现 | Apache Doris 冷热数据存储(一)
Game between apifox and other interface development tools

Capacitive inching touch switch module control (stm32f103c8t6)

Zadig + 洞态 IAST:让安全溶于持续交付
随机推荐
8 challenges of BSS application cloud native deployment
Programmers spend most of their time not writing code, but...
Tkde2022: Dialogue recommendation system based on knowledge enhanced sampling
Kubernetes集群部署
Xiaobai, let me ask you guys, is MySQL binlog extracted by CDC in strict order
数字孪生行业案例:智慧港口数字化
Volcano becomes spark default batch scheduler
Download steps of STM32 firmware library
NFT pledge liquidity mining system development technology
Volcano becomes spark default batch scheduler
IBPS开源表单设计器有什么功能?
Multi segment curve temperature control FB (SCL program) of PLC function block series
应用实践 | 海量数据,秒级分析!Flink+Doris 构建实时数仓方案
Why are life science enterprises on the cloud in succession?
Capacitive inching touch switch module control (stm32f103c8t6)
敏捷之道 | 敏捷开发真的过时了么?
怎么使用R包ggtreeExtra绘制进化树
ls 常用参数
If the programmer tells the truth during the interview
php OSS文件讀取和寫入文件,workerman生成臨時文件並輸出瀏覽器下載