当前位置:网站首页>boot actuator - prometheus使用
boot actuator - prometheus使用
2022-07-02 22:07:00 【iiaythi】
boot actuator - prometheus - grafana
流程
- boot 应用 提供统计 api,如 http请求
- prometheus 从 boot 收集并存储
- grafana 将 prometheus 数据进行展示
docker prometheus 配置
version: '3.7'

networks:
    monitor:
        driver: bridge

services:
    prometheus:
        image: prom/prometheus
        container_name: prometheus
        hostname: prometheus
        restart: always
        user: root
        volumes:
            - ./prometheus/conf:/etc/prometheus
            - ./prometheus/data:/prometheus
            - /etc/localtime:/etc/localtime:ro
            - /etc/timezone:/etc/timezone:ro
        ports:
            - "9090:9090"
        networks:
            - monitor
        command:
            - '--config.file=/etc/prometheus/prometheus.yml'
            - '--storage.tsdb.path=/prometheus'

    alertmanager:
        image: prom/alertmanager
        container_name: alertmanager
        hostname: alertmanager
        user: root
        restart: always
        volumes:
            - ./alertmanager/conf:/etc/alertmanager
            - /etc/localtime:/etc/localtime:ro
            - /etc/timezone:/etc/timezone:ro
        ports:
            - "9094:9093"
        networks:
            - monitor

    grafana:
        image: grafana/grafana
        container_name: grafana
        hostname: grafana
        user: root
        restart: always
        ports:
            - "3000:3000"
        volumes:
            - ./grafana/data:/var/lib/grafana
            - /etc/localtime:/etc/localtime:ro
            - /etc/timezone:/etc/timezone:ro
        networks:
            - monitor

    node-exporter:
        image: quay.io/prometheus/node-exporter
        container_name: node-exporter
        hostname: node-exporter
        restart: always
        user: root
        ports:
            - "9100:9100"
        networks:
            - monitor
        volumes:
            - /etc/localtime:/etc/localtime:ro
            - /etc/timezone:/etc/timezone:ro
配置 prometheus.yml
配置定时任务
$ cat prometheus/conf/prometheus.yml
# my global config
global:
scrape_interval: 15s # Set the scrape interval to every 15 seconds. Default is every 1 minute.
evaluation_interval: 15s # Evaluate rules every 15 seconds. The default is every 1 minute.
# scrape_timeout is set to the global default (10s).
# Attach these labels to any time series or alerts when communicating with
# external systems (federation, remote storage, Alertmanager).
external_labels:
monitor: 'codelab-monitor'
# Load rules once and periodically evaluate them according to the global 'evaluation_interval'.
rule_files:
# - "first.rules"
# - "second.rules"
# A scrape configuration containing exactly one endpoint to scrape:
# Here it's Prometheus itself.
scrape_configs:
# The job name is added as a label `job=<job_name>` to any timeseries scraped from this config.
- job_name: 'prometheus'
# metrics_path defaults to '/metrics'
# scheme defaults to 'http'.
static_configs:
- targets: ['192.xx.xx.10:9090']
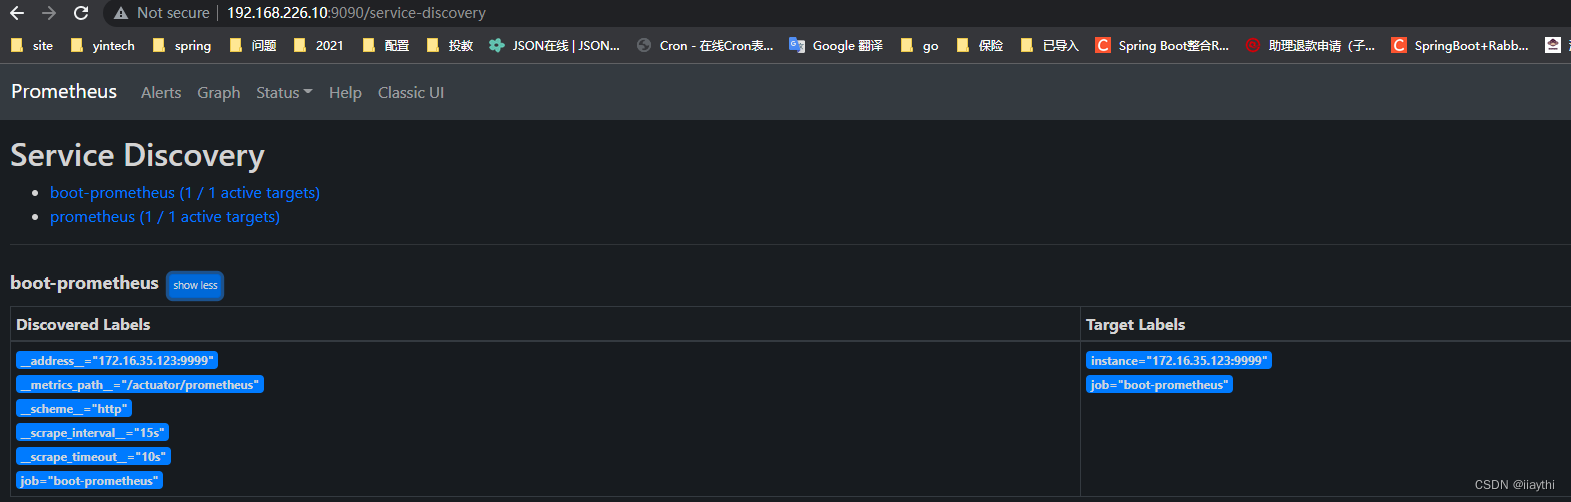
- job_name: 'boot-prometheus' # 配置监听 spring boot
metrics_path: '/actuator/prometheus' # spring boot 默认暴露接口
static_configs:
- targets: ['172.xx.x.3:9999']
启动 docker-compose up -d
访问 prometheus
http://localhost:9090
grafana 使用
添加数据源 prometheus

问题
“Error on ingesting samples that are too old or are too far into the future”
容器和宿主机时间不不一致,或者相差太多
边栏推荐
- 解决 excel 文件上传时更改选中的文件出现错误net::ERR_UPLOAD_FILE_CHANGED
- 位的高阶运算
- Socket套接字C/S端流程
- Zhong Xuegao responded that the product will not melt for 1 hour: it contains solid components and cannot melt into water
- DTM distributed transaction manager PHP collaboration client V0.1 beta release!!!
- 全面解析分享购商业模式逻辑?分享购是如何赋能企业
- Oracle-游标
- SimpleITK使用——3. 常见操作
- 杰理之样机无触摸,拆机之后重新安装变正常【篇】
- Go four singleton modes
猜你喜欢
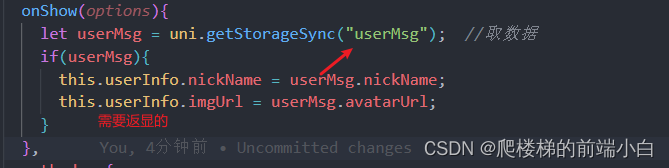
uniapp微信登录返显用户名和头像

分享 10 个 JS 闭包面试题(图解),进来看看你能答对多少
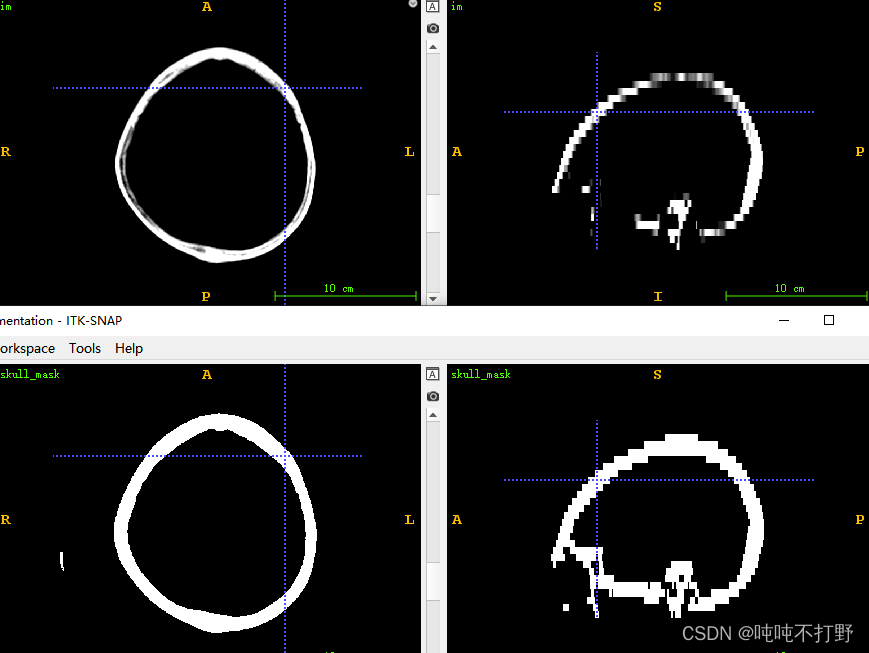
SimpleITK使用——3. 常见操作

Comprehensively analyze the logic of the shared purchase business model? How sharing purchase empowers Enterprises

Oracle-PL/SQL编程
![加油站[问题分析->问题转换->贪心]](/img/15/5313f900abedb46ce82d8ab81af1d7.png)
加油站[问题分析->问题转换->贪心]

NC50965 Largest Rectangle in a Histogram
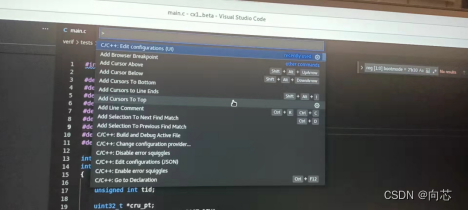
#include errors detected. Please update your includePath.
Oracle-游标

SimpleITK使用——4. 奇怪的問題
随机推荐
PMP项目整合管理
UE4 UI adaptive screen
数学建模——图与网络模型及方法(一)
Jerry's modification does not require long press the boot function [chapter]
[ODX studio edit PDX] -0.1- how to quickly view the differences in supported diagnostic information between variant variants (service, sub function...)
phpcms实现订单直接支付宝支付功能
NC24325 [USACO 2012 Mar S]Flowerpot
杰理之内置短按再长按,不管长按多长时间都是短按【篇】
NC50965 Largest Rectangle in a Histogram
[chestnut sugar GIS] ArcMap - why should the tick of classic capture be removed when using custom capture?
性能优化----严苛模式
《乔布斯传》英文原著重点词汇笔记(十)【 chapter eight】
[micro service sentinel] rewrite Sentinel's interface blockexceptionhandler
[error record] the flutter reports an error (could not read script 'xxx\flutter\u tools\gradle\app\u plugin\u loader.gradle')
Baidu AI Cloud - create a face recognition application
杰理之快速触摸不响应问题【篇】
悬镜安全在RSAC2022上斩获Global InfoSec Awards四项大奖
NC24325 [USACO 2012 Mar S]Flowerpot
加油站[问题分析->问题转换->贪心]
[LeetCode] 回文数【9】