当前位置:网站首页>Filtered data analysis
Filtered data analysis
2022-06-24 22:01:00 【jk_ one hundred and one】
Catalog
Moving average filter of traffic flow data
Filter difference equation
Filter is a data processing technology , You can filter out the high-frequency fluctuations in the data to smooth them or delete the periodic trend of a specific frequency from the data . stay MATLAB in ,filter The function compares the data according to the following difference equation x The vector of , The difference equation describes a tapped delay line filter .
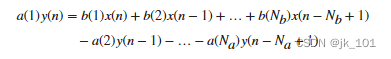
In this equation ,a and b Is the vector of filter coefficients ,Na Is the order of the feedback filter ,Nb Is the order of the feedforward filter .n yes x Index of the current element of . Output y(n) yes x and y A linear combination of the current element and the previous element of .
filter The function uses the specified coefficient vector a and b For input data x Filtering .
Moving average filter of traffic flow data
filter Function is a way to realize moving average filter , It is a common data smoothing technique .
The following difference equation describes a filter , It averages the time-dependent data about the current hour and the previous three hours .
![]()
Import data that describes how traffic flows change over time , And assign the first vehicle count to the vector x.
load count.dat
x = count(:,1);
Create a filter coefficient vector .
a = 1;
b = [1/4 1/4 1/4 1/4];
Calculating data 4 Hourly moving average , Draw raw data and filtered data at the same time .
y = filter(b,a,x);

t = 1:length(x);
plot(t,x,'--',t,y,'-')
legend('Original Data','Filtered Data')
As shown in the figure :

Modify data amplitude
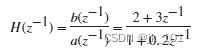
This example shows how to modify the amplitude of a data vector by applying a transfer function . In digital signal processing , Filters are usually represented by transfer functions . Of the following difference equations Z Transformation

Is the following transfer function .

Use transfer functions
modify count.dat Amplitude of data in . Load the data and assign the first column to the vector x.
load count.dat
x = count(:,1);
According to the transfer function ![]() Create a filter coefficient vector .
Create a filter coefficient vector .
a = [1 0.2];
b = [2 3];
Calculate the filtered data , Draw raw data and filtered data at the same time . This filter mainly modifies the amplitude of the original data .
y = filter(b,a,x);

t = 1:length(x);
plot(t,x,'--',t,y,'-')
legend('Original Data','Filtered Data')
As shown in the figure :

边栏推荐
- 【论】Deep learning in the COVID-19 epidemic: A deep model for urban traffic revitalization index
- Multithreaded finalization
- Installing Oracle without graphical interface in virtual machine centos7 (nanny level installation)
- 03--- antireflective film
- C language - keyword 1
- 在每个树行中找最大值[分层遍历之一的扩展]
- Two implementation methods of stack
- leetcode_ 191_ 2021-10-15
- SAP接口debug设置外部断点
- 985 test engineer is hanged. Who is more important in terms of education and experience?
猜你喜欢
想当测试Leader,这6项技能你会吗?

Li Kou daily question - day 26 -496 Next larger element I

EasyBypass
![在每个树行中找最大值[分层遍历之一的扩展]](/img/5b/81ff20b61c0719ceb6873e44878859.png)
在每个树行中找最大值[分层遍历之一的扩展]
![[featured] how do you design unified login with multiple accounts?](/img/df/9b4fc11a6971ebe8162ae84250a782.png)
[featured] how do you design unified login with multiple accounts?
性能测试工具wrk安装使用详解

leetcode_ 191_ 2021-10-15

心楼:华为运动健康的七年筑造之旅
Opengauss kernel: simple query execution

PyCharm 中出现Cannot find reference ‘imread‘ in ‘__init__.py‘
随机推荐
Multithreaded finalization
拖动拖动拖动
Interviewer: you said you are proficient in redis. Have you seen the persistent configuration?
cv2导包时报Could not find a version that satisfies the requirement cv2 (from versions: none)
【无标题】
Flutter: Unsupported value: false/true
01---两列波在相遇处发生干涉的条件
在每个树行中找最大值[分层遍历之一的扩展]
权限想要细化到按钮,怎么做?
[camera Foundation (I)] working principle and overall structure of camera
leetcode_ one thousand three hundred and sixty-five
堆排序和快速排序原理实现
面试官:你说你精通Redis,你看过持久化的配置吗?
心楼:华为运动健康的七年筑造之旅
Mysql 通过表明获取字段以及注释
2022 international women engineers' Day: Dyson design award shows women's design strength
openGauss内核:简单查询的执行
[notes of wuenda] fundamentals of machine learning
The process from troubleshooting to problem solving: the browser suddenly failed to access the web page, error code: 0x80004005, and the final positioning: "when the computer turns on the hotspot, the
降低pip到指定版本(通過PyCharm昇級pip,在降低到原來版本)