当前位置:网站首页>Analysis of [paper] pointlanenet papers
Analysis of [paper] pointlanenet papers
2022-07-27 03:08:00 【It's Anlan】
Catalog
Structured representation of lane lines
Preface
PointLaneNet yes 2019 IEEE Intelligent Vehicles Symposium (IV) A paper on , Determine the location of the lane line by detecting the points on the lane line , And classify the lane lines , Is subject to YOLO Series inspired ont-stage Network structure .
Title:《PointLaneNet: Efficient end-to-end CNNs for Accurate Real-Time Lane Detection》
version 1.0
abstract
An end-to-end lane detection algorithm is proposed , The coordinates of lane line points can be obtained directly from the driving scene .
method description
Inspired by YOLO Series algorithm , The lane detection algorithm can simultaneously predict the location and classify the lane lines in a single network , In order to facilitate network training , The concept of lane line distance is also clarified .
Structured representation of lane lines
The article points out that : Generally, straight lines or polynomial curves are used to structurally represent lane lines , In fact, in reality , This is not advisable , Even the curve of cubic polynomial cannot completely represent the complex lane line , But a series of precise points can represent the lane line , These points can be obtained by interpolation , As long as you know the starting point in the lane line , Termination point , In the middle , The four parameters of lane line width , It can show the shape of the lane line . The width of the lane line is known ( According to the regulations ), The end point of the lane line is at the bottom of the picture ( This article defaults to ).
There is a unique intersection between the horizontal and equally spaced straight lines and each lane line , Now you only need to find the starting point of the lane line and the point of the lane line .Fig2 Is the representation of structured lane lines .

y It's pre-set ( Horizontal line ), So if you want to determine the coordinates of each point, you only need to determine the offset of that point , therefore , The predicted value of each lane line is : Offset , The starting point , Confidence of lane line . The following figure is the definition of points on the lane line :

Distance
Define the distance between lane lines ( The paper says : The definition of the distance between lane lines is very important for training . In a general way ,point-point Distance is Euclidean distance ,box-box yes IOU Definition , The distance between lane lines is not clearly defined ).
Yes point-line Distance is defined :
Euclidean distance .

Yes line-line Distance definition formula :
The distance between two lines is defined as the average of the distance between overlapping points . For non overlapping parts , The distance defined is infinite ( infinity ).

detection pipeline
Use one-stage Methods to detect the lane line , The model detects the location of points and classifies lane lines .

Use GoogleNet As feature extraction network , Conduct 8 Next sampling , The pictures are divided into w x h Of grid
Location detection
Use 2 Time 1 x1 Convolution of , take feature map The output dimension of is converted to n+1,n yes n Offset , another 1 Dimension is the starting position of the lane line .

Classification
Use 2 Time 1 x1 Convolution of , Convert the output channel to 2, To indicate whether the lane line passes through this grid, By modifying the channel , This can be used to detect the color or type of lane line , Because of the dataset used in this article , Here is just to detect whether the lane line exists or not . The final output is :w * h * (n+1+2)
post-processing:
Because a lane passes through many grid, Each lane line has many prediction results , So it needs post-processing .
Specific steps :
Initialization distance , The threshold for \delta = 10 pixels,confidence The threshold of is cls = 0.99;
Delete all cls < 0.99 The lane line of the road ;
Yes confidence Sort , selection confidence The tallest one , If confidence The highest one distance < \delta, Delete this lane line , Keep looking for the second highest confidence;
If lane number More than the 5, take \delta = \delta+10, Re step 3; Or it's over ;
notes : This data set is set with no more than five lanes ;
Be careful : Formula is Latex,\delta.
Model Analysis
Model evaluation index :
Yes Mem、 Amount of computation FLOPS And the computational strength of the model I Quantitative analysis . among , The computational strength of the model shows Floating point operands required for memory exchange per byte during calculation , Unit is Flops/Byte. The relationship between the three variables :
I = Flops/Mem
model Parameter comparison
contrast SCNN,LaneNet.( The article here uses three lightweight feature networks as a comparison ,GoogLeNet, SqueezeNet, and MobileNet)

Training
data: The operation of data enhancement ;
Matching strategy : To balance positive and negative samples , In training set , Set the grid center point within a certain distance threshold from the true lane line as a positive sample ; Otherwise, set as negative sample .threshold = 20 pixels.
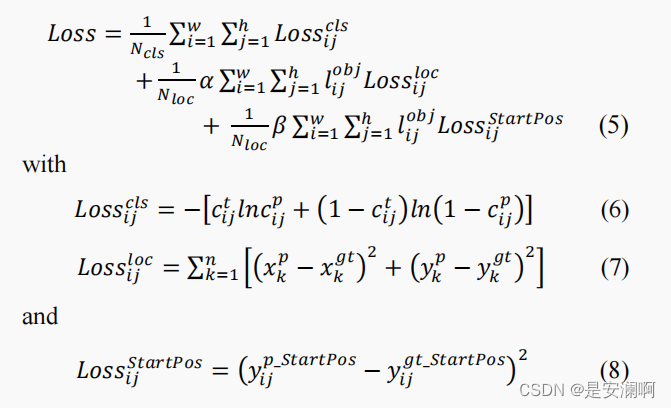
Loss: Three kinds of predicted values output by the model , Confidence of lane line confidence, Offset of lane line point \triangle x(x-coordinate), Starting point of lane line y(y-coordinate), Correspondingly ,loss Function is also composed of these three parts , Of confidence loss Using cross entropy , The loss function of lane line points uses Euclidean distance .loss function As shown in the figure below :
Choosing scales: Determine the sampling magnification through experiments , This paper chooses 16 Double down sampling , Although the information of lane line may be lost after down sampling , However, the location of the lane line can still be known through the lane structure or environmental information .
Hard negative mining: Sort the negative samples according to the confidence , Select the sample with high score , And adjust the ratio of positive samples to negative samples to 1:3, To strengthen the network's ability to identify false positives .( I don't understand here , Leave a hole )
experiments
Used Tusimple Data set and CuLane Data sets .
The evaluation index :accuracy,FP,FN


summary
PointLaneNet yes one-stage Network structure , A network outputs the location information of lane lines and lane line classification information at the same time , Create a horizontal line on the input image , There is a unique intersection between the straight line and the lane line , By finding the starting point of the lane line , Termination point , The center point and the width of the lane line determine the shape of the lane line and the classification of the lane , The final output of the network is : Offset , The starting point , Confidence of lane line .( y It's pre-set ( Horizontal line ), So if you want to determine the coordinates of each point, you only need to determine the offset of that point ); Besides , Defines the lane line and between the lane lines , Distance between point and lane line ; Set a threshold to determine whether the detected lane line is a positive sample or a negative sample .
边栏推荐
猜你喜欢

基于.NetCore开发博客项目 StarBlog - (16) 一些新功能 (监控/统计/配置/初始化)

智能指针shared_ptr、unique_ptr、weak_ptr

使用 WebSocket 实现一个网页版的聊天室(摸鱼更隐蔽)

人们为什么热衷于给事物排序

哈希表与一致性哈希的原理理解以及应用
OD-Paper【3】:Faster R-CNN: Towards Real-Time Object Detection with Region Proposal Networks

Plato Farm全新玩法,套利ePLATO稳获超高收益

杀毒软件 clamav 的安装和使用
OD-Paper【3】:Faster R-CNN: Towards Real-Time Object Detection with Region Proposal Networks

用最原始的方法纯手工实现常见的 20 个数组方法
随机推荐
MarqueeView实现滑动展示效果
哈希表与一致性哈希的原理理解以及应用
关于url编解码应该选用的函数
调用JShaman的Web API接口,实现JS代码加密。
次轮Okaleido Tiger即将登录Binance NFT,引发社区热议
Inftnews | ggac and China Aerospace ases exclusively produce "China 2065 Collection Edition"
八皇后编程实现
【RYU】安装RYU常见问题及解决办法
"Software testing" packaging resume directly improves the pass rate from these points
使用 WebSocket 实现一个网页版的聊天室(摸鱼更隐蔽)
机器学习【Matplotlib】
Rust web (I) -- self built TCP server
[binary search medium] leetcode 34. find the first and last positions of elements in the sorted array
CS224W fall 1.2 Applications of Graph ML
数据资产管理的概念
Comprehensive summary of shell analysis log file commands
[NISACTF 2022]上
Quick sort
Debezium series: pull historical data based on debezium offset to ensure that data is not lost
Scheduling of processes