当前位置:网站首页>Matplotlib histogram of Matplotlib visualization plt bar()
Matplotlib histogram of Matplotlib visualization plt bar()
2022-06-29 23:24:00 【Guoqingru】
matplotlib matplotlib Visual histogram plt.bar()

#  Prepare the data
xiaoming_score = [80,75,65,58,75,80,90]  # Xiao Ming's achievements in various subjects
xiaohong_score =[90,85,75,62,75,60,80]   # Xiao Hong's grades in all subjects
subjects = [' Chinese language and literature ',' English ',' mathematics ',' Physics ',' chemical ',' biological ',' sports ']

Argument parsing :
plt.bar(x = np.arange(7),        #  Abscissa
        height = xiaoming_score, #  Columnar height
        width = 0.35,            #  Columnar width
        label = ' Xiao Ming ',          #  label
        edgecolor = 'k',         #  Border color
        color = 'r',             #  Histogram color
        tick_label = subjects,   #  Coordinate labels for each bar graph
        linewidth= 3)            #  Bar chart border width
plt.legend() # Show labels
plt.show()

Cluster bar chart : Drawing by controlling horizontal axis coordinates
#  mapping
plt.figure(figsize = (10,7))
plt.bar(x = np.arange(7),height = xiaoming_score,width = 0.35,label = ' Xiao Ming ',edgecolor = 'white',color = 'r',tick_label = subjects)
plt.bar(x = np.arange(7)+0.35,height = xiaohong_score,width = 0.35,label = ' Xiaohong ')

#  Supplementary title and label
plt.title(' Xiao Ming 、 Comparison of Xiaohong's achievements in various subjects ') #  Title of figure
plt.xlabel(' subject ',fontsize = 15)   #  Horizontal axis label
plt.ylabel(' achievement ',fontsize = 15)  #  Vertical label
plt.xticks(np.arange(7)+0.17,subjects,fontsize = 12)  #  Bar chart horizontal axis coordinates each category label
plt.legend()  #  Show labels for two sets of histograms

#  Note the values of each bar chart , Here is the score
for i in range(len(subjects)):
    plt.text(x = i-0.1, y = xiaoming_score[i]+1,s = xiaoming_score[i] ) # s Indicates the content of the comment
for i in range(len(subjects)):
    plt.text(x = i+0.3, y = xiaohong_score[i]+1,s = xiaoming_score[i] )
#  Display images
plt.show()

#  mapping
plt.bar(x = subjects, height = xiaoming_score, label = ' Xiao Ming ', color = 'steelblue', alpha = 0.8, width = 0.35)
plt.bar(x = subjects, height = xiaohong_score, label = ' Xiaohong ', color = 'indianred', alpha = 0.8, width = 0.35, bottom=xiaoming_score)

#  Supplementary title and label
plt.title(' Xiao Ming 、 Comparison of Xiaohong's achievements in various subjects ') #  Title of figure
plt.xlabel(' subject ',fontsize = 15)   #  Horizontal axis label
plt.ylabel(' achievement ',fontsize = 15)  #  Vertical label
plt.xticks(np.arange(7),subjects,fontsize = 12)  #  Bar chart horizontal axis coordinates each category label
plt.legend()  #  Show labels for two sets of histograms

#  Note the values of each bar chart , Here is the score
for i in range(len(subjects)):
    plt.text(x = i-0.1, y = xiaoming_score[i]-30,s = xiaoming_score[i] )
for i in range(len(subjects)):
    plt.text(x = i-0.1, y = xiaohong_score[i]+30,s = xiaoming_score[i] )

plt.show()

边栏推荐
- 股票开户安全吗?上海股票开户。
- 微博系统中”微博评论“的高性能高可用计算架构
- 二叉树的序列化 力扣 297. 二叉树的序列化与反序列化 652. 寻找重复的子树
- 十大券商:“推土机行情”再现
- Fund valuation, expenses and accounting
- Procurement intelligence is about to break out, and the "3+2" system of Alipay helps enterprises build core competitive advantages
- Solr basic operation 4
- Solution to version conflict of flutter plug-in
- 2022年PMP项目管理考试敏捷知识点(5)
- Solr基础操作5
猜你喜欢

2022年PMP项目管理考试敏捷知识点(5)

剑指 Offer 38. 字符串的排列

论文阅读《Large-Scale Direct SLAM with Stereo Cameras》

NRM explanation
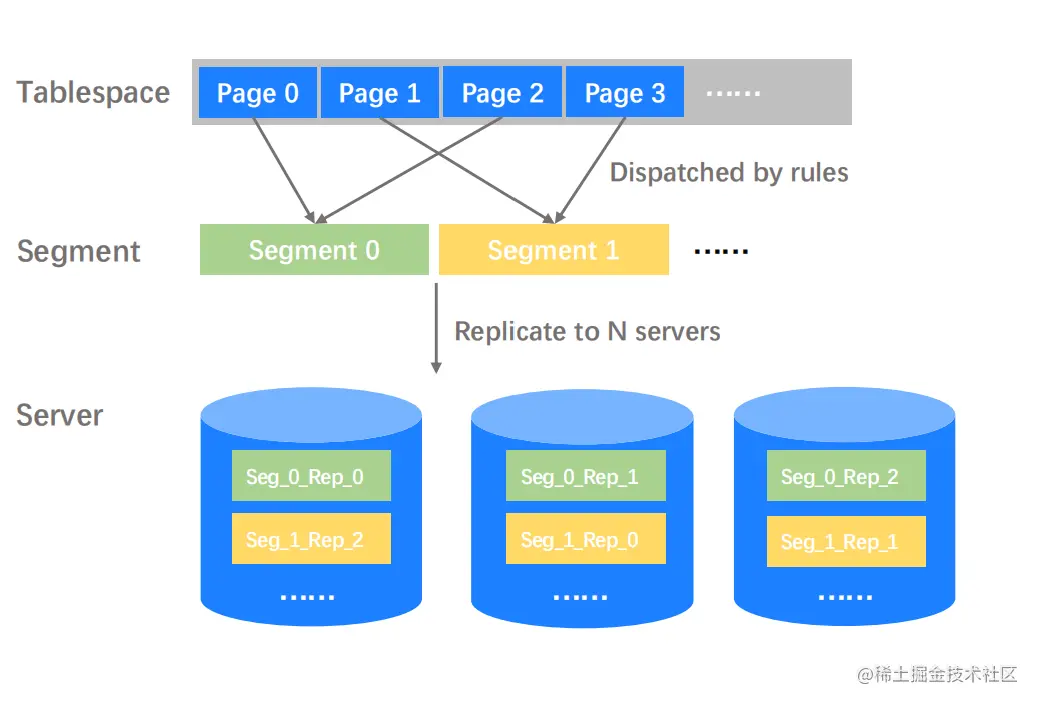
Evolution from stand-alone to distributed database storage system

Go zero micro Service Practice Series (VII. How to optimize such a high demand)

Node data collection and remote flooding transmission of label information

软件测试 接口测试 Jmeter 5.5 安装教程

Intranet penetration (NC)

什么是IGMP?IGMP与ICMP有啥区别?
随机推荐
SYSTEMd debugging
提供有效的绩效评估
十大券商:“推土机行情”再现
大学里遗憾的事,希望你无怨也无悔
什么是IGMP?IGMP与ICMP有啥区别?
Paper writing tool: latex online website
RRDtool 画MRTG Log数据
High performance and high availability computing architecture of "Weibo comments"
写论文工具:LaTex在线网站
Metaq cluster installation test
redis客户端
缓冲流练习
Evaluation of powerful and excellent document management software: image management, book management and document management
Evolution from stand-alone to distributed database storage system
NRM explanation
C language tutorial – -6 loop statement
股票开户安全吗?上海股票开户。
关于二叉树
Qt中使用QDomDocument和QDomnode来读取xml
基金的信息披露