当前位置:网站首页>Beijing rental data analysis
Beijing rental data analysis
2022-07-02 15:26:00 【Little doll】
1. Basic data processing
import pandas as pd
import numpy as np
import matplotlib.pyplot as plt
import seaborn as sns
from pylab import mpl # Set display Chinese font
mpl.rcParams["font.sans-serif"] = ["SimHei"]
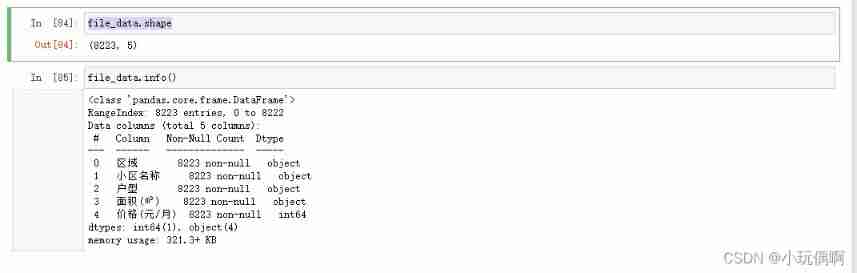
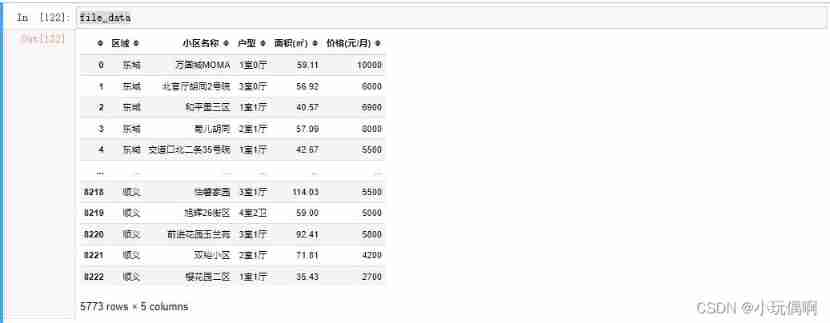
file_data=pd.read_csv("./data/ Lianjia Beijing rental data .csv")
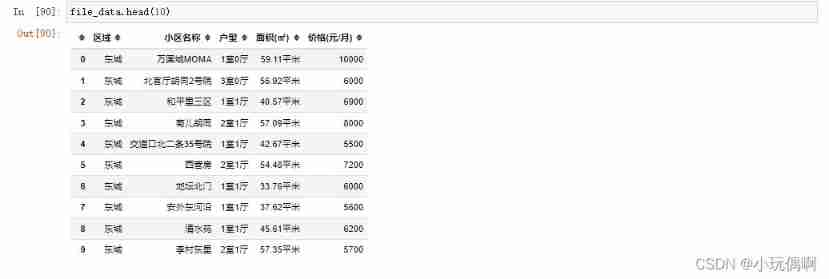
file_data.head(10)

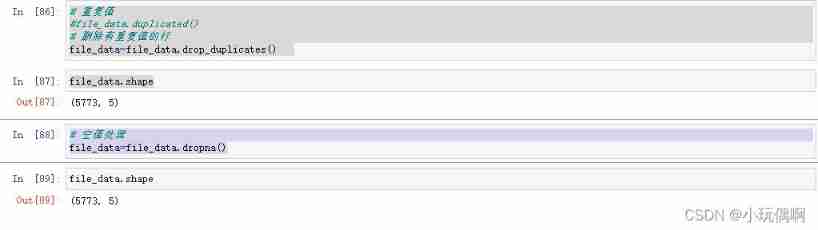
1.1 Processing of duplicate values and null values
#  duplicate value
#file_data.duplicated()
#  Delete rows with duplicate values
file_data=file_data.drop_duplicates()

#  Null processing
file_data=file_data.dropna()
1.2 Data type conversion
1.2.1 Area data type conversion
#  Single value implementation
file_data[" area (㎡)"].values[0][:-2]

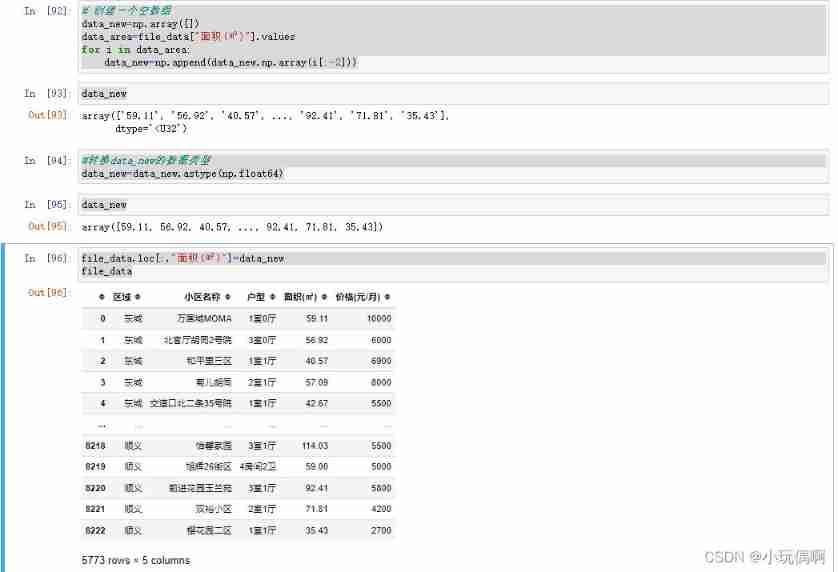
#  Create an empty array
data_new=np.array([])
data_area=file_data[" area (㎡)"].values
for i in data_area:
    data_new=np.append(data_new,np.array(i[:-2]))

data_new
# transformation data_new Data type of
data_new=data_new.astype(np.float64)
data_new
file_data.loc[:," area (㎡)"]=data_new
file_data
1.2.2 House type expression replacement
file_data.head()

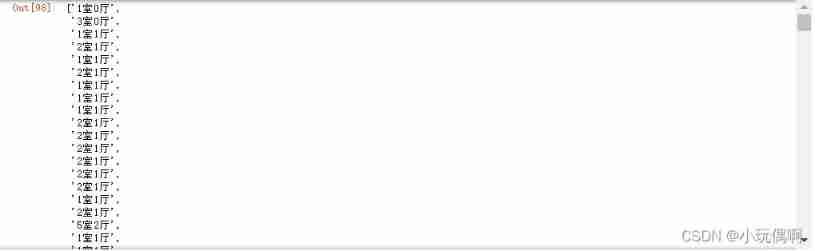
house_data=file_data[" House type "]
house_data.head()
temp_list=[]
for i in house_data:
    new_info=i.replace(" room "," room ")
    temp_list.append(new_info)
temp_list
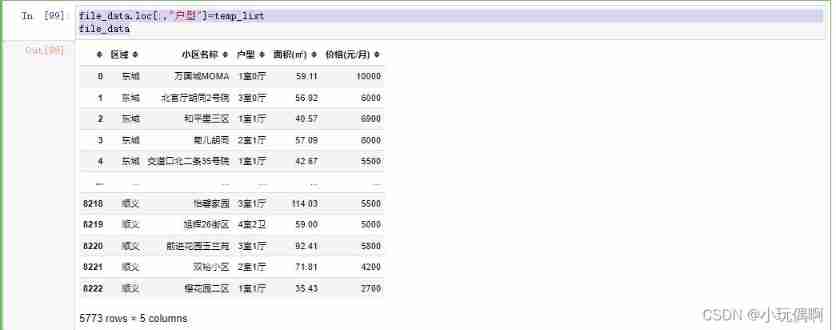
file_data.loc[:," House type "]=temp_list
file_data
1.3 Chart analysis
1.3.1 Number of houses available , Location distribution analysis
file_data[" Area "].unique() # Find out all the locations of the listing information

new_df=pd.DataFrame({
    " Area ":file_data[" Area "].unique()," Number ":0*13})

#  Get the number of listings in each area
area_count=file_data.groupby(by=" Area ").count()
area_count

new_df[" Number "]=area_count.values
new_df.sort_values(by=" Number ",ascending=False)

1.3.2 Analysis of house type quantity
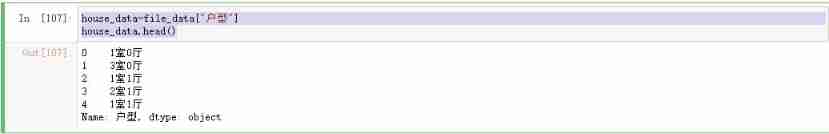
house_data=file_data[" House type "]
house_data.head()
def all_house(arr):
    key=np.unique(arr)
    result={
    }
    for k in key:
        mask=(arr==k)
        arr_new=arr[mask]
        v=arr_new.size
        result[k]=v
    return result


housr_info=all_house(house_data)
np.unique(house_data)

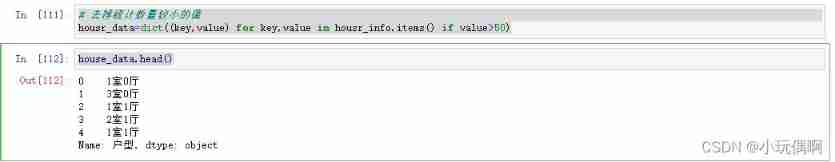
#  Remove the value with smaller statistical quantity
housr_data=dict((key,value) for key,value in housr_info.items() if value>50)
house_data.head()
show_houses=pd.DataFrame({
    " House type ": [x for x in house_data.values],
              " Number ": [x for x in house_data.keys()]})
show_houses=show_houses.head(11)
show_houses

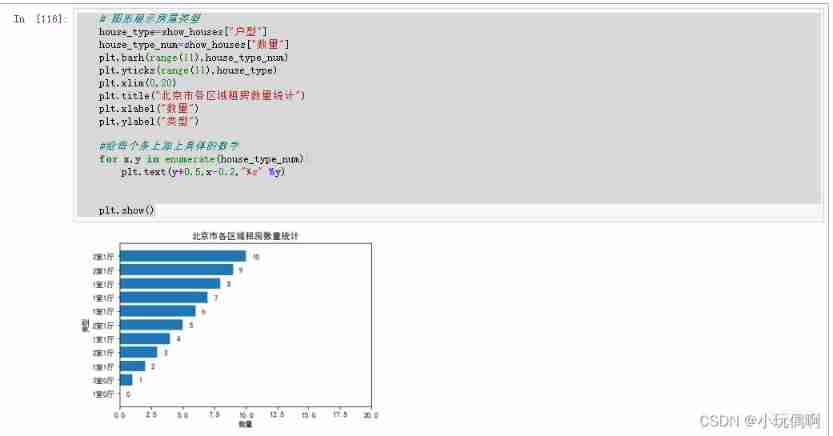
#  Graphic display of house type
house_type=show_houses[" House type "]
house_type_num=show_houses[" Number "]
plt.barh(range(11),house_type_num)
plt.yticks(range(11),house_type)
plt.xlim(0,20)
plt.title(" Statistics on the number of rental houses in various regions of Beijing ")
plt.xlabel(" Number ")
plt.ylabel(" type ")

# Add specific numbers to each bar
for x,y in enumerate(house_type_num):
    plt.text(y+0.5,x-0.2,"%s" %y)


plt.show()
1.3.3 Average rent analysis
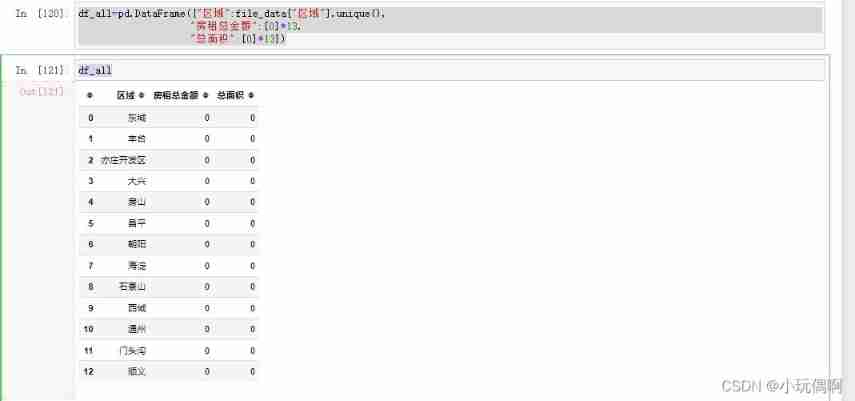
df_all=pd.DataFrame({
    " Area ":file_data[" Area "].unique(),
                    " Total rent ":[0]*13,
                    " Total area ":[0]*13})
df_all
sum_price=file_data[" Price ( element / month )"].groupby(file_data[" Area "]).sum()
sum_area=file_data[" area (㎡)"].groupby(file_data[" Area "]).sum()

sum_price
sum_area

df_all[" Total rent "]=sum_price.values
df_all[" Total area "]=sum_area.values
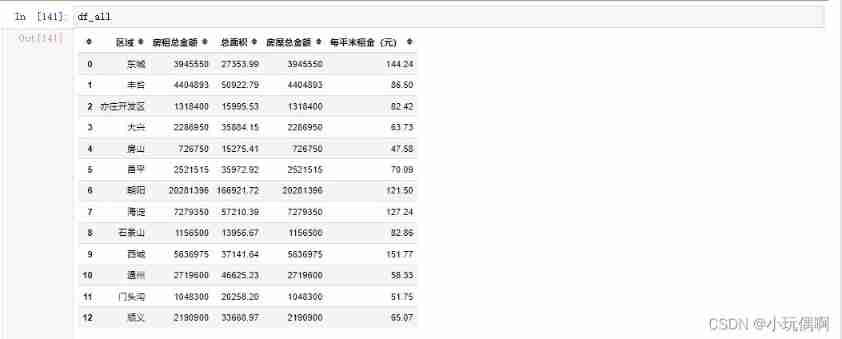
# Calculate the rent per square meter of each area
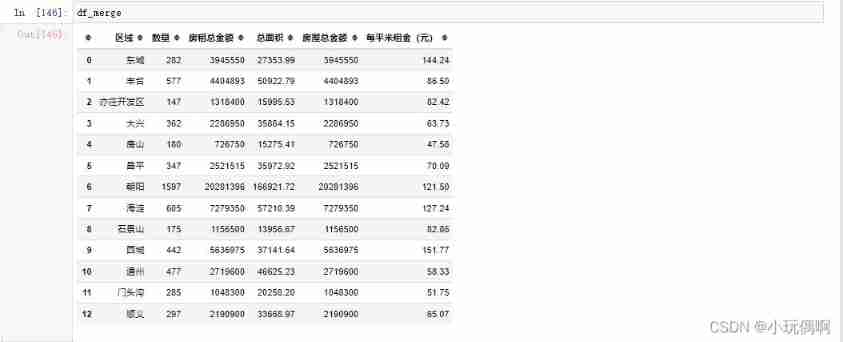
df_all[" Rent per square meter ( element )"]=round(df_all[" Total rent "]/df_all[" Total area "],2) # 2 Express Keep two decimal places

df_merge=pd.merge(new_df,df_all) # Merge two tables
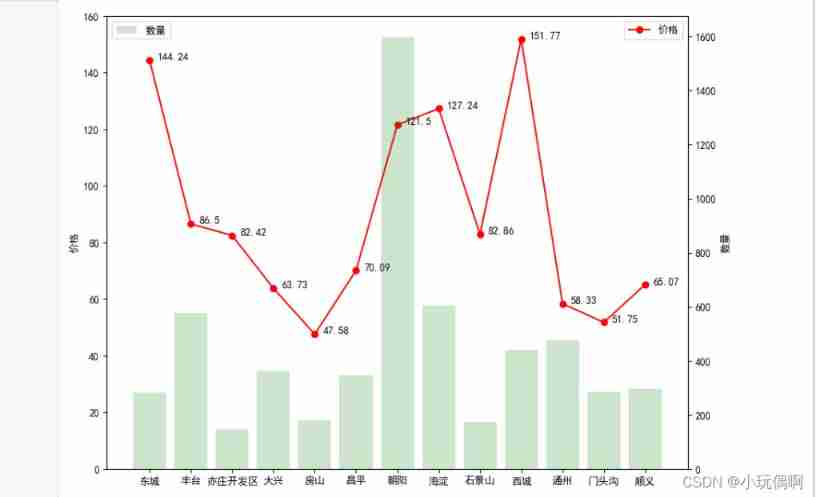
#  Graphic visualization
num=df_merge[" Number "]
price=df_all[" Rent per square meter ( element )"]
lx=df_merge[" Area "]
l=[i for i in range(13)]

# Create a canvas
fig=plt.figure(figsize=(10,8),dpi=100)
# Show line chart
ax1=fig.add_subplot(111)
ax1.plot(l,price,"or-",label=" Price ")
for i,(_x,_y) in enumerate(zip(l,price)):
    plt.text(_x+0.2,_y,price[i])
ax1.set_ylim([0,160])
ax1.set_ylabel(" Price ")
plt.legend(loc="upper right")

# Show bar chart
ax2=ax1.twinx()
plt.bar(l,num,label=" Number ",alpha=0.2,color="green")
ax2.set_ylabel(" Number ")
plt.legend(loc="upper left")
plt.xticks(l,lx)
plt.show()
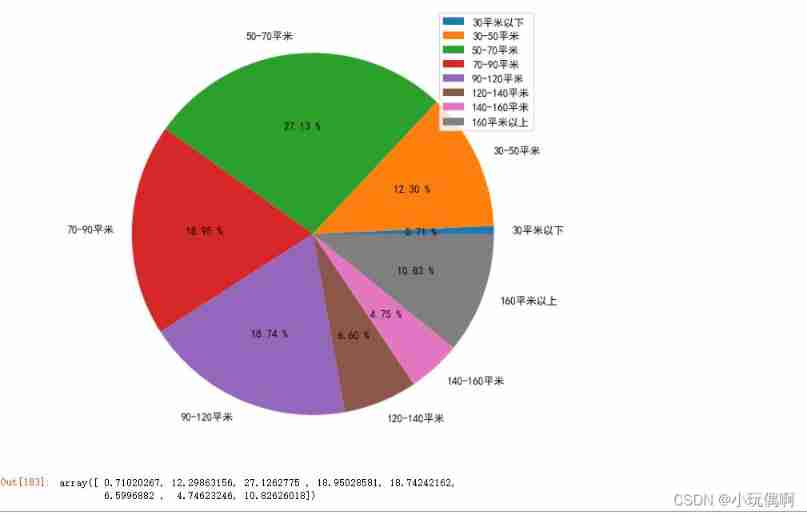
1.3.4 Area interval analysis
#  Check the maximum and minimum area of the house
print(' The largest area of the house is %d Square meters '%(file_data[' area (㎡)'].max()))
print(' The minimum area of the house is %d Square meters '%(file_data[' area (㎡)'].min()))
#  Check the maximum and minimum rent
print(' The maximum rent is per month %d element '%(file_data[' Price ( element / month )'].max()))
print(' The minimum price of the house is per month %d element '%(file_data[' Price ( element / month )'].min()))

# Area division
area_divide=[1,30,50,70,90,120,140,160,1200]
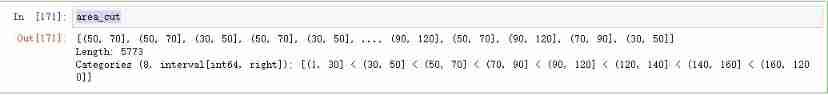
area_cut=pd.cut(list(file_data[" area (㎡)"]),area_divide)
area_cut
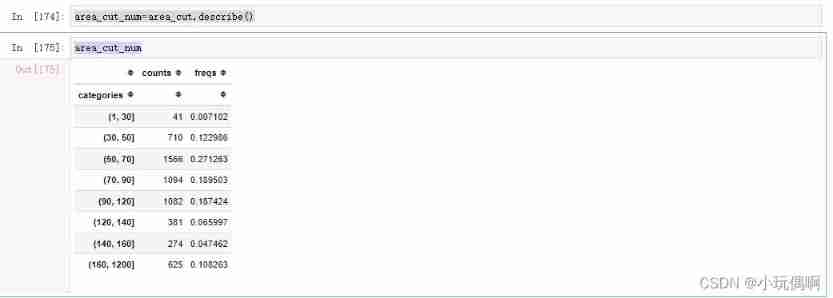
area_cut_num=area_cut.describe()
area_cut_num
#  Image visualization
area_per=(area_cut_num["freqs"].values)*100
labels = ['30 Below square meters ', '30-50 Square meters ', '50-70 Square meters ', '70-90 Square meters ', '90-120 Square meters ','120-140 Square meters ','140-160 Square meters ','160 Square meters or more ']
plt.figure(figsize=(20,8),dpi=100)
plt.axes(aspect=1)
plt.pie(x=area_per,labels=labels,autopct="%.2f %%")

plt.legend()
plt.show()

area_per
边栏推荐
- 15_Redis_Redis.conf详解
- 2021-2022學年編譯原理考試重點[華僑大學]
- Points clés de l'examen de principe de compilation pour l'année scolaire 2021 - 2022 [Université chinoise d'outre - mer]
- 工程师评测 | RK3568开发板上手测试
- GeoServer offline map service construction and layer Publishing
- Key points of compilation principle examination in 2021-2022 academic year [overseas Chinese University]
- 党史纪实主题公益数字文创产品正式上线
- 03_线性表_链表
- 17_ Redis_ Redis publish subscription
- Case introduction and problem analysis of microservice
猜你喜欢


![[c voice] explain the advanced pointer and points for attention (2)](/img/fb/515e25899bd9a2905ee63cb041934a.png)


随机推荐
Application of CDN in game field
Jenkins Pipeline 应用与实践
【网络安全】网络资产收集
The traversal methods of binary tree mainly include: first order traversal, middle order traversal, second order traversal, and hierarchical traversal. First order, middle order, and second order actu
17_ Redis_ Redis publish subscription
AtCoder Beginner Contest 254
Map introduction
yolo格式数据集处理(xml转txt)
學習使用php實現公曆農曆轉換的方法代碼
牛客练习赛101
08_ 串
Sharp tool SPL for post SQL calculation
[solution] educational codeforces round 82
让您的HMI更具优势,FET-G2LD-C核心板是个好选择
Recommended configuration of tidb software and hardware environment
03_线性表_链表
17_Redis_Redis发布订阅
Internet Explorer officially retired
php获取数组中键值最大数组项的索引值的方法
编译原理课程实践——实现一个初等函数运算语言的解释器或编译器