当前位置:网站首页>Use the process monitor tool to monitor process operations on registries and files
Use the process monitor tool to monitor process operations on registries and files
2022-06-24 10:52:00 【dvlinker】
Catalog
3、 Monitoring process operation registry activity cases
3.1、 Under high display ratio, most software interfaces will become very fuzzy
3.2、 How to set to make the software display clearer ?
3.3、 Use Process Monitor Monitor the operation of the registry corresponding to the above settings
4、 Monitoring process operation file activity cases
Use Process Monitor Can monitor the target process to the registry 、 Operation activities of documents, etc , To facilitate the positioning and troubleshooting of some problems . Let's talk about it today , How to use Process Monitor Tools , And give relevant troubleshooting cases , For reference .
1、 summary
Use Process Monitor The target process can be monitored against the registry 、 file 、 Operation activities of network, etc , To assist in locating and troubleshooting some problems encountered during the operation of some software . For example, we can use this tool to monitor that the target process is writing to the registry , The path and content written , You can monitor which module generated a file ( You can view the complete function call stack when creating the file ), We have used these two aspects of monitoring in actual projects .
2、 How to use Process Monitor
When starting the tool , The window for setting filter conditions will pop up :

Generally, we need to set the process name of the target program to be monitored . Find it in the drop-down box Process Name term , Enter... In the condition input box The process name of the program to monitor :
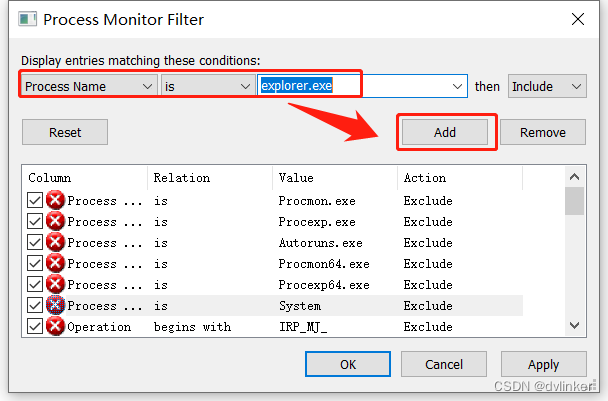
Click on Add button . If it is not set at startup , Close the filter condition setting window directly , You can also click the funnel-shaped button in the toolbar , Open the filter condition setting window manually .

Why should I set the filter conditions for the process name ? Because there are many processes running in the system , If no filter condition is set , All processes are monitored by default , A large number of monitoring items will be generated , It will be very troublesome to check . In order to narrow the monitoring range , We usually need to set the process name for filtering .
In addition to setting filter conditions , It is also necessary to cancel the irrelevant activity monitoring , If the registry operation activity is detected , Cancel other activity monitoring in the toolbar . If you don't cancel , Will monitor many types of records , It will be inconvenient to check .
The tool will automatically start monitoring after startup , You can click the button that looks like a magnifying glass , Stop monitoring first , Start monitoring when you are ready to monitor an activity , This will reduce monitoring records . After the operation to be monitored , Click this button , Stop monitoring immediately , Avoid the continuous generation of irrelevant monitoring records .

After stopping monitoring , You can search by keyword in the monitoring results list , To find relevant records .
3、 Monitoring process operation registry activity cases
3.1、 Under high display ratio, most software interfaces will become very fuzzy
stay win7 or win10 In the system , Set the display scale of the system to be greater than 100% After the display scale of , Many programs will become very vague , The program display effect is enlarged , The system will automatically enlarge the software interface simply and roughly , Words and pictures are getting bigger , Also become very vague , As shown below :( With Dependency Walker Tools, for example )

However, some software still shows clearly , and 100% As clear as when displaying the scale , For example, Tencent Department QQ、PC Version wechat 、 Tencent conference and other software , These software all implement scaling by themselves , The system's scaling is disabled , So it can maintain good clarity .
However, it is necessary to realize the scaling following the display scale of the system , It will be technically difficult , To deal with various details , Bad handling , There will be a lot of them bug, So most software vendors still rely on simple scaling of the system . Many uses QT The developed program can automatically adapt to the scaling of the system , because QT The library has been added to the system DPI The adaptation of .
3.2、 How to set to make the software display clearer ?
For most software , Is there any way to ensure good definition under high display ratio ? The answer is yes ,Windows The system provides relevant settings . You can right-click exe Procedure or exe Shortcuts to programs , Click... In the file properties window Compatibility tab , Click... At the bottom of the window “ Change height DPI Set up ” Button :

Below the open window “ high DPI The zoom ” bar , Check “ Replace high DPI Zoom behavior ”:

Select... From the drop-down list “ Applications ” term , This prevents the system from scaling , The program still follows 100% Size display , So you can continue to maintain clarity .
But there's a problem , On the high-resolution display , such as 2K Screen Microsoft Surface On a tablet , It's usually set to 150% And above , If system scaling is disabled , The window will be very small , The buttons are smaller , It can't be used at all , So you still need to use system scaling , So how to ensure clarity ? this Windows The system also takes into account , You can select... From the drop-down box “ System enhancements ”:

The system will make the zoom effect clearer .
3.3、 Use Process Monitor Monitor the operation of the registry corresponding to the above settings
If the customer encounters the problem that the window is enlarged and blurred , We can't tell them to do the above settings one by one , So is it possible to set it automatically through code ? The manual setting described above , Where does the system save the setting information ? I think it's probably saved in the registry , So I want to use Process Monitor To monitor registry activity , See if you can find the path where the information is saved in the registry and what information is written to the registry .
The above setting window belongs to the resource manager process explorer.exe Of , So we are Process Monitor Set the process to be monitored to explorer.exe:

Then cancel the monitoring of other activities , Only registry activity is monitored .
Then turn on monitoring , Manually press the above process to operate , Then stop monitoring . Because this high display ratio should be the same as DPI dependent , So press Ctrl+F Call up the search box , Input DPI keyword :
Search the monitored results . Multiple records can be searched by keyword , Can be pressed F3 Shortcut keys switch back and forth between these records that meet the conditions . Keyword matching results , To be screened , See which record is related to the current operation .
Because the above setting operation is to write to the database , So we just need to focus on RegSetValue The operation of , Later, I found the location where the registry was written :

The corresponding registry location is HKEY_CURRENT_USER\SOFTWARE\Microsoft\Windows NT\CurrentVersion\AppCompatFlags\Layers, Written in key The value is exe Program path ,Value The value is :
1) Application options , Yes disable system scaling , The program always keeps 100% Display scale , The content written is :~HIGHDPIAWARE
2) System enhancement options , Use system zoom , The system improves the clarity of the display , The content written is :~ GDIDPISCALING DPIUNAWARE
Know the location and contents of the registry , We can implement this setting through code .
4、 Monitoring process operation file activity cases
For example, when testing software , It is found that some temporary log files will be generated during the operation of the software , For example, once we encountered a software that would generate a log file on the desktop , Obviously this is intolerable , Logs should be managed uniformly , All unnecessary log files should be cleaned up .
But we don't know which modules generate these log files , Asked the development and maintenance group of the underlying module , No one claimed it , I can't figure out which module generated this log , There is no way to clean up . Later, we recommended to our test colleagues Process Monitor Tools , This tool monitors the file activity of our software , See which module generated this file , Finally, I did find it .
Here is an example of a monitoring file , For your reference . For example, we need to monitor TestScreenCatch.exe Which module in the program generates screencatch.log file :( This is just an example , Here, you can guess which module generated it by the file name )

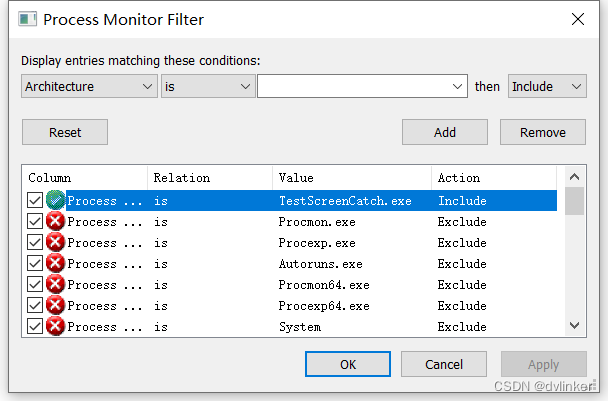
Start... First Process Monitor Tools , Set the process to be monitored to TestScrrenCatch.exe:
Turn on Monitoring . Rerun TestScrrenCatch.exe Program , With code direction screencatch.log Write a log in the file , Then stop Process Monitor Monitoring of .
Then press Ctrl+F Shortcut key , Call up the search window , Input screencatch.log keyword To search , Find operation screencatch.log Records of documents , Double click the record , Open the details page of the record :

Switch to stack TAB , View the function call stack of the thread where the current operation is located :

Interface of the top system library , Pull down the call stack , Call found fopen perhaps WriteFile Interface , Next, you can see the interfaces of specific business modules :

Found to be screenctach.dll The relevant interface of the library is to screencatch.log File write content . But because of the lack of pdb file , Unable to see the specific interface .
We can try it first PEViewer Tool View screenctach.dll Library Time stamp ( Generate screenctach.dll Library time ):

Then, according to the timestamp, go to the version server to find screenctach.dll Library corresponding to pdb file , take pdb Files in screenctach.dll In the sibling directory of the library , Double click the record you just viewed ,Process Monitor Will automatically search from the current directory pdb file , And then automatically load . Because of the screenctach.dll Library pdb Symbol , The specific interface and line number are displayed in the function call stack , As shown below :

In this way, we can know which module and which code operation it is screencatch.log The file , Find the generation screencatch.log The source of the document .
边栏推荐
- Which map navigation is easy to use and accurate?
- Window function row in SQL Server_ number()rank()dense_ rank()
- P5.js paper crane animation background JS special effect
- Act as you like
- Image click enlargement and adaptive size in the applet rich text
- Customize the toolbars of the kindeditor editor. Items removes unnecessary toolbars or retains some toolbars
- 今日睡眠质量记录76分
- What is wireless WiFi? What are the benefits of wireless WiFi
- Differences among cookies, session, localstorage and sessionstorage
- Cookie 、Session、localstorage、Sessionstorage的区别
猜你喜欢

2022年智能机器人与系统国际研讨会(ISoIRS 2022)
Sort out interface performance optimization skills and kill slow code

腾讯开源项目「应龙」成Apache顶级项目:前身长期服务微信支付,能hold住百万亿级数据流处理...

线程运行原理
![[energy reports] International Conference on energy and environmental engineering in 2022 (cfeee 2022)](/img/48/11bd949fa3695452270c3625d63e6d.jpg)
[energy reports] International Conference on energy and environmental engineering in 2022 (cfeee 2022)

Cool interactive animation JS special effects implemented by p5.js

初识string+简单用法(一)

Plant growth H5 animation JS special effect

P5.js paper crane animation background JS special effect

Apple's legendary design team disbanded after jobs refused to obey cook
随机推荐
Leetcode-2221: triangular sum of arrays
机械臂速成小指南(二):机械臂的应用
机械臂速成小指南(一):机械臂发展概况
Thread operation principle
机械臂速成小指南(零):指南主要内容及分析方法
A method to solve the self-adaptive width and height of the internal picture of rich text label in wechat applet
使用Process Monitor工具监测进程对注册表和文件的操作
[IEEE publication] 2022 International Conference on industrial automation, robotics and Control Engineering (iarce 2022)
Distributed transaction principle and solution
Younger sister Juan takes you to learn JDBC --- 2-day sprint Day1
[energy reports] International Conference on energy and environmental engineering in 2022 (cfeee 2022)
Image click enlargement and adaptive size in the applet rich text
Stack Title: exclusive time of function
Virtual CD-ROM function how to use and install virtual CD-ROM
[IEEE publication] 2022 International Conference on intelligent transportation and future travel (cstfm 2022)
Common third-party UI frameworks
Practice sharing of packet capturing tool Charles
喜歡就去行動
Spark提交参数--files的使用
2022 the most complete and detailed JMeter interface test tutorial and detailed interface test process in the whole network - JMeter test plan component (thread < user >)