当前位置:网站首页>Data visualization practice: Experimental Report
Data visualization practice: Experimental Report
2022-06-26 06:07:00 【Ah, teacher Q】
Data visualization experiment report
1. Project background
1.1 Description of project
The project intends to movie.csv Data visualization
1.2 Data field description
id—— Serial number
movieId—— Movie number
title—— The movie name
cover—— Photo URL
rate—— score
director—— The director
composer—— The writers
actor—— actor
category—— type
district—— region
language—— Language
showtime—— Performance time
length—— Duration
2. Raise questions
What is the relationship between the type of film and the average score 、2000 What are the top ten movies rated since 、2010-2015 What changes have taken place in the top five categories of film production in ?
3. Understand the data
3.1 Collect data
Data sources :movie.csv
3.2 Import data
Based on the questions raised , That's right csv File data acquisition . And then through pandas Operation read csv Document and usecols Import the data of the specified column .
1.
2.
3.
3.3 View dataset information
Pictured 1.2.3:
4. Data cleaning
4.1 Data preprocessing
4.1.1 Abnormal data processing
because category The column data is null , First, it is tested with “ Missing data for type ” Filling treatment .
4.2 Feature Engineering
4.2.1 feature extraction
1. What is the relationship between the type of film and the average score ?
because category There may be many types of data in each cell , So press it first “/” Split , And convert the result into DataFrame; After break up , Then output in the form of columns ; After row column conversion , The index needs to be reset ; Last , Data processing finished , take new_category Replace the column of with category Column . The second step , Get the average score for each type , I'm going to call it Average_rate Spliced in the table ; Get the total number of times for each movie type , I'm going to call it Count_category Spliced in the table ; At the same time, the data of the type column is de duplicated and the average score is used to sort from high to low . The third step , Get the type separately 、 Average score 、 Type times are output in the form of a list .
The result is shown in Fig. :
2.2000 What are the top ten movies rated since ?
First of all, the performance time sequence is greater than 2000 Year's conditional screening ; And then sort them from high to low , And get the first ten rows of data ; And then generate ‘rank’ Data as a rank column ; Finally, the data is output in the form of a list .
The result is shown in Fig. :
3.2010-2015 What changes have taken place in the top five categories of film production in ?
Press first 2010-2015 Traverse , Then filter by the data of the staging time column , Finally, the type column is treated in the same way as the first question .
The result is shown in Fig. :
5. Data visualization
5.1 The relationship between film type and average score
Bar-Mixed_bar_and_line chart :
The figure shows that the average score of the film type decreases from left to right , The average score of the child type is the highest , The type of terror is the lowest ; The number of plots is the most , common 2376 Time , absurd 、 The number of surprises and suspense is the lowest , Only 1 Time .
Funnel-Funnel_chart chart :
This figure simply extracts the top five movie types with average scores from the above information , They are children 、 Black movies 、 absurd 、 Missing data for type ( This type is a padding for null values )、 Animation .
5.2 2000 The top ten films rated since
Table-Table_base chart :
The picture shows 2000 Ranking of the top ten films since , The highest movie score is 9.3, Their films are called brilliant life 、 Wall-E , The performance time is 2003、2008.
5.3 2010-2015 Changes in production of film types in
Timeline-Timeline_bar_reversal chart :
The picture shows 2010 - 2015 Dynamic changes in the production of the top five film types in , Among them, the output of different types decreased from top to bottom .
边栏推荐
- Status mode, body can change at will
- 跨域的五种解决方案
- Younger sister Juan takes you to learn JDBC -- two days' Sprint Day2
- Day2- syntax basis and variables
- Ribbon load balancing service call
- numpy. frombuffer()
- kolla-ansible部署openstack yoga版本
- numpy. random. choice
- 组合模式、透明方式和安全方式
- Logstash - logstash pushes data to redis
猜你喜欢
kolla-ansible部署openstack yoga版本

工厂方法模式、抽象工厂模式

Typora activation method
从新东方直播来探究下小程序音视频通话及互动直播

组合模式、透明方式和安全方式
![[intra group questions semester summary] some reference questions for beginners](/img/39/ba5b7ce3ab86433f29c9fa3ced4ddd.jpg)
[intra group questions semester summary] some reference questions for beginners
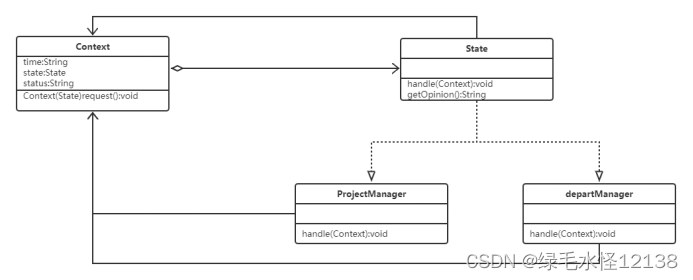
状态模式,身随心变

Household accounting procedures (First Edition)
Kolla ansible deploy openstack Yoga version

Pytorch (environment, tensorboard, transforms, torchvision, dataloader)

随机推荐
MobileNets: Efficient Convolutional Neural Networks for Mobile Vision Applications
Unicloud cloud development obtains applet user openid
SQL server functions
Selective search for object recognition paper notes [image object segmentation]
Mongodb——使用Mongodb对字段中字符串内容进行截取,并进行分组统计
University Information Management System
电商借助小程序技术发力寻找增长突破口
ES6的搭配环境
String class learning
Handwritten background management framework template (I)
Last flight
5分钟包你学会正则表达式
numpy.frombuffer()
C generic speed
Tencent WXG internship experience (has offered), I hope it will help you!
Machine learning 07: Interpretation of PCA and its sklearn source code
Interface oriented programming
COW读写复制机制在Linux,Redis ,文件系统中的应用
Logstash -- send an alert message to the nail using the throttle filter
Explore small program audio and video calls and interactive live broadcast from New Oriental live broadcast