当前位置:网站首页>PyQt5_ Qscrollarea content is saved as a picture
PyQt5_ Qscrollarea content is saved as a picture
2022-07-02 14:09:00 【Procedural ape and finance and technology】
This article provides two examples , A simple , A complex . Students with a poor foundation can watch the first , Single and clear function ; The second example is more complex , It is to draw multiple curves according to a theme , There are many other function points ( I mentioned in my previous blog ), Students with weak foundation are easy to faint .
Catalog
effect :
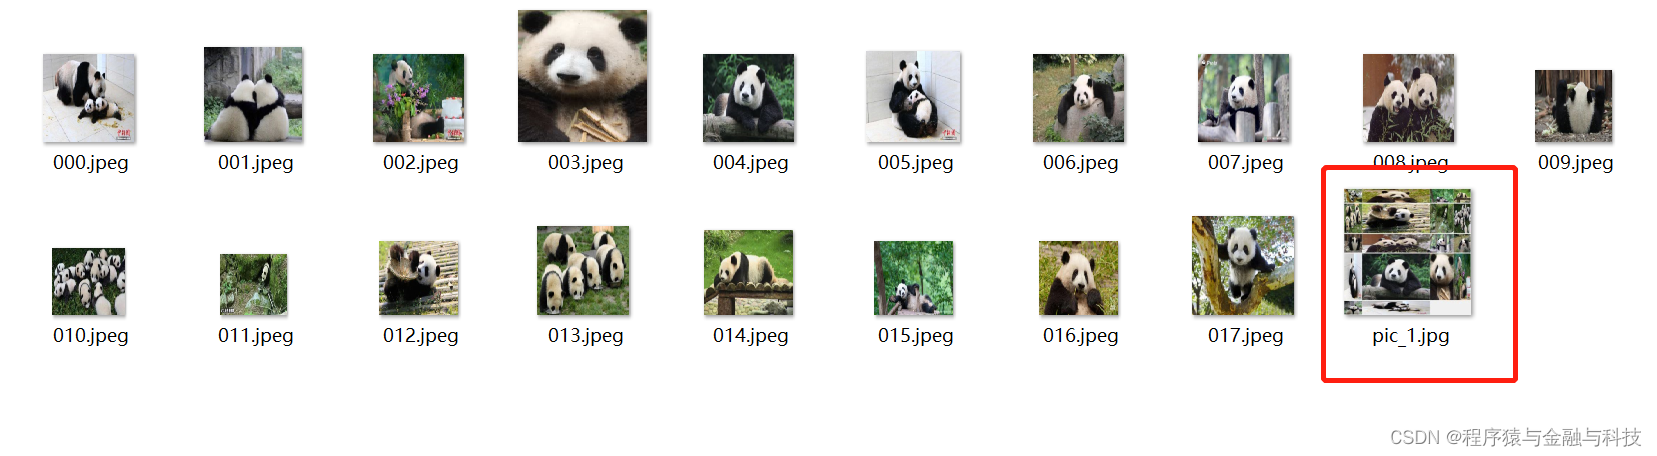
Example 1

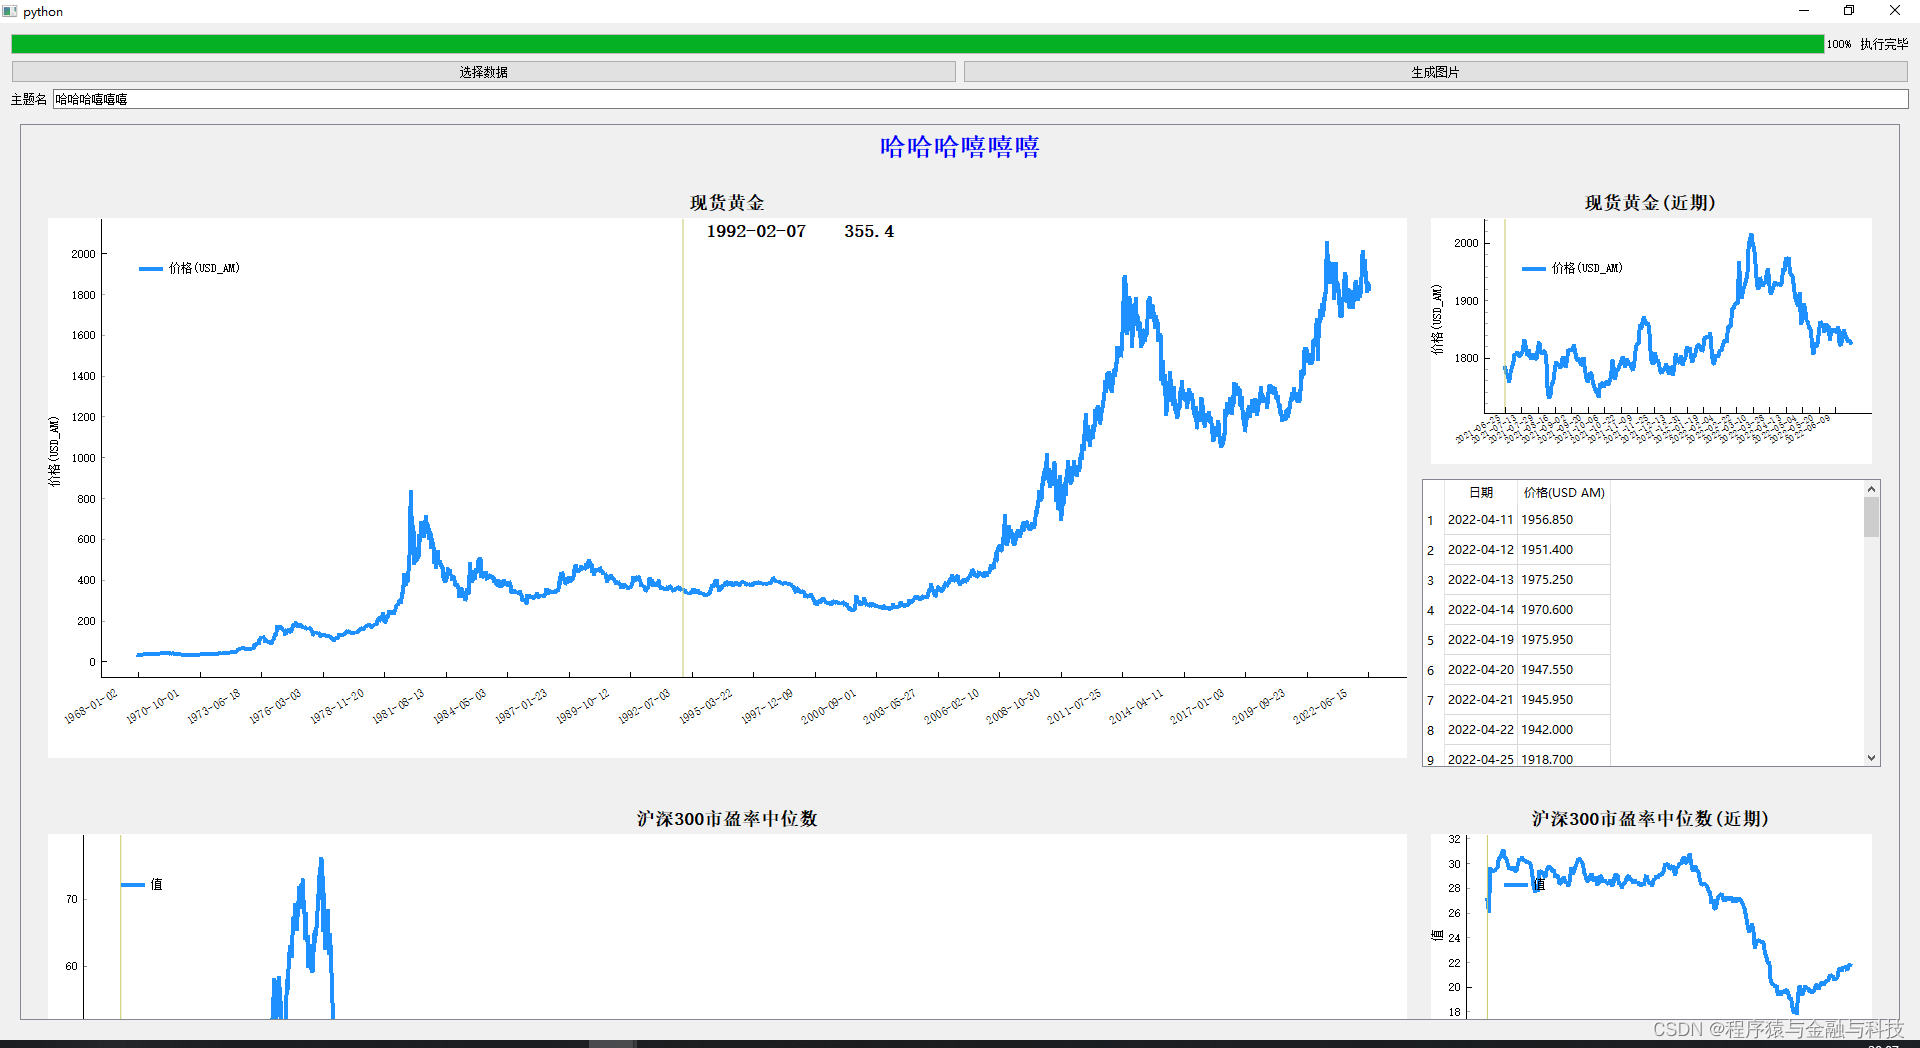
 Example 2

Code :
Example 1
import sys
from PyQt5 import QtCore, QtGui, QtWidgets

class ExampleWidget(QtWidgets.QWidget):
    def __init__(self):
        super().__init__()
        self.temp_save = 0
        self.temp_mark = 0
        self.init_data()
        self.init_ui()
        self.fill_pic_widget()

    def init_data(self):
        self.pic_file_name_list = ['000', '001', '002', '003', '004', '005', '006', '007', '008', '009', '010', '011',
                                   '012', '013', '014', '015', '016', '017']
        pass

    def init_ui(self):
        self.setWindowTitle('QScrollArea Internally generated image storage ')
        one_btn = QtWidgets.QPushButton(' Change the content ')
        one_btn.clicked.connect(self.one_btn_clicked)

        two_btn = QtWidgets.QPushButton('ScrollArea Internally generated image storage ')
        two_btn.clicked.connect(self.two_btn_clicked)

        self.pic_layout = QtWidgets.QGridLayout()

        self.scroll_area = QtWidgets.QScrollArea()
        # self.scroll_area.setWidgetResizable(True)
        self.scroll_area.setVerticalScrollBarPolicy(QtCore.Qt.ScrollBarAlwaysOff)

        layout = QtWidgets.QVBoxLayout()
        layout.addWidget(one_btn)
        layout.addWidget(two_btn)
        layout.addWidget(self.scroll_area)
        self.setLayout(layout)
        pass

    def one_btn_clicked(self):
        self.temp_mark = 1
        self.fill_pic_widget()
        pass
    def two_btn_clicked(self):
        self.temp_save += 1
        path,_ = QtWidgets.QFileDialog.getSaveFileName(
            self,
            ' Select the image storage path ',
            f"pic_{self.temp_save}",
            'JPG(*.jpg)'
        )
        if not path:
            return

        widget = self.scroll_area.widget()
        pix = widget.grab()
        pix.save(path)
        pass

    def fill_pic_widget(self):
        ''' Place pictures '''
        #  Clear control
        while self.pic_layout.count():
            item = self.pic_layout.takeAt(0)
            widget = item.widget()
            if widget is not None:
                widget.deleteLater()
                pass
            pass
        sc_child_widget = self.scroll_area.takeWidget()
        if sc_child_widget is not None:
            sc_child_widget.deleteLater()
        pre_dir = r'D:/temp010/'
        row_i = -2
        if self.temp_mark == 1:
            self.pic_file_name_list.reverse()
        for pic_index, file_name in enumerate(self.pic_file_name_list):
            one_check = QtWidgets.QCheckBox(file_name)
            pixmap = QtGui.QPixmap(pre_dir + file_name + '.jpeg')
            one_piclabel = QtWidgets.QLabel()
            one_piclabel.setPixmap(pixmap)
            one_piclabel.setScaledContents(True)

            col_i = pic_index % 4
            if col_i == 0:
                row_i += 2
            print(file_name, row_i, col_i)
            self.pic_layout.addWidget(one_check, row_i, col_i, 1, 1)
            self.pic_layout.addWidget(one_piclabel, row_i + 1, col_i, 1, 1)
            pass
        print('self.pic_layout,', self.pic_layout.count())
        one_sc_child_widget = QtWidgets.QWidget()
        one_sc_child_widget.setLayout(self.pic_layout)
        self.scroll_area.setWidget(one_sc_child_widget)
        pass
Example 2
import sys,math
import pandas as pd
from threading import Thread
from PyQt5 import QtCore,QtWidgets,QtGui
from PyQt5.QtCore import Qt
from typing import Any,Dict,List
import pyqtgraph as pg
pg.setConfigOption('background', 'w')
pg.setConfigOption('foreground', 'k')

class RotateAxisItem(pg.AxisItem):
    def drawPicture(self, p, axisSpec, tickSpecs, textSpecs):
        p.setRenderHint(p.Antialiasing,False)
        p.setRenderHint(p.TextAntialiasing,True)

        ## draw long line along axis
        pen,p1,p2 = axisSpec
        p.setPen(pen)
        p.drawLine(p1,p2)
        p.translate(0.5,0)  ## resolves some damn pixel ambiguity

        ## draw ticks
        for pen,p1,p2 in tickSpecs:
            p.setPen(pen)
            p.drawLine(p1,p2)

        ## draw all text
        # if self.tickFont is not None:
        #     p.setFont(self.tickFont)
        p.setPen(self.pen())
        for rect,flags,text in textSpecs:
            # this is the important part
            p.save()
            p.translate(rect.x(),rect.y())
            p.rotate(-30)
            p.drawText(-rect.width(),rect.height(),rect.width(),rect.height(),flags,text)
            # restoring the painter is *required*!!!
            p.restore()

class RotateAxisItemOneYear(pg.AxisItem):
    def drawPicture(self, p, axisSpec, tickSpecs, textSpecs):
        p.setRenderHint(p.Antialiasing,False)
        p.setRenderHint(p.TextAntialiasing,True)

        ## draw long line along axis
        pen,p1,p2 = axisSpec
        p.setPen(pen)
        p.drawLine(p1,p2)
        p.translate(0.5,-1)  ## resolves some damn pixel ambiguity
        # p.translate(1,0)  ## resolves some damn pixel ambiguity

        ## draw ticks
        for pen,p1,p2 in tickSpecs:
            p.setPen(pen)
            p.drawLine(p1,p2)

        ## draw all text
        # if self.tickFont is not None:
        #     p.setFont(self.tickFont)
        font = QtGui.QFont()
        font.setPixelSize(9)
        p.setFont(font)
        p.setPen(self.pen())
        for rect,flags,text in textSpecs:
            # this is the important part
            p.save()
            p.translate(rect.x(),rect.y())
            p.rotate(-30)
            p.drawText(-rect.width()*0.6,rect.height(),rect.width(),rect.height(),flags,text)
            # restoring the painter is *required*!!!
            p.restore()
RotateAxisItem: Custom abscissa
RotateAxisItemOneYear: Custom abscissa , comparison RotateAxisItem Compared with the small font size , In fact, these two can be merged into one , Let's explore by ourselves .
class PyQtGraphLineWidget(QtWidgets.QWidget):
def __init__(self):
super().__init__()
self.line_type: int = 1
self.fomc_p = None
self.temp_thread = None
self.init_data()
self.init_ui()
# self.register_event()
def init_data(self):
# Color value https://www.sioe.cn/yingyong/yanse-rgb-16/
self.color_one = (30,144,255)
self.color_two = (255,140,0)
self.p2 = None
self.legend2 = None
self.curve2 = None
pass
def init_ui(self):
self.title_label = QtWidgets.QLabel(' Broken line diagram ')
self.title_label.setAlignment(Qt.AlignCenter)
self.title_label.setStyleSheet('QLabel{font-size:18px;font-weight:bold;}')
xax = RotateAxisItem(orientation='bottom')
xax.setHeight(h=80)
self.pw = pg.PlotWidget(axisItems={'bottom': xax})
self.pw.setMouseEnabled(x=True,y=False)
# self.pw.enableAutoRange(x=False,y=True)
self.pw.setAutoVisible(x=False,y=True)
layout = QtWidgets.QVBoxLayout()
layout.addWidget(self.title_label)
layout.addWidget(self.pw)
self.setLayout(layout)
pass
def set_data(self, data: Dict[str, Any]):
''' Single root y Axis '''
self.line_type = 1
if data is None:
self.pw.clear()
return
if self.p2 is not None:
'''
If the previous display was double y Axis ,
【 For the time being self.pw It's called the main view ,self.p2 It's called the right side view 】
1. To hide the coordinate axis on the right side of the main view
2. Disconnect the signal following the change on the right side of the main view
3. The right side view will be (ViewBox) Delete
4. The right side view will be (ViewBox) Empty
5. Leave the right view empty
'''
self.pw.hideAxis('right')
self.vb.sigResized.disconnect(self.updateViews)
self.pw.scene().removeItem(self.p2)
self.p2.clear()
self.legend2.clear()
self.curve2.clear()
self.vb.clear()
self.p2 = None
self.legend2 = None
self.curve2 = None
# Empty the last view
self.pw.clear()
self.pw.addLegend()
title_str = data['title_str']
self.title_label.setText(title_str)
xTick = [data['xTick00']]
x = data['x']
y = data['y']
y_name = data['y_name']
self.pw.setLabel('left', y_name)
self.y_datas = y
self.x_data = xTick
self.x_Tick = data['xTick']
self.y_name = y_name
xax = self.pw.getAxis('bottom')
xax.setTicks(xTick)
self.pw.plot(x, y, connect='finite', pen=pg.mkPen({'color': self.color_one, 'width': 4}), name=self.y_name)
self.vLine = pg.InfiniteLine(angle=90, movable=False)
self.hLine = pg.InfiniteLine(angle=0, movable=False)
self.label = pg.TextItem()
self.pw.addItem(self.vLine, ignoreBounds=True)
self.pw.addItem(self.hLine, ignoreBounds=True)
self.pw.addItem(self.label, ignoreBounds=True)
self.vb = self.pw.getViewBox()
self.proxy = pg.SignalProxy(self.pw.scene().sigMouseMoved, rateLimit=60, slot=self.mouseMoved)
# Display the whole line chart
self.pw.enableAutoRange()
pass
def set_data_2y(self, data: Dict[str, Any]):
''' double y Axis '''
self.line_type = 2
if data is None:
self.pw.clear()
return
if self.p2 is not None:
self.pw.hideAxis('right')
self.vb.sigResized.disconnect(self.updateViews)
self.pw.scene().removeItem(self.p2)
self.p2.clear()
self.legend2.clear()
self.curve2.clear()
self.vb.clear()
self.p2 = None
self.legend2 = None
self.curve2 = None
if self.fomc_p:
self.pw.scene().removeItem(self.fomc_p)
self.pw.clear()
self.pw.addLegend()
title_str = data['title_str']
self.title_label.setText(title_str)
xTick = [data['xTick00']]
x = data['x']
y = data['y']
y_name = data['y_name']
self.pw.setLabel('left', y_name)
self.y_datas = y
self.x_data = xTick
self.x_Tick = data['xTick']
self.y_name = y_name
xax = self.pw.getAxis('bottom')
xax.setTicks(xTick)
self.pw.plot(x, y, connect='finite', pen=pg.mkPen({'color': self.color_one, 'width': 4}), name=self.y_name)
self.vLine = pg.InfiniteLine(angle=90, movable=False)
self.hLine = pg.InfiniteLine(angle=0, movable=False)
self.label = pg.TextItem()
self.pw.addItem(self.vLine, ignoreBounds=True)
self.pw.addItem(self.hLine, ignoreBounds=True)
self.pw.addItem(self.label, ignoreBounds=True)
# The second one y Axis start
y2 = data['y2']
y_name2 = data['y_name2']
self.y_datas2 = y2
self.pw.setLabel('right', y_name2)
self.p2 = pg.ViewBox()
self.p2.setMouseEnabled(x=True, y=False)
self.p2.setAutoVisible(x=False, y=True)
self.pw.scene().addItem(self.p2)
self.pw.getAxis('right').linkToView(self.p2)
self.p2.setXLink(self.pw)
self.curve2 = pg.PlotCurveItem(x=x,y=y2, pen=pg.mkPen({'color': self.color_two, 'width': 4}), connect='finite')
self.p2.addItem(self.curve2)
self.legend2 = pg.LegendItem(offset=(0., 1.))
self.legend2.setParentItem(self.p2)
power = pg.PlotDataItem(antialias=True, pen=pg.mkPen({'color': self.color_two, 'width': 4}))
self.legend2.addItem(power, y_name2)
# The second one y Axis end
self.vb = self.pw.getViewBox()
self.updateViews()
self.vb.sigResized.connect(self.updateViews)
self.proxy = pg.SignalProxy(self.pw.scene().sigMouseMoved, rateLimit=60, slot=self.mouseMoved)
self.pw.enableAutoRange()
pass
def updateViews(self):
if self.p2:
self.p2.setGeometry(self.pw.getViewBox().sceneBoundingRect())
self.p2.linkedViewChanged(self.pw.getViewBox(), self.p2.XAxis)
if self.fomc_p:
self.fomc_p.setGeometry(self.pw.getViewBox().sceneBoundingRect())
self.fomc_p.linkedViewChanged(self.pw.getViewBox(), self.fomc_p.XAxis)
pass
def mouseMoved(self,evt):
pos = evt[0]
if self.pw.sceneBoundingRect().contains(pos):
mousePoint = self.vb.mapSceneToView(pos)
index = int(mousePoint.x())
if index >= 0 and index < len(self.y_datas):
x_str = self.x_Tick[index][1]
y_str_html = ''
if self.line_type == 2:
y_str2 = str(self.y_datas2[index])
y_str_html += ' '+y_str2
y_str = str(self.y_datas[index])
y_str_html += ' ' + y_str
html_str = '<p style="color:black;font-size:18px;font-weight:bold;"> ' + x_str +' '+y_str_html+ '</p>'
self.label.setHtml(html_str)
self.label.setPos(mousePoint.x(), mousePoint.y())
self.vLine.setPos(mousePoint.x())
self.hLine.setPos(mousePoint.y())
pass
class PyQtGraphLineOneYearWidget(QtWidgets.QWidget):
def __init__(self):
super().__init__()
self.line_type: int = 1
self.fomc_p = None
self.temp_thread = None
self.init_data()
self.init_ui()
# self.register_event()
def init_data(self):
# Color value https://www.sioe.cn/yingyong/yanse-rgb-16/
self.color_one = (30,144,255)
self.color_two = (255,140,0)
self.p2 = None
self.legend2 = None
self.curve2 = None
pass
def init_ui(self):
self.title_label = QtWidgets.QLabel(' Broken line diagram ')
self.title_label.setAlignment(Qt.AlignCenter)
self.title_label.setStyleSheet('QLabel{font-size:18px;font-weight:bold;}')
xax = RotateAxisItemOneYear(orientation='bottom')
xax.setHeight(h=50)
self.pw = pg.PlotWidget(axisItems={'bottom': xax})
self.pw.setMouseEnabled(x=True,y=False)
# self.pw.enableAutoRange(x=False,y=True)
self.pw.setAutoVisible(x=False,y=True)
layout = QtWidgets.QVBoxLayout()
layout.addWidget(self.title_label)
layout.addWidget(self.pw)
self.setLayout(layout)
pass
def set_data(self, data: Dict[str, Any]):
''' Single root y Axis '''
self.line_type = 1
if data is None:
self.pw.clear()
return
if self.p2 is not None:
'''
If the previous display was double y Axis ,
【 For the time being self.pw It's called the main view ,self.p2 It's called the right side view 】
1. To hide the coordinate axis on the right side of the main view
2. Disconnect the signal following the change on the right side of the main view
3. The right side view will be (ViewBox) Delete
4. The right side view will be (ViewBox) Empty
5. Leave the right view empty
'''
self.pw.hideAxis('right')
self.vb.sigResized.disconnect(self.updateViews)
self.pw.scene().removeItem(self.p2)
self.p2.clear()
self.legend2.clear()
self.curve2.clear()
self.vb.clear()
self.p2 = None
self.legend2 = None
self.curve2 = None
# Empty the last view
self.pw.clear()
self.pw.addLegend()
title_str = data['title_str']
self.title_label.setText(title_str)
xTick = [data['xTick00']]
x = data['x']
y = data['y']
y_name = data['y_name']
self.pw.setLabel('left', y_name)
self.y_datas = y
self.x_data = xTick
self.x_Tick = data['xTick']
self.y_name = y_name
xax = self.pw.getAxis('bottom')
xax.setTicks(xTick)
self.pw.plot(x, y, connect='finite', pen=pg.mkPen({'color': self.color_one, 'width': 4}), name=self.y_name)
self.vLine = pg.InfiniteLine(angle=90, movable=False)
self.hLine = pg.InfiniteLine(angle=0, movable=False)
self.label = pg.TextItem()
self.pw.addItem(self.vLine, ignoreBounds=True)
self.pw.addItem(self.hLine, ignoreBounds=True)
self.pw.addItem(self.label, ignoreBounds=True)
self.vb = self.pw.getViewBox()
self.proxy = pg.SignalProxy(self.pw.scene().sigMouseMoved, rateLimit=60, slot=self.mouseMoved)
# Display the whole line chart
self.pw.enableAutoRange()
pass
def set_data_2y(self, data: Dict[str, Any]):
''' double y Axis '''
self.line_type = 2
if data is None:
self.pw.clear()
return
if self.p2 is not None:
self.pw.hideAxis('right')
self.vb.sigResized.disconnect(self.updateViews)
self.pw.scene().removeItem(self.p2)
self.p2.clear()
self.legend2.clear()
self.curve2.clear()
self.vb.clear()
self.p2 = None
self.legend2 = None
self.curve2 = None
if self.fomc_p:
self.pw.scene().removeItem(self.fomc_p)
self.pw.clear()
self.pw.addLegend()
title_str = data['title_str']
self.title_label.setText(title_str)
xTick = [data['xTick00']]
x = data['x']
y = data['y']
y_name = data['y_name']
self.pw.setLabel('left', y_name)
self.y_datas = y
self.x_data = xTick
self.x_Tick = data['xTick']
self.y_name = y_name
xax = self.pw.getAxis('bottom')
xax.setTicks(xTick)
self.pw.plot(x, y, connect='finite', pen=pg.mkPen({'color': self.color_one, 'width': 4}), name=self.y_name)
self.vLine = pg.InfiniteLine(angle=90, movable=False)
self.hLine = pg.InfiniteLine(angle=0, movable=False)
self.label = pg.TextItem()
self.pw.addItem(self.vLine, ignoreBounds=True)
self.pw.addItem(self.hLine, ignoreBounds=True)
self.pw.addItem(self.label, ignoreBounds=True)
# The second one y Axis start
y2 = data['y2']
y_name2 = data['y_name2']
self.y_datas2 = y2
self.pw.setLabel('right', y_name2)
self.p2 = pg.ViewBox()
self.p2.setMouseEnabled(x=True, y=False)
self.p2.setAutoVisible(x=False, y=True)
self.pw.scene().addItem(self.p2)
self.pw.getAxis('right').linkToView(self.p2)
self.p2.setXLink(self.pw)
self.curve2 = pg.PlotCurveItem(x=x,y=y2, pen=pg.mkPen({'color': self.color_two, 'width': 4}), connect='finite')
self.p2.addItem(self.curve2)
self.legend2 = pg.LegendItem(offset=(0., 1.))
self.legend2.setParentItem(self.p2)
power = pg.PlotDataItem(antialias=True, pen=pg.mkPen({'color': self.color_two, 'width': 4}))
self.legend2.addItem(power, y_name2)
# The second one y Axis end
self.vb = self.pw.getViewBox()
self.updateViews()
self.vb.sigResized.connect(self.updateViews)
self.proxy = pg.SignalProxy(self.pw.scene().sigMouseMoved, rateLimit=60, slot=self.mouseMoved)
self.pw.enableAutoRange()
pass
def updateViews(self):
if self.p2:
self.p2.setGeometry(self.pw.getViewBox().sceneBoundingRect())
self.p2.linkedViewChanged(self.pw.getViewBox(), self.p2.XAxis)
if self.fomc_p:
self.fomc_p.setGeometry(self.pw.getViewBox().sceneBoundingRect())
self.fomc_p.linkedViewChanged(self.pw.getViewBox(), self.fomc_p.XAxis)
pass
def mouseMoved(self,evt):
pos = evt[0]
if self.pw.sceneBoundingRect().contains(pos):
mousePoint = self.vb.mapSceneToView(pos)
index = int(mousePoint.x())
if index >= 0 and index < len(self.y_datas):
x_str = self.x_Tick[index][1]
y_str_html = ''
if self.line_type == 2:
y_str2 = str(self.y_datas2[index])
y_str_html += ' '+y_str2
y_str = str(self.y_datas[index])
y_str_html += ' ' + y_str
html_str = '<p style="color:black;font-size:18px;font-weight:bold;"> ' + x_str +' '+y_str_html+ '</p>'
self.label.setHtml(html_str)
self.label.setPos(mousePoint.x(), mousePoint.y())
self.vLine.setPos(mousePoint.x())
self.hLine.setPos(mousePoint.y())
pass
PyQtGraphLineWidget and PyQtGraphLineOneYearWidget It can also be merged into one , I'm just lazy , If you are interested, you can explore by yourself , These two controls are used to display polylines
class ChildLineWidget(QtWidgets.QWidget):
    def __init__(self):
        super().__init__()
        self.init_data()
        self.init_ui()
        pass
    def init_data(self):
        pass
    def init_ui(self):
        self.setMinimumHeight(600)
        self.left_line_widget = PyQtGraphLineWidget()
        self.righttop_line_widget = PyQtGraphLineOneYearWidget()
        self.rightdown_table_widget = QtWidgets.QTableWidget()

        layout_right = QtWidgets.QVBoxLayout()
        layout_right.addWidget(self.righttop_line_widget,1)
        layout_right.addWidget(self.rightdown_table_widget,1)

        layout = QtWidgets.QHBoxLayout()
        layout.addWidget(self.left_line_widget,3)
        layout.addLayout(layout_right,1)
        self.setLayout(layout)
        pass
    def set_data(self,data:Dict[str,Any]):
        line_data = data['line_data']
        table_data = data['table_data']

        self.setting_line_data(line_data)
        self.setting_table_data(table_data)
        pass
    def setting_line_data(self,data:Dict[str,Any]):
        line_type = data['line_type']
        whole_line = data['whole_line']
        one_year_line = data['one_year_line']
        if line_type == 2:
            self.left_line_widget.set_data_2y(whole_line)
            self.righttop_line_widget.set_data_2y(one_year_line)
        else:
            self.left_line_widget.set_data(whole_line)
            self.righttop_line_widget.set_data(one_year_line)
        pass
    def setting_table_data(self,data:Dict[str,Any]):
        table_header = data['table_header']
        table_body = data['table_body']
        self.rightdown_table_widget.clearContents()
        self.rightdown_table_widget.setColumnCount(len(table_header))
        self.rightdown_table_widget.setHorizontalHeaderLabels(table_header)
        self.rightdown_table_widget.setRowCount(len(table_body))

        for r_i,r_v in enumerate(table_body):
            for c_i,c_v in enumerate(r_v):
                cell = QtWidgets.QTableWidgetItem(str(c_v))
                self.rightdown_table_widget.setItem(r_i,c_i,cell)
                pass
        self.rightdown_table_widget.resizeColumnsToContents()
        pass
    pass
ChildLineWidget: A complete display control of data in the scroll area , Full data line chart showing data , Recent data discount chart and latest 50 A data list
class MultiChildLineWidget(QtWidgets.QWidget):
    def __init__(self):
        super().__init__()
        self.init_data()
        self.init_ui()
        pass
    def init_data(self):
        self.title_str: str = ' topic name '
        self.child_line_data_list: List[Any] = []
        pass
    def init_ui(self):
        self.layout_child = QtWidgets.QVBoxLayout()

        self.scroll_area = QtWidgets.QScrollArea()
        self.scroll_area.setWidgetResizable(True)
        self.scroll_area.setVerticalScrollBarPolicy(QtCore.Qt.ScrollBarAlwaysOff)

        layout = QtWidgets.QVBoxLayout()
        layout.addWidget(self.scroll_area)
        self.setLayout(layout)
        pass
    def set_data(self,data:Dict[str,Any]):
        title_str = data['title']
        self.child_line_data_list = data['line_data_list']

        self.title_str = title_str
        self.fill_child_line_widget()
        pass
    def fill_child_line_widget(self):
        #  Clear control
        while self.layout_child.count():
            item = self.layout_child.takeAt(0)
            widget = item.widget()
            if widget is not None:
                widget.deleteLater()
                pass
            pass
        sc_child_widget = self.scroll_area.takeWidget()
        if sc_child_widget is not None:
            sc_child_widget.deleteLater()

        title_label = QtWidgets.QLabel(self.title_str)
        title_label.setAlignment(Qt.AlignCenter)
        title_label.setStyleSheet('QLabel{font-size:26px;font-weight:bold;color:blue}')

        self.layout_child.addWidget(title_label)
        self.layout_child.addSpacing(10)
        for one_item in self.child_line_data_list:
            one_widget = ChildLineWidget()
            one_widget.set_data(one_item)
            self.layout_child.addWidget(one_widget)
            self.layout_child.addSpacing(10)
            pass

        one_sc_child_widget = QtWidgets.QWidget()
        one_sc_child_widget.setLayout(self.layout_child)
        self.scroll_area.setWidget(one_sc_child_widget)
        pass
    def res_scroll_widget(self):
        return self.scroll_area.widget()
    pass
MultiChildLineWidget: Place multiple minimum data unit controls ChildLineWidget The container of
class ExampleScrollLineWidget(QtWidgets.QWidget):
    close_signal = QtCore.pyqtSignal(str)
    signal_themeline = QtCore.pyqtSignal(object)
    def __init__(self):
        super().__init__()
        self.caculate_thread = None

        self.init_data()
        self.init_ui()
        self.register_event()
        pass
    def init_data(self):
        self.pre_catalog_list:List[Any] = []
        self.pre_data_list:List[Any] = []

        self.pic_count:int = 0
        self.catalog_code_list: List[str] = ['economic_usanationdebt10y','economic_goldspotprice','economic_medianpehs300','economic_pigprice','economic_usdebt10sub1','economic_chinadebt10sub1']
        self.period_year_map: Dict[str,int] = {
            ' Daily data ':252,
            ' Weekly data ':52,
            ' Monthly data ':12,
            ' Quarterly data ':8,
            ' Annual data ':5
        }
        self.table_count: int = 50
        self.x_count: int = 20
        pass
    def init_ui(self):
        self.caculate_progress = QtWidgets.QProgressBar()
        self.caculate_status_label = QtWidgets.QLabel()
        layout_progress = QtWidgets.QHBoxLayout()
        layout_progress.addWidget(self.caculate_progress)
        layout_progress.addWidget(self.caculate_status_label)

        choise_btn = QtWidgets.QPushButton(' Select data ')
        choise_btn.clicked.connect(self.choise_btn_clicked)
        create_pic_btn = QtWidgets.QPushButton(' Generate pictures ')
        create_pic_btn.clicked.connect(self.create_pic_btn_clicked)
        tip_label = QtWidgets.QLabel(' topic name ')
        self.theme_lineedit = QtWidgets.QLineEdit()

        layout_btn = QtWidgets.QHBoxLayout()
        layout_btn.addWidget(choise_btn)
        layout_btn.addWidget(create_pic_btn)

        layout_input = QtWidgets.QHBoxLayout()
        layout_input.addWidget(tip_label)
        layout_input.addWidget(self.theme_lineedit)

        self.muliti_widget = MultiChildLineWidget()

        layout = QtWidgets.QVBoxLayout()
        layout.addLayout(layout_progress)
        layout.addLayout(layout_btn)
        layout.addLayout(layout_input)
        layout.addWidget(self.muliti_widget)
        self.setLayout(layout)
        pass
    def register_event(self):
        self.signal_themeline.connect(self.process_themeline_event)
        pass
    def process_themeline_event(self,data:Dict[str,Any])->None:
        change_type = data['change_type']
        if change_type == 'caculate_result':
            res_data = data['data']
            title_str = self.theme_lineedit.text()
            print(title_str)
            title_str = title_str.strip()
            if len(title_str)<=0:
                title_str = ' The theme '
            pre_show_data = {
                'title':title_str,
                'line_data_list':res_data
            }
            self.muliti_widget.set_data(pre_show_data)

            self.progress_finished()
            self.caculate_thread = None
        pass

    def setting_data(self,data:Dict[str,Any]):
        self.pre_catalog_list = data['catalog']
        self.pre_data_list = data['data']
        pass

    def choise_btn_clicked(self):
        ''' Select the data button and click '''
        self.start_caculate_thread('caculate',None)
        pass
    def create_pic_btn_clicked(self):
        ''' Click the generate picture button '''
        self.pic_count += 1
        path, _ = QtWidgets.QFileDialog.getSaveFileName(
            self,
            ' Select the image storage path ',
            f"pic_{self.pic_count}",
            'JPG(*.jpg)'
        )
        if not path:
            return

        widget = self.muliti_widget.res_scroll_widget()
        pix = widget.grab()
        pix.save(path)
        pass

    def init_caculate_thread(self):
        self.progress_init()
        # self.start_caculate_thread('init', None)
        pass

    def start_caculate_thread(self, mark_str: str, data: Dict[str, Any]):
        if self.caculate_thread:
            QtWidgets.QMessageBox.information(
                self,
                ' Tips ',
                ' There are tasks being performed ',
                QtWidgets.QMessageBox.Yes
            )
            return
        self.caculate_thread = Thread(
            target=self.running_caculate_thread,
            args=(
                mark_str,
                data,
            )
        )
        self.caculate_thread.start()
        self.progress_busy()
        pass

    def running_caculate_thread(self, mark_str: str, data: Dict[str, Any]):
        if mark_str == 'caculate':
            catalog_list = self.pre_catalog_list
            data_list = self.pre_data_list
            #  Start processing data
            catalog_map = {}
            for item in catalog_list:
                catalog_code = item['economic_code']
                level = item['level']
                if level == 2:
                    catalog_name = f"{item['economic_name']}【{item['economic_source']}】"
                else:
                    catalog_name = item['economic_name']
                catalog_lineshow = item['economic_lineshow']
                if catalog_lineshow.get('y2') is not None:
                    line_type = 2
                else:
                    line_type = 1
                catalog_period = item['economic_period']
                if self.period_year_map.get(catalog_period) is None:
                    last_one_year_count = 10
                else:
                    last_one_year_count = self.period_year_map[catalog_period]
                catalog_map[catalog_code] = {
                    'catalog_name':catalog_name,
                    'catalog_lineshow':catalog_lineshow,
                    'line_type':line_type,
                    'catalog_period':catalog_period,
                    'last_one_year_count':last_one_year_count
                }

            res_show_list = []
            for item in data_list:
                catalog_code = item['catalog_code']
                catalog_obj = catalog_map[catalog_code]
                last_one_year_count = catalog_obj['last_one_year_count']
                catalog_name = catalog_obj['catalog_name']
                catalog_lineshow = catalog_obj['catalog_lineshow']
                line_type = catalog_obj['line_type']

                column_list = item['column_list']
                pd_column_list = item['pd_column_list']
                item_data_list = item['data_list']

                df = pd.DataFrame(columns=pd_column_list,data=item_data_list)
                df_one_year = df.iloc[-1*last_one_year_count:, :].copy()
                df_table = df.iloc[-1*self.table_count:,:].copy()

                if line_type == 2:
                    #  double Y Axis
                    whole_line_data = self.res_twoY_line_data(df,catalog_lineshow)
                    one_year_line_data = self.res_twoY_line_data(df_one_year,catalog_lineshow)
                    pass
                else:
                    #  A curve
                    whole_line_data = self.res_one_line_data(df,catalog_lineshow)
                    one_year_line_data = self.res_one_line_data(df_one_year,catalog_lineshow)
                    pass

                whole_line_data['title_str'] = catalog_name
                one_year_line_data['title_str'] = f"{catalog_name}( In the near future )"

                one_line = {
                    'line_type':line_type,
                    'whole_line':whole_line_data,
                    'one_year_line':one_year_line_data
                }

                #  Tabular data
                one_table = {
                    'table_header':column_list,
                    'table_body':df_table.values.tolist()
                }

                res_show_list.append({
                    'line_data':one_line,
                    'table_data':one_table
                })
                pass

            res_json = {}
            res_json['change_type'] = 'caculate_result'
            res_json['data'] = res_show_list

            self.signal_themeline.emit(res_json)
            pass
        pass
    def res_one_line_data(self,df:pd.DataFrame,catalog_lineshow:Dict[str,Any])->Dict[str,Any]:
        whole_line_data = {}

        df['count'] = range(len(df))
        df[catalog_lineshow['y1']] = df[catalog_lineshow['y1']].astype('float')
        x = df['count'].values.tolist()
        y = df[catalog_lineshow['y1']].values.tolist()
        xnames = df[catalog_lineshow['x']].values.tolist()
        xTicks = [(one_i, two_i) for one_i, two_i in zip(x, xnames)]
        xTicks00 = []
        if len(xTicks) > self.x_count:
            dur_count = math.floor(len(xTicks) / self.x_count)
            for i in range(0, len(xTicks), dur_count):
                xTicks00.append(xTicks[i])
        else:
            xTicks00 = xTicks
        y_name = catalog_lineshow['ylabel']

        whole_line_data['x'] = x
        whole_line_data['y'] = y
        whole_line_data['xTick00'] = xTicks00
        whole_line_data['y_name'] = y_name
        whole_line_data['xTick'] = xTicks
        return whole_line_data

    def res_twoY_line_data(self, df: pd.DataFrame, catalog_lineshow: Dict[str, Any]) -> Dict[str, Any]:
        whole_line_data = {}

        df['count'] = range(len(df))
        df[catalog_lineshow['y1']] = df[catalog_lineshow['y1']].astype('float')
        df[catalog_lineshow['y2']] = df[catalog_lineshow['y2']].astype('float')
        x = df['count'].values.tolist()
        y = df[catalog_lineshow['y1']].values.tolist()
        y2 = df[catalog_lineshow['y2']].values.tolist()
        xnames = df[catalog_lineshow['x']].values.tolist()
        xTicks = [(one_i, two_i) for one_i, two_i in zip(x, xnames)]
        xTicks00 = []
        if len(xTicks) > self.x_count:
            dur_count = math.floor(len(xTicks) / self.x_count)
            for i in range(0, len(xTicks), dur_count):
                xTicks00.append(xTicks[i])
        else:
            xTicks00 = xTicks
        y_name = catalog_lineshow['ylabel']
        y_name2 = catalog_lineshow['ylabel2']

        whole_line_data['x'] = x
        whole_line_data['y'] = y
        whole_line_data['y2'] = y2
        whole_line_data['xTick00'] = xTicks00
        whole_line_data['y_name'] = y_name
        whole_line_data['y_name2'] = y_name2
        whole_line_data['xTick'] = xTicks
        return whole_line_data

    def progress_init(self)->None:
        self.caculate_progress.setValue(0)
        self.caculate_status_label.setText(' No task ')
    def progress_busy(self)->None:
        self.caculate_progress.setRange(0,0)
        self.caculate_status_label.setText(' Being implemented ')
    def progress_finished(self)->None:
        self.caculate_progress.setRange(0,100)
        self.caculate_progress.setValue(100)
        self.caculate_status_label.setText(' completion of enforcement ')
    def closeEvent(self, QCloseEvent):
        # self.close_signal.emit('ThemeLineWidget')
        self.close()
        pass
    pass
Use
Example 1
if __name__ == '__main__':
    app = QtWidgets.QApplication(sys.argv)
    t_win = ExampleWidget()
    t_win.showMaximized()
    sys.exit(app.exec_())
    pass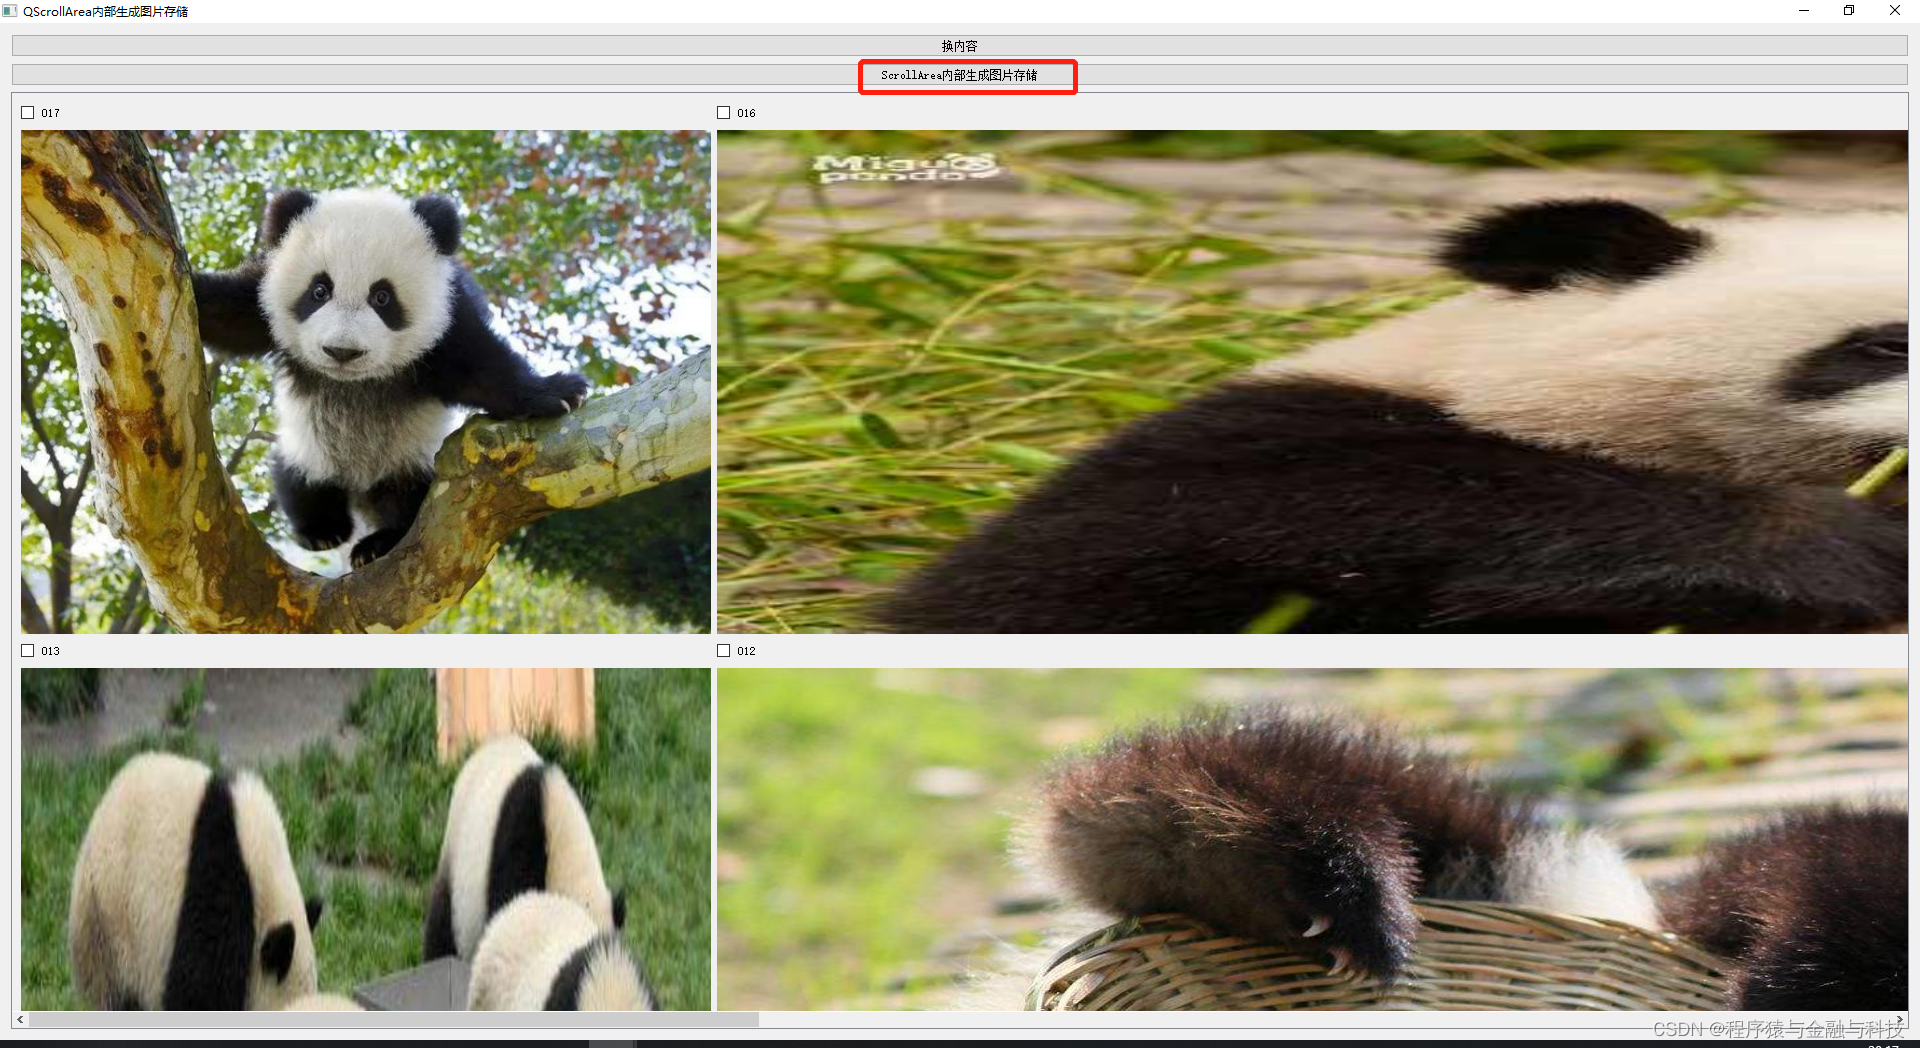
Click on “ScrollArea Content generation image storage ” Button
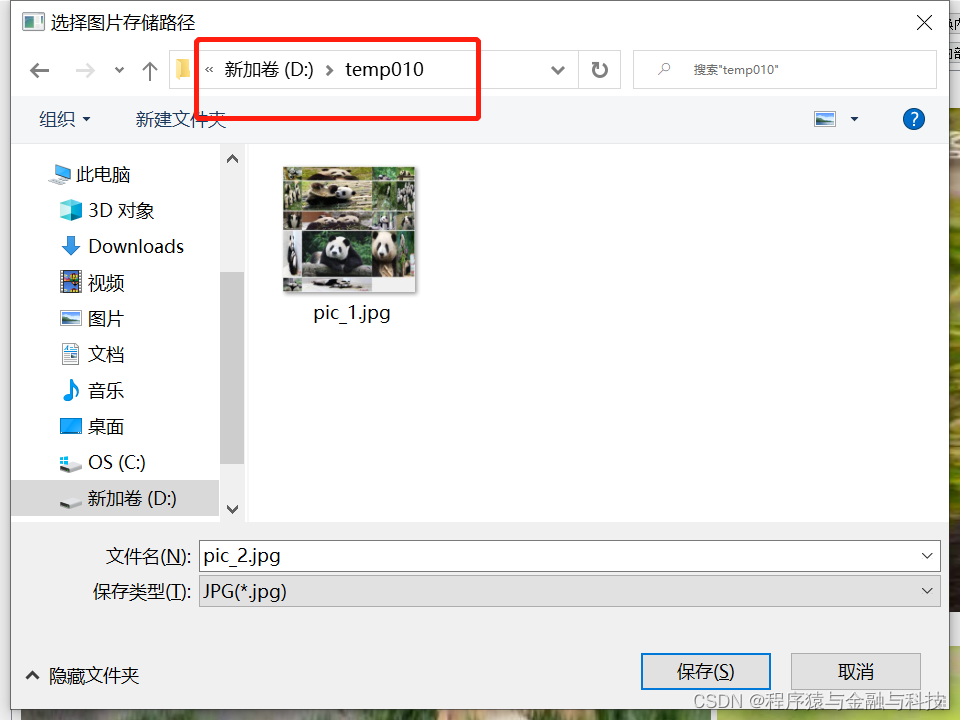
Select the directory to store , Click save , You can see the corresponding pictures in the corresponding directory


Example 2
if __name__ == '__main__':
    QtCore.QCoreApplication.setAttribute(QtCore.Qt.HighDpiScaleFactorRoundingPolicy.PassThrough)
    app = QtWidgets.QApplication(sys.argv)

    import json
    pre_dir = r'D:/temp006/'
    with open(pre_dir+'catalog_list.json','r',encoding='utf-8') as fr:
        catalog_list = json.load(fr)
    with open(pre_dir+'data_list.json','r',encoding='utf-8') as fr:
        data_list = json.load(fr)
    pre_data = {
        'catalog':catalog_list,
        'data':data_list
    }
    t_win = ExampleScrollLineWidget()
    t_win.showMaximized()
    t_win.setting_data(pre_data)
    sys.exit(app.exec_())
    pass

Click on “ Generate pictures ” Button

Select the directory to save , single click “ preservation ”, You can see pictures in the corresponding directory


data
The data used in this article :
link :https://pan.baidu.com/s/1NumTfqscqDAXLN0V_pHNRw
Extraction code :b5oh
边栏推荐
- 联合搜索:搜索中的所有需求
- Go operation redis
- MySQL 45 lecture - learning from the actual battle of geek time MySQL 45 Lecture Notes - 04 | easy to understand index (Part 1)
- 数据湖(十一):Iceberg表数据组织与查询
- qt中uic的使用
- BeanUtils--浅拷贝--实例/原理
- Custom events, global event bus, message subscription and publishing, $nexttick
- Multi rotor aircraft control using PID and LQR controllers
- Launcher startup process
- (POJ - 1984) navigation nightare (weighted and search set)
猜你喜欢
Launcher startup process
【文档树、设置】字体变小
MySQL45讲——学习极客时间MySQL实战45讲笔记—— 05 | 深入浅出索引(下)

你的 Sleep 服务会梦到服务网格外的 bookinfo 吗
Just 1000 fans, record it
Skillfully use SSH to get through the Internet restrictions

The conference on the growth of all things was held in Hangzhou, and dangbei was selected into the top 100 list of future unicorns in China in 2022
![[deep learning] simple implementation of neural network forward propagation](/img/a6/9b4896c62e9b77f9d528c3c9efc58f.jpg)
[deep learning] simple implementation of neural network forward propagation

大家信夫一站式信用平台让信用场景“用起来
![[to be continued] [UE4 notes] l5ue4 model import](/img/6b/d3083afc969043dbef1aeb4fccfc99.jpg)
[to be continued] [UE4 notes] l5ue4 model import

随机推荐
selenium 在pycharm中安装selenium
Essential elements of science fiction 3D scenes - City
Golang 快速生成数据库表的 model 和 queryset
当贝投影4K激光投影X3 Pro获得一致好评:万元投影仪首选
Whole house Wi Fi: a pain point that no one can solve?
Dingtalk send message
Subcontracting configuration of uniapp applet subpackages
Qt-制作一个简单的计算器-实现四则运算-将结果以对话框的形式弹出来
代码实现MNLM
Quarkus learning IV - project development to deployment
软件测试的方法
Find love for speed in F1 delta time Grand Prix
Qt入门-制作一个简易的计算器
错误:EACCES:权限被拒绝,访问“/usr/lib/node_modules”
[deep learning] simple implementation of neural network forward propagation
Codeforces Round #803 (Div. 2)(A~D)
Thymeleaf dependency
BeanUtils--浅拷贝--实例/原理
Browser driven Download
Multi rotor aircraft control using PID and LQR controllers