当前位置:网站首页>Google Earth engine (GEE) - line chart of time series image combining VCI index and TCI temperature (Guatemala and El Salvador as examples)
Google Earth engine (GEE) - line chart of time series image combining VCI index and TCI temperature (Guatemala and El Salvador as examples)
2022-06-22 01:52:00 【The star light blog in 2021 cloud computing top3】
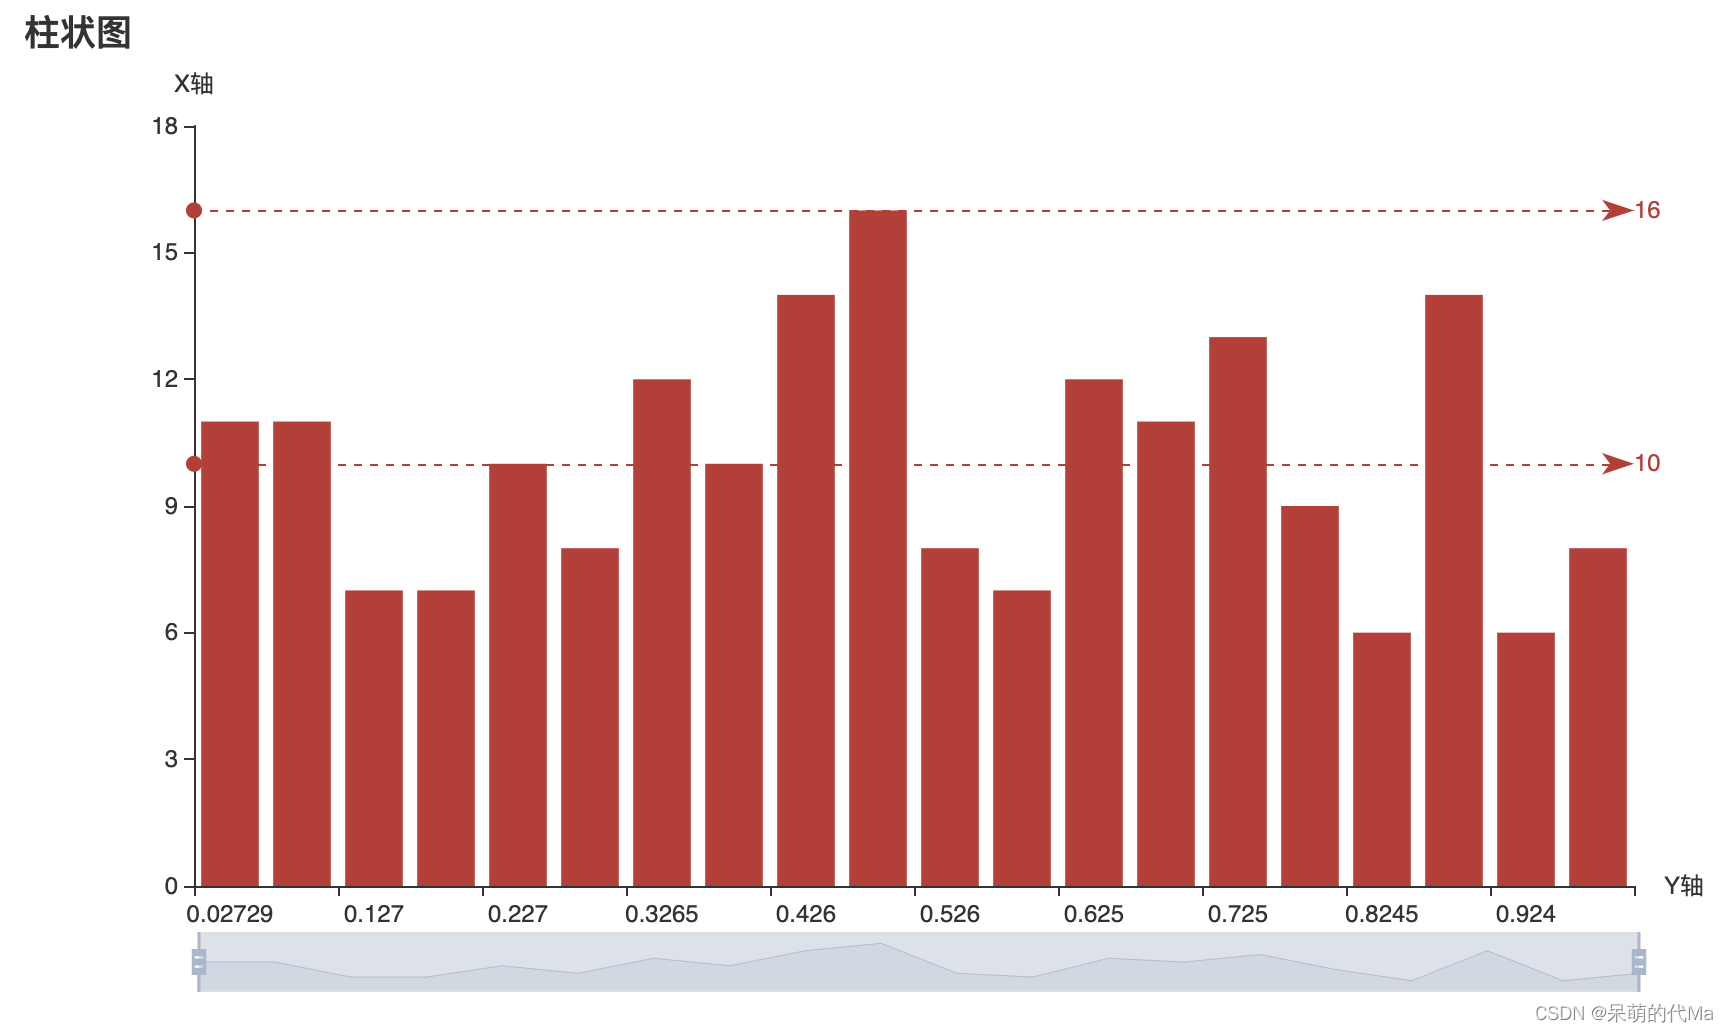
This experiment is applicable MODIS image MODIS/006/MOD13Q1 and MODIS/006/MOD11A2 Analyze the images and select NDVI Band and LST Band for time series analysis , Respectively check first NDVI The maximum and minimum values are normalized , And then calculate VCI, And then through LST Same calculation TCI, Then show the two separately :
Code :
//Add MODIS Vegetation Indices 16-Day Global 250m

var Coll_NDVI = ee.ImageCollection("MODIS/006/MOD13Q1")//MODIS/006/MOD13A1
var Coll_LST = ee.ImageCollection("MODIS/006/MOD11A2")//MODIS/006/MOD11A1

var startYear = 2010;
var endYear = 2022;

var startDate = ee.Date.fromYMD(startYear, 1, 1);
var endDate = ee.Date.fromYMD(endYear, 12, 31);

Coll_NDVI = Coll_NDVI.filterDate(startDate, endDate).select("NDVI");
Coll_NDVI = ee.ImageCollection(ee.Algorithms.If(Coll_NDVI.size().eq(0),
      ee.ImageCollection(ee.Image(0).selfMask().rename('NDVI')),
      Coll_NDVI
    ));
Coll_LST = Coll_LST.filterDate(startDate, endDate).select("LST_Day_1km");
Coll_LST = ee.ImageCollection边栏推荐
猜你喜欢

Redis缓存异常及处理方案总结
Divide the list into boxes and draw a histogram through pyechart
Redis cache exceptions and handling scheme summary

技术探秘: 360数科夺得ICDAR OCR竞赛世界第一

【数论】leetcode1010. Pairs of Songs With Total Durations Divisible by 60

Scuba China trip - Suzhou station, online and offline limited time registration channel has been opened!
测试用例设计方法——因果图法
![[solution] Ming Chu Liang Zao video edge computing gateway solution](/img/67/20a9ece2dc7d3a842aff1fc651e4fc.png)
[solution] Ming Chu Liang Zao video edge computing gateway solution

GAMES-101-个人总结归纳-Transformation

第六届世界智能大会“云”端召开在即
随机推荐
acwing 835. Trie string statistics
NOIP 提高组 初赛 三、问题求解 习题集NOIP1995-NOIP2018
acwing 837. 连通块中点的数量 (并查集维护额外信息---集合数量)
联发科技 --联发科技简介++附上笔经面经
2021 csp-j1 csp-s1 first round preliminary round related questions and videos
功能测试——MySQL数据库简介
Fabric.js IText 手动设置斜体
GAMES-101-个人总结归纳-Shading
音视频学习路线及学习资料推荐
High score schemes have been opened to the public, and the second round of the China "software Cup" remote sensing competition is coming!
【第 04 章 基于Hough变化的答题卡识别】
Cache consistency of arm
BSV上的委托合约(3)
BSV上的委托合约(2)
【数论】leetcode1010. Pairs of Songs With Total Durations Divisible by 60
【第 26 章 基于最小误差法和区域生长的医学影响分割系统--matlab深度学习实战GUI项目】
啊哈C语言 第5章 好戏在后面(第24-25讲)
英特尔发展史概述
GAMES-101-个人总结归纳-Transformation
抓包工具:Fiddler,软件测试工程师必备技能