当前位置:网站首页>Logistic Regression --- Introduction, API Introduction, Case: Cancer Classification Prediction, Classification Evaluation, and ROC Curve and AUC Metrics
Logistic Regression --- Introduction, API Introduction, Case: Cancer Classification Prediction, Classification Evaluation, and ROC Curve and AUC Metrics
2022-08-04 06:04:00 【I'm fine please go away thank you】
一、介绍
1. 大白话~
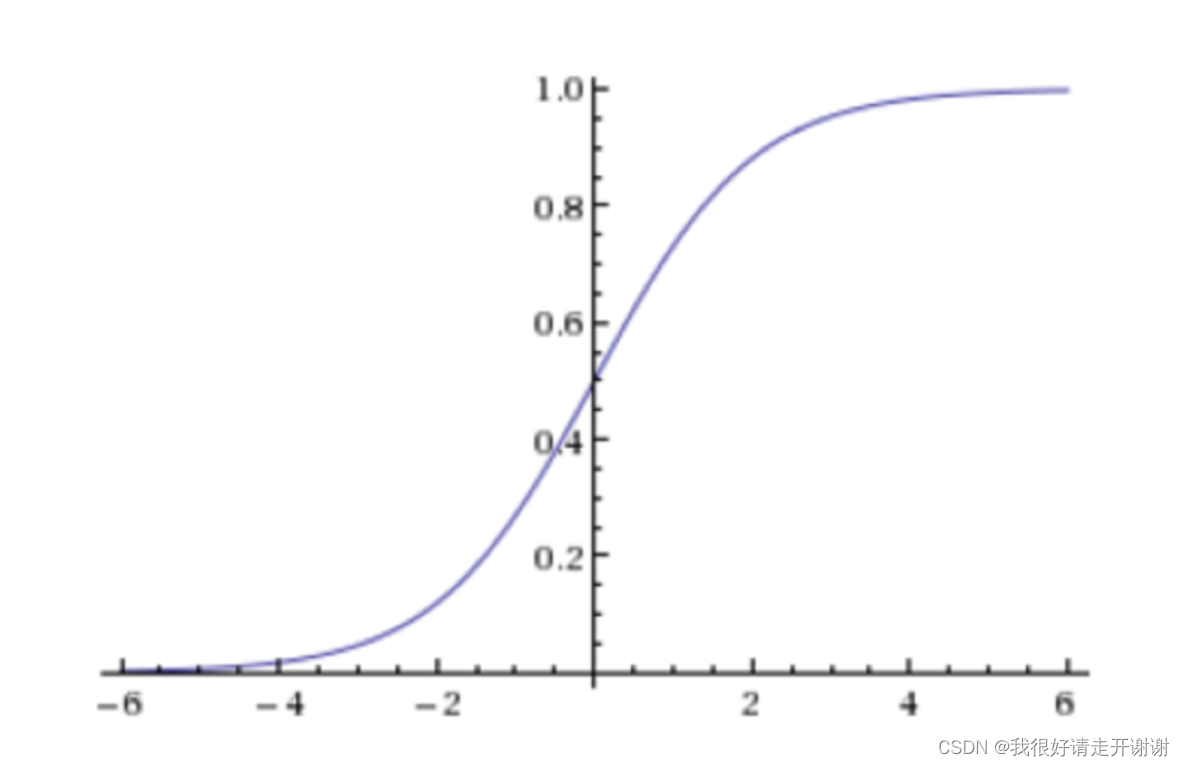
- 虽然带有“回归”两个字,But the output result is discrete.
- 和线性回归的区别,One more activation function(sigmoid函数),Increase the nonlinear fitting ability of the model.
2.损失和优化
逻辑回归的损失,称之为对数似然损失,公式如下:
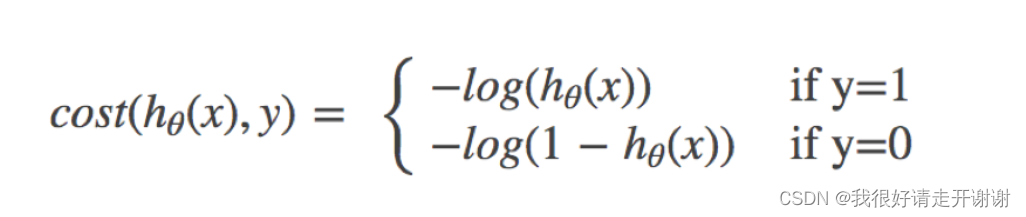
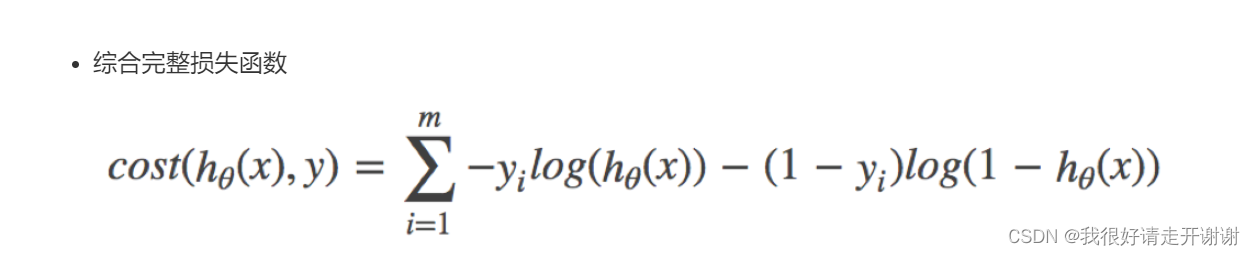
The loss value can be calculated by the above formula.
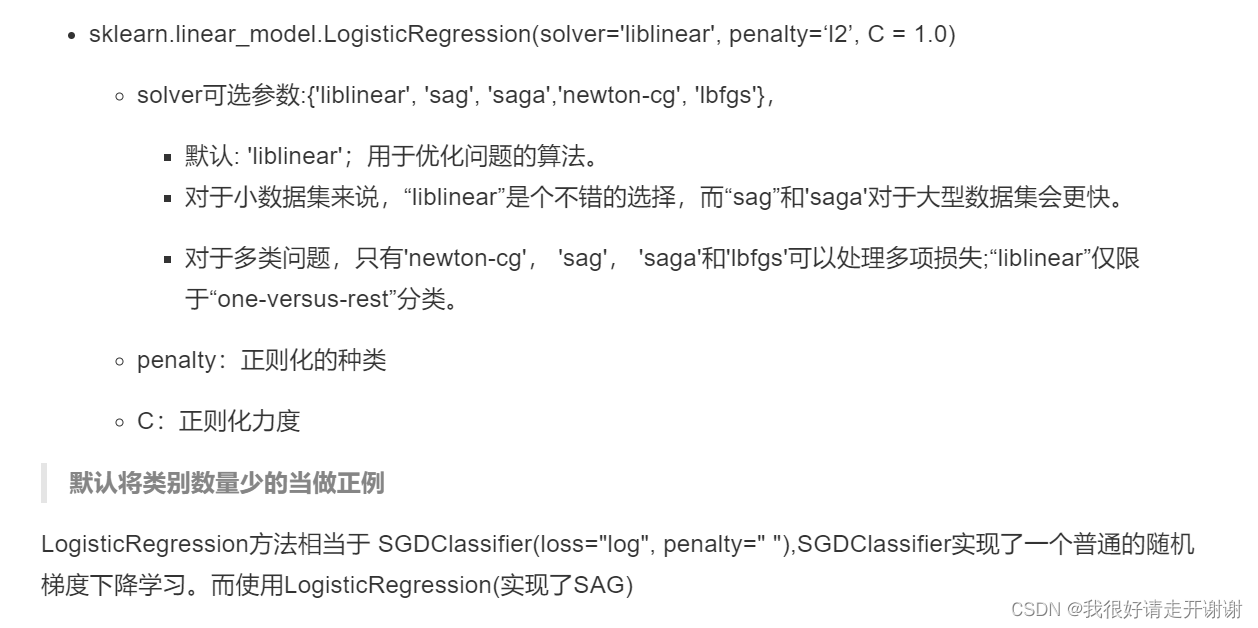
二、API介绍
三、案例:癌症分类预测
The point of the case is to use it“逻辑回归”this trainer
import pandas as pd
import numpy as np
from sklearn.model_selection import train_test_split
from sklearn.preprocessing import StandardScaler
from sklearn.linear_model import LogisticRegression
from sklearn.metrics import classification_report
from sklearn.metrics import roc_auc_score

# 步骤:
# 1.获取数据
# 2.基本数据处理
# 2.1 缺失值处理
# 2.2 确定特征值,目标值
# 2.3 分割数据
# 3.特征工程(标准化)
# 4.机器学习(逻辑回归)
# 5.模型评估 二分类、准确率、精确率、召回率

names = ['Sample code number', 'Clump Thickness', 'Uniformity of Cell Size', 'Uniformity of Cell Shape',
                   'Marginal Adhesion', 'Single Epithelial Cell Size', 'Bare Nuclei', 'Bland Chromatin',
                   'Normal Nucleoli', 'Mitoses', 'Class']
data = pd.read_csv("https://archive.ics.uci.edu/ml/machine-learning-databases/breast-cancer-wisconsin/breast-cancer-wisconsin.data",names=names)

#2.基本数据处理 缺失值处理(‘?’标记)
data = data.replace(to_replace='?',value=np.nan)  #把‘?’替换成np.nan
data = data.dropna() #删除np.nan

# 划分数据集
x = data.iloc[:,1:10] #特征值
y = data['Class'] #目标值
x_train, x_test, y_train, y_test = train_test_split(x, y, test_size=0.2)

# 3.特征工程 标准化
transfer = StandardScaler() #实例化转换器
x_train = transfer.fit_transform(x_train)
x_test = transfer.transform(x_test)

# 4.机器学习 逻辑回归建模
# 4.1建立模型
estimator = LogisticRegression()

# 4.2训练模型
estimator.fit(x_train, y_train)

# 5.模型评估
estimator.score(x_test, y_test)
结果:
0.948905109489051
四、分类评估方法
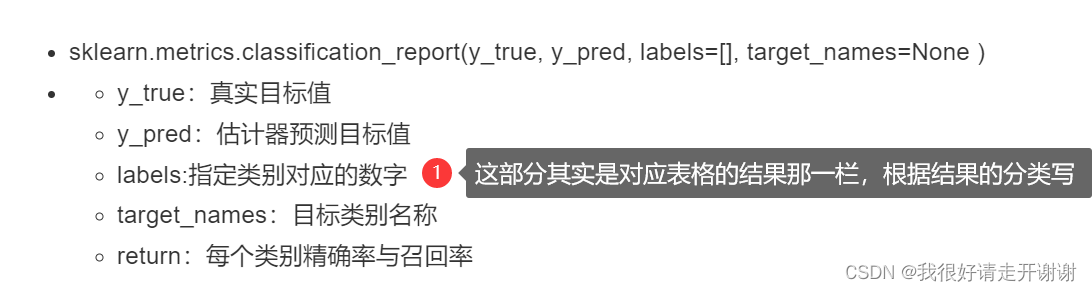
1. API
2. 例子
Then the above cancer prediction case is written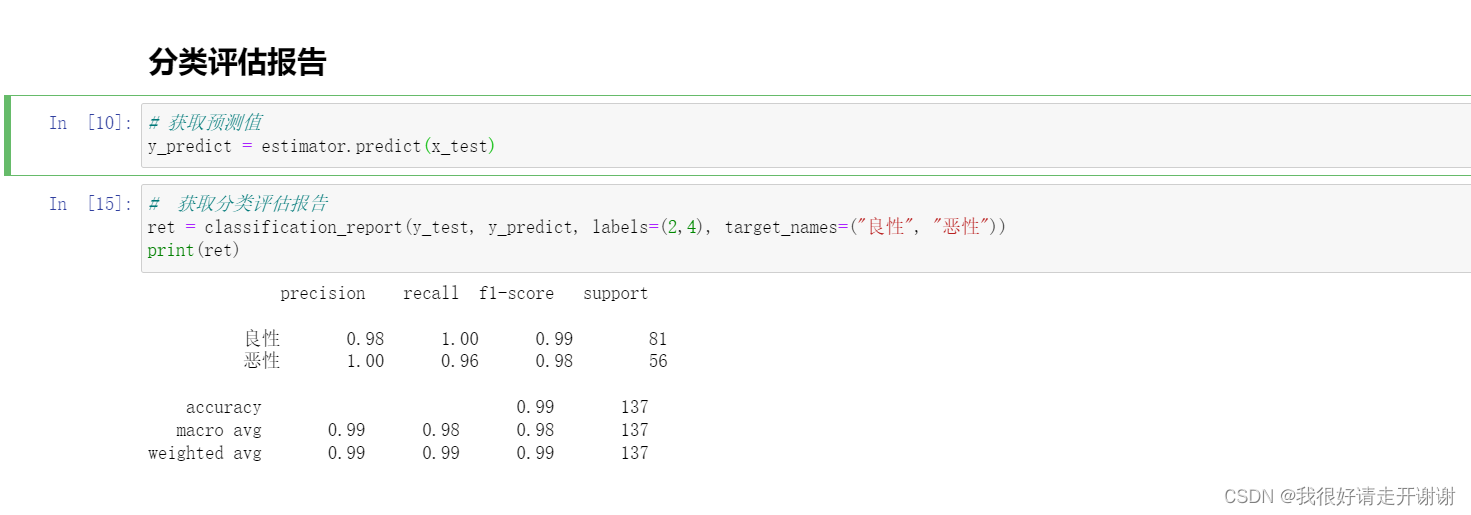
五、ROC曲线与AUC指标
1. ROC曲线:
- 先看图片
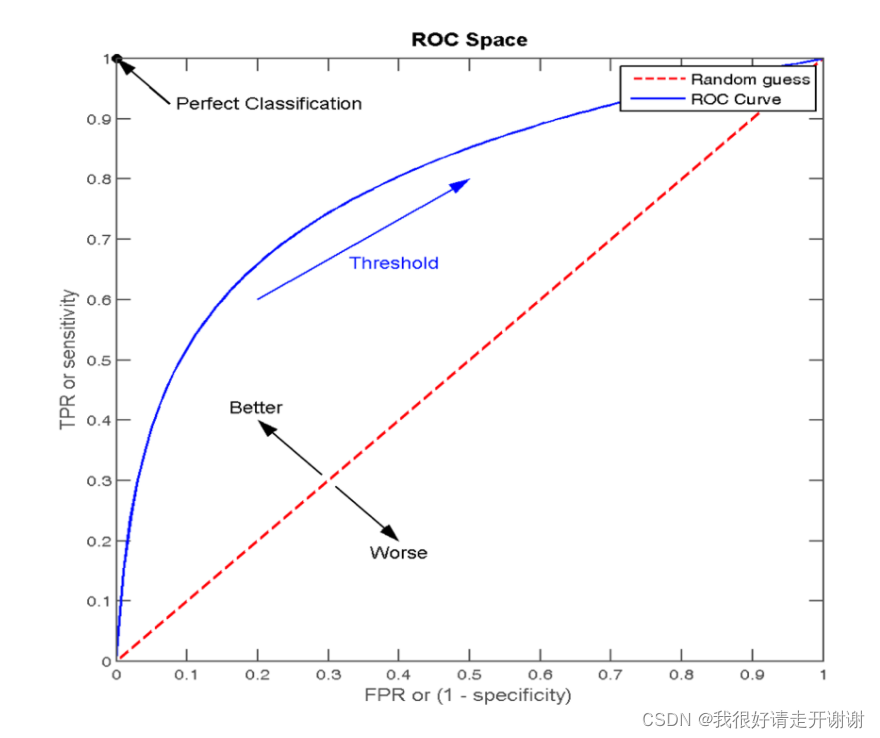
- 横纵坐标分别是TPR和FPR.那什么是TPR和FPR呢?
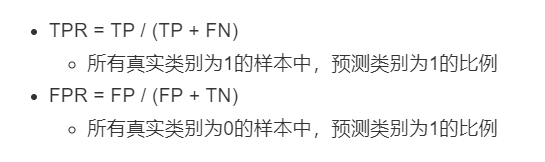
那什么又是TP、FP、FN、TN呢?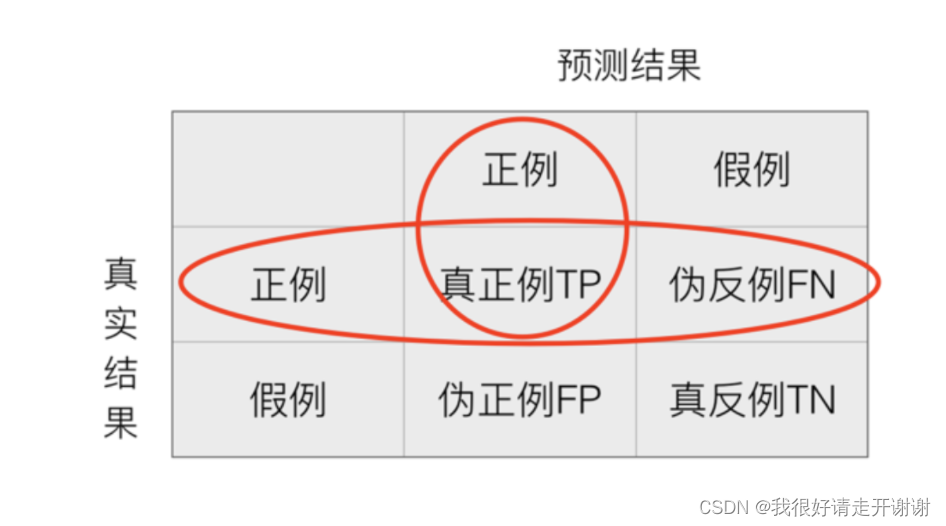
举个例子就好理解了: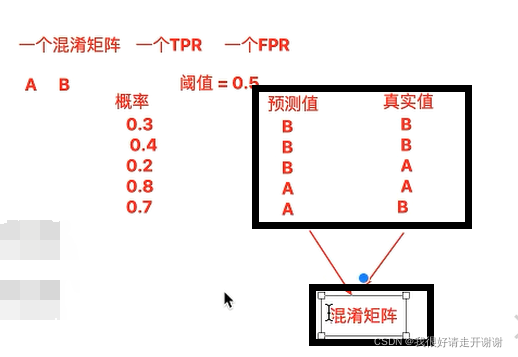
2. AUC指标
- 概念:It is to randomly take a pair of positive and negative samples,正样本得分大于负样本的概率.(To put it bluntly, it is the area of the slashed part in the figure below)
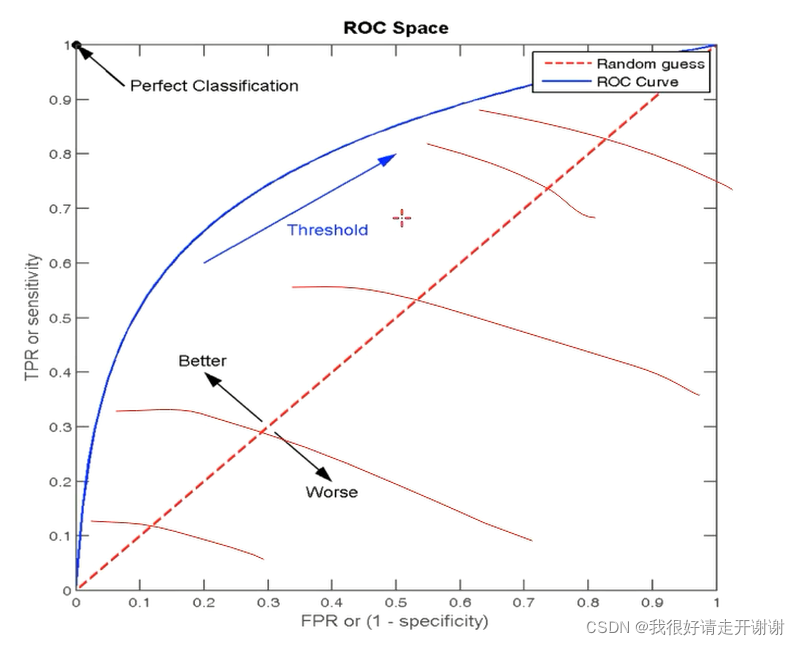
- AUC的最小值为0.5,最大值为1,取值越高越好
AUC计算API
- API
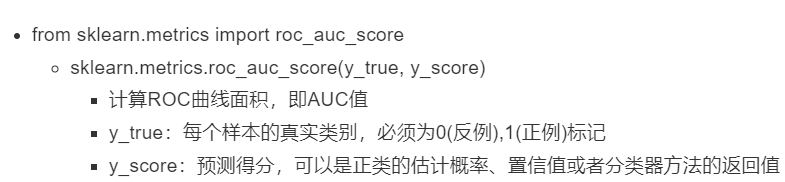
- 例子:
Still the next example of cancer prediction: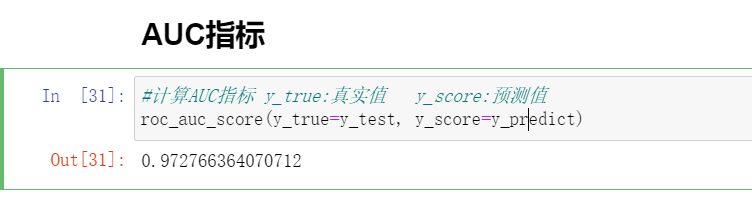
边栏推荐
猜你喜欢

CTFshow—Web入门—信息(9-20)
ThinkPHP5.0.x 反序列化分析
npm install dependency error npm ERR! code ENOTFOUNDnpm ERR! syscall getaddrinfonpm ERR! errno ENOTFOUND

自动化运维工具Ansible(2)ad-hoc
Matplotlib中的fill_between;np.argsort()函数
MySql的concat和group_concat的区别
k3s-轻量级Kubernetes
对象存储-分布式文件系统-MinIO-1:概念
yolov3中数据读入(一)

剑指 Offer 2022/7/3

随机推荐
[NSSRound#1 Basic]
SQl练习 2022/6/29
CTFshow—Web入门—信息(9-20)
攻防世界MISC———Dift
对象存储-分布式文件系统-MinIO-2:服务端部署
剑指 Offer 2022/7/5
yolov3数据读入(二)
进程、线程、协程的区别和联系?
剑指 Offer 2022/7/1
Kubernetes集群安装
关系型数据库-MySQL:多实例配置
ThinkPHP5.0.x 反序列化分析
剑指 Offer 2022/7/12
剑指 Offer 2022/7/3
npm install dependency error npm ERR! code ENOTFOUNDnpm ERR! syscall getaddrinfonpm ERR! errno ENOTFOUND
SQL练习 2022/6/30
Shell(3)条件控制语句
JS实现上一个、下一个、置顶、置底操作
自动化运维工具Ansible(6)Jinja2模板
自己学习爬虫写的基础小函数