当前位置:网站首页>Bi skills - permission axis
Bi skills - permission axis
2022-07-04 19:20:00 【Powerbi white tea】
BOSS:( Pull a long face ) What about white tea ?
colleagues :( Push... Push ) Wake up , White tea ,BOSS Call you !
White tea :( A face of meng ) Yo , Boss ?
BOSS:( A look of disdain ) White tea , There is a need. , Users need to be in the same chart , Indicators can be switched .
White tea : This has been done before , It's a dynamic indicator !
BOSS: Don't worry. , also , It's our different users , The roles are different , Whether different users can come in and see the coordinate axis of the chart varies from person to person ?
White tea : Permission axis ?
BOSS: Yes !
White tea :OK, Can do !
BI Report in practical application , Report permissions often need to be configured , for example RLS jurisdiction 、OLS jurisdiction 、 Page permissions, etc .
Actually , In addition to these three permissions , There is also a special permission requirement .
a sheet BI report form , There are many users , Different user roles are different . A lot of times , When users expect to open the report , According to your role , See the dimensions you need to observe .
So in PowerBI in , How to realize such requirements ?

Let's take a look at the case data in this issue :
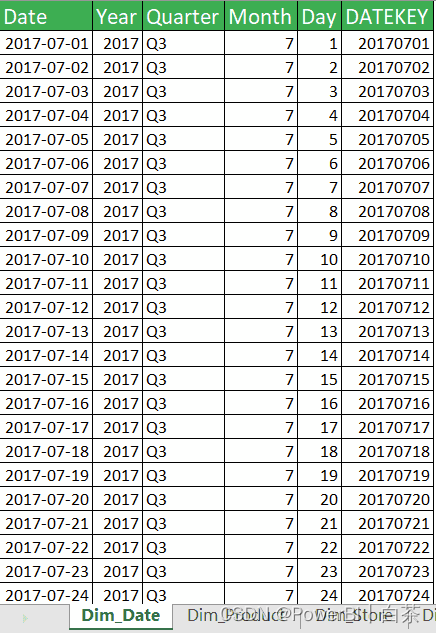
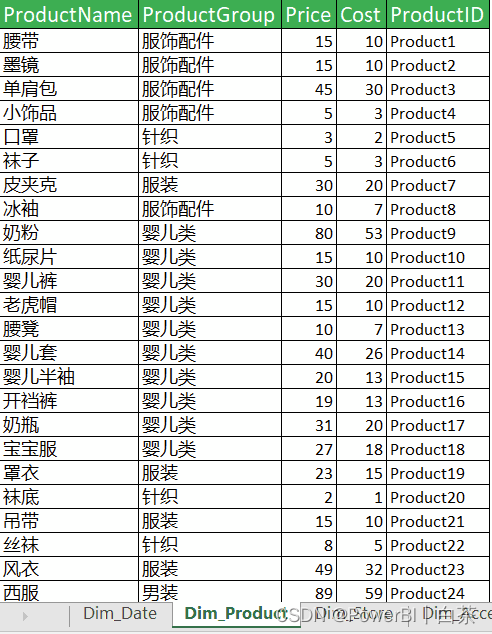
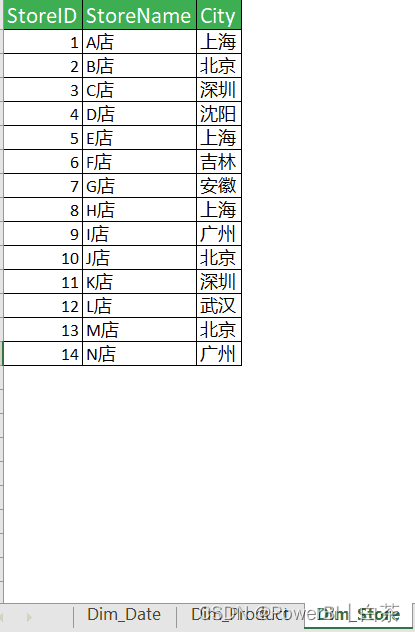
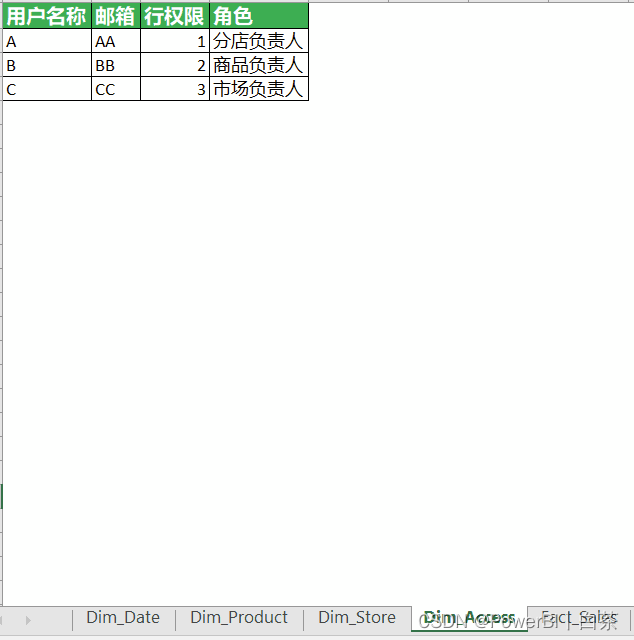
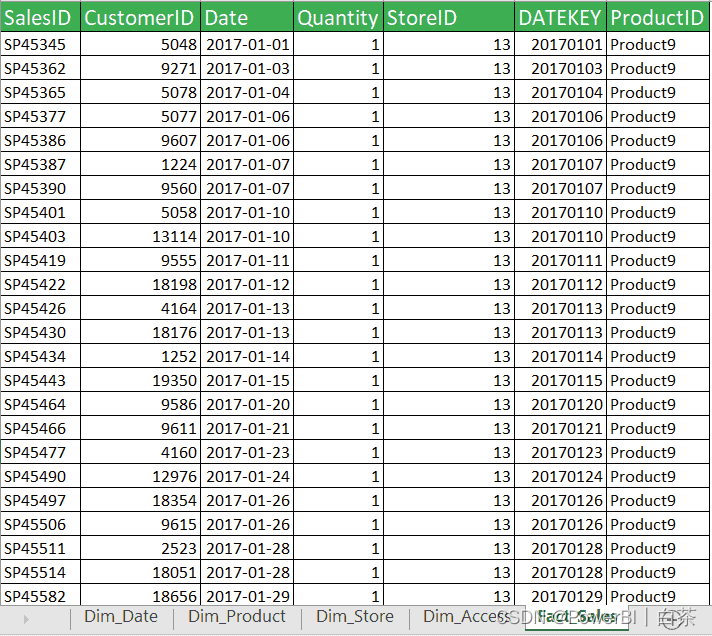
There are five tables of case data .Date Date sheet ,Product Product list ,Store Store table ,Access Permissions on the table ,Sales Sales fact sheet .
from Access You can see in the permission table , We have three users , On behalf of the person in charge of the branch 、 Product owner 、 Market leader , We need to , According to different roles of users , Automatically fit the corresponding dimension coordinate axis .
Import data into PowerBI, The model relationship is shown in the figure below :
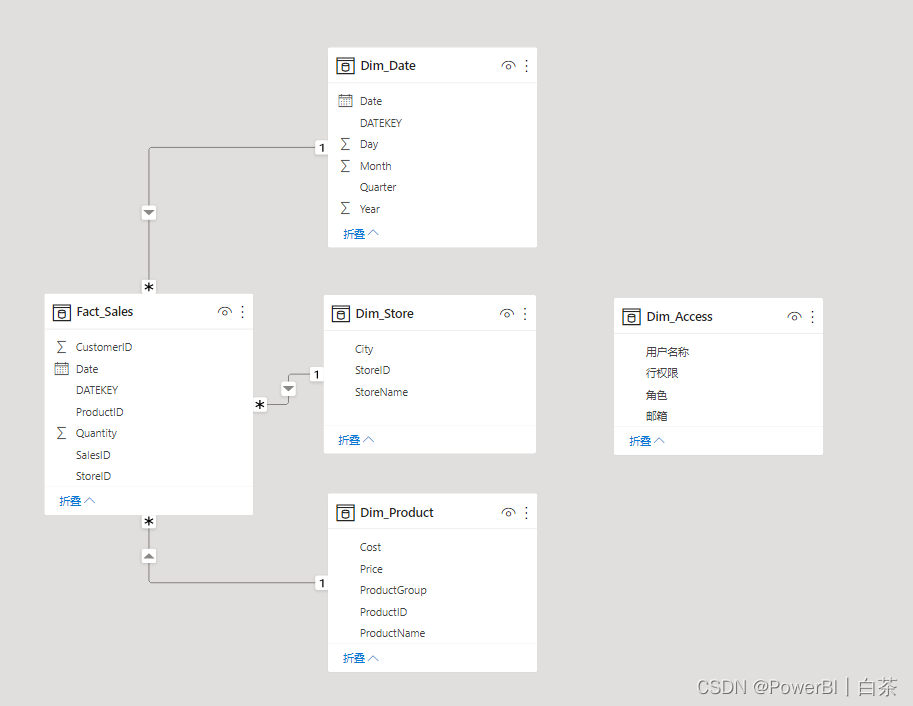
Attention, boys ,Access This table , There is no need to establish model relationships with other tables .
Build the metrics of the foundation :
sales volumes :
A. sales volumes  =
SUM ( Fact_Sales[Quantity] )
Sales amount :
B. Sales amount  =
SUMX ( 'Fact_Sales', [Quantity] * RELATED ( Dim_Product[Price] ) )
Build a dimension table for indicator switching :
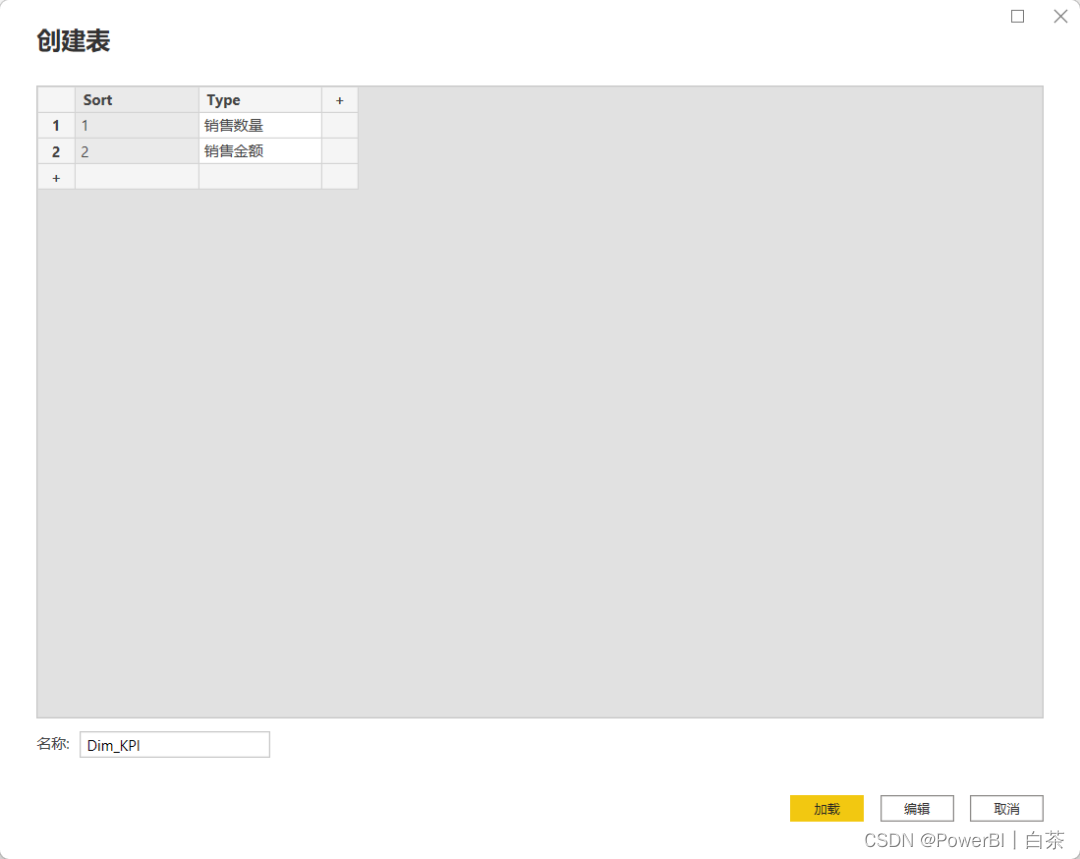
Add dynamic switching metrics :
C.KPI =
IF ( SELECTEDVALUE ( Dim_KPI[Sort] ) = 1, [A. sales volumes ], [B. Sales amount ] )
Come here , Our preparations are over , Think about it , How to achieve the dynamic switching effect of permission axis in the next step .
Think about it
1
2
3
…
The permission dynamic axis needs to complete two conditions :
1. There needs to be a table containing all user demand dimensions ;
2. You need to configure the data permissions of dimension tables according to user permissions .
Build a dynamic analysis dimension table :
Create a new table , Enter the following code :
Dim_Analysis =
VAR Store =
    SELECTCOLUMNS (
        ADDCOLUMNS ( DISTINCT ( 'Dim_Store'[StoreName] ), "Analysis", "1" ),
        "Analysis", [Analysis],
        "Display", [StoreName]
    )
VAR ProductName =
    SELECTCOLUMNS (
        ADDCOLUMNS ( DISTINCT ( 'Dim_Product'[ProductName] ), "Analysis", "2" ),
        "Analysis", [Analysis],
        "Display", [ProductName]
    )
VAR City =
    SELECTCOLUMNS (
        ADDCOLUMNS ( DISTINCT ( 'Dim_Store'[City] ), "Analysis", "3" ),
        "Analysis", [Analysis],
        "Display", [City]
    )
RETURN
    UNION ( Store, ProductName, City )
give the result as follows :
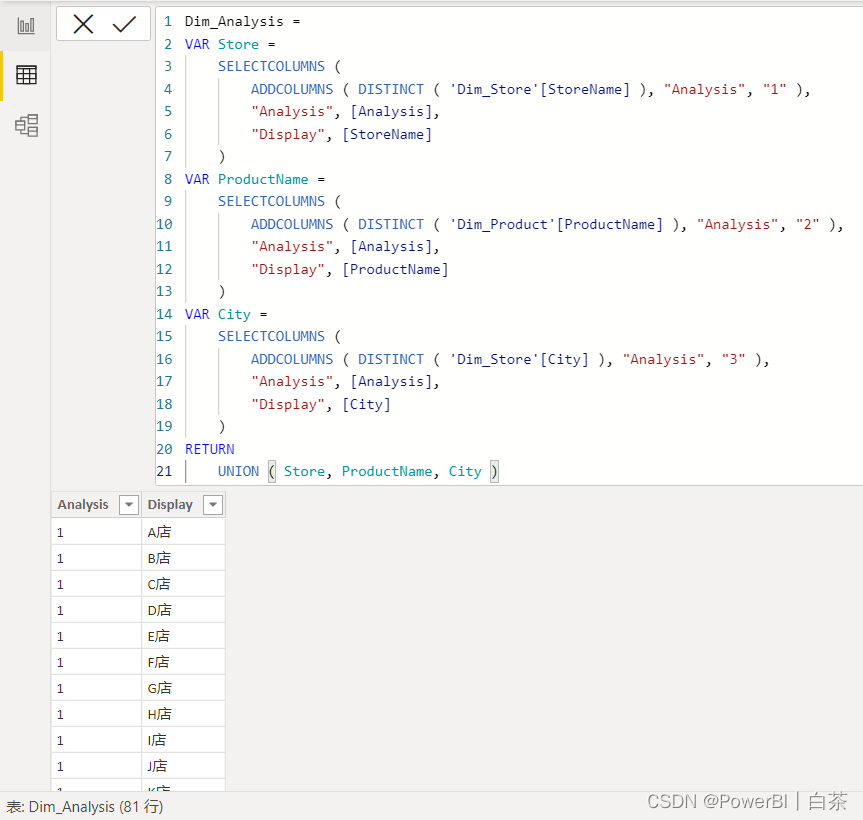
This code , Equivalent to store 、 product 、 These three dimensions of the city are forcibly combined to generate a new table .
Add the following measures :
D.AnalysisKPI =
VAR Store =
    TREATAS ( VALUES ( 'Dim_Analysis'[Display] ), 'Dim_Store'[StoreName] )
VAR ProductName =
    TREATAS ( VALUES ( 'Dim_Analysis'[Display] ), 'Dim_Product'[ProductName] )
VAR City =
    TREATAS ( VALUES ( 'Dim_Analysis'[Display] ), 'Dim_Store'[City] )
VAR Analysis =
    SELECTEDVALUE ( 'Dim_Analysis'[Analysis] )
RETURN
    SWITCH (
        TRUE (),
        Analysis = "1", CALCULATE ( [C.KPI], Store ),
        Analysis = "2", CALCULATE ( [C.KPI], ProductName ),
        Analysis = "3", CALCULATE ( [C.KPI], City ),
        BLANK ()
    )
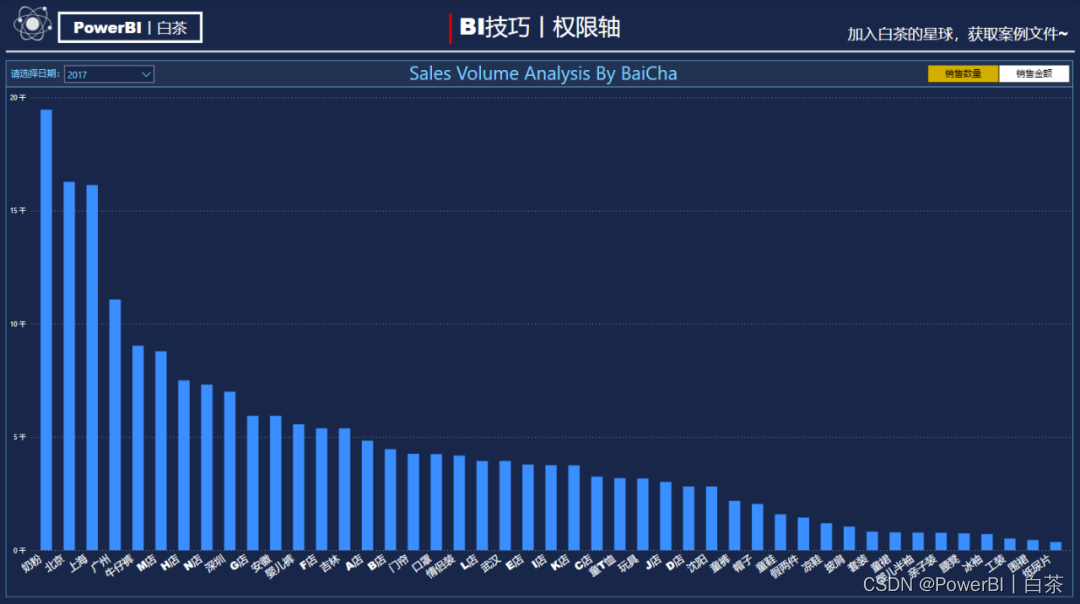
The effect is as follows :

White tea hopes that the title can also be automatically adapted according to the user's permission .
Add the following code :
E.Title =
VAR T1 =
    IF ( SELECTEDVALUE ( Dim_KPI[Sort] ) = 1, "Sales Volume", "Revenue" )
VAR T2 =
    SELECTEDVALUE ( Dim_Analysis[Analysis] )
VAR T3 =
    SWITCH (
        TRUE (),
        T2 = "1", "Store",
        T2 = "2", "Product",
        T2 = "3", "City",
        "BaiCha"
    )
RETURN
    T1 & " Analysis By " & T3
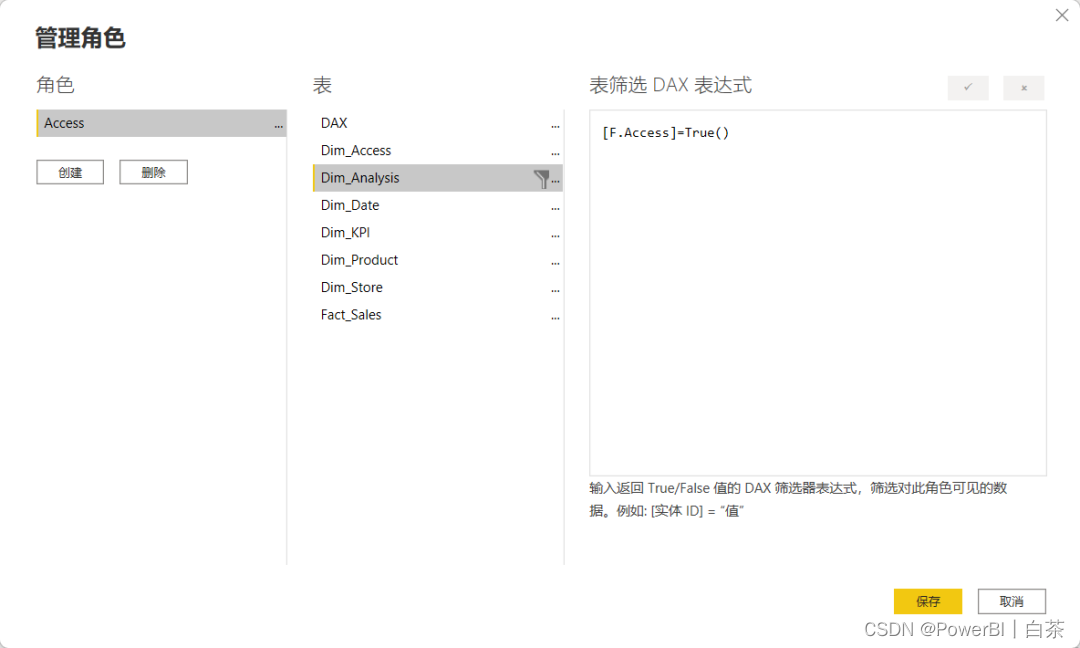
Add user permission metrics :
The measurements are as follows :
F.Access =
VAR UserAccess =
    CALCULATETABLE (
        VALUES ( Dim_Access[ Line authority ] ),
        'Dim_Access'[ mailbox ] = USERPRINCIPALNAME ()
    )
VAR Access =
    SELECTEDVALUE ( Dim_Analysis[Analysis] ) IN UserAccess
RETURN
    Access
Under the modeling panel , Select the management role , Enter character “Access”, Enter the following code :
[F.Access]=True()
give the result as follows :
Beautify the report , The final display effect is shown in the figure below :


(BOSS:Nice!)
Demo Documents on the planet of knowledge .
This is white tea , One PowerBI Beginners .
边栏推荐
猜你喜欢
建立自己的网站(15)
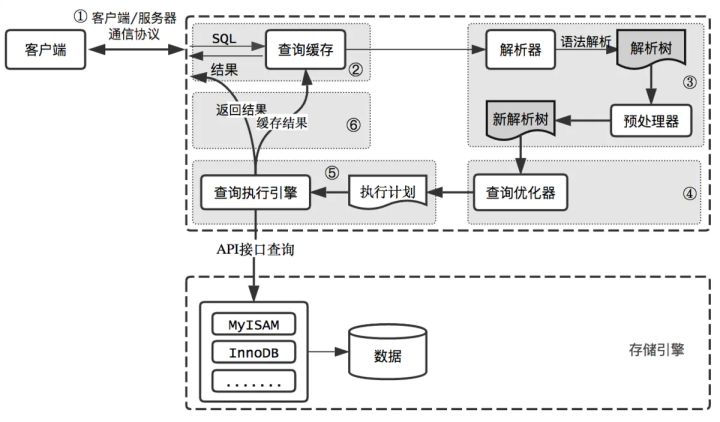
输入的查询SQL语句,是如何执行的?

LeetCode第300场周赛(20220703)
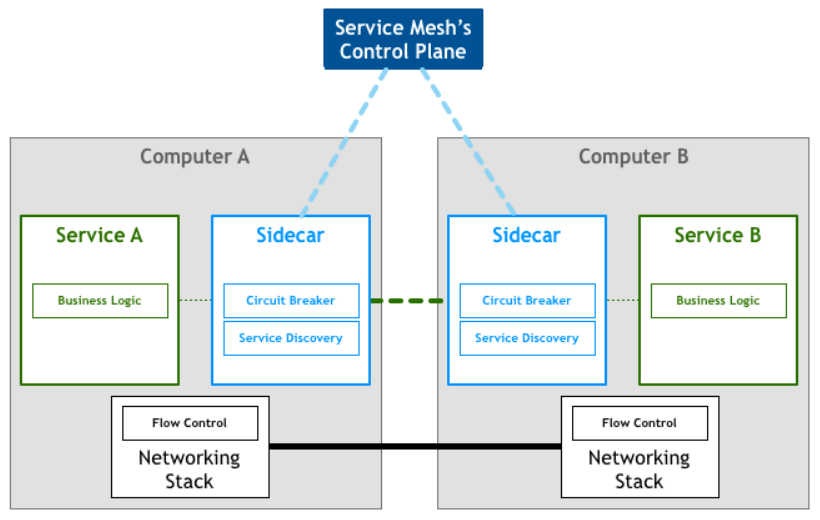
激进技术派 vs 项目保守派的微服务架构之争
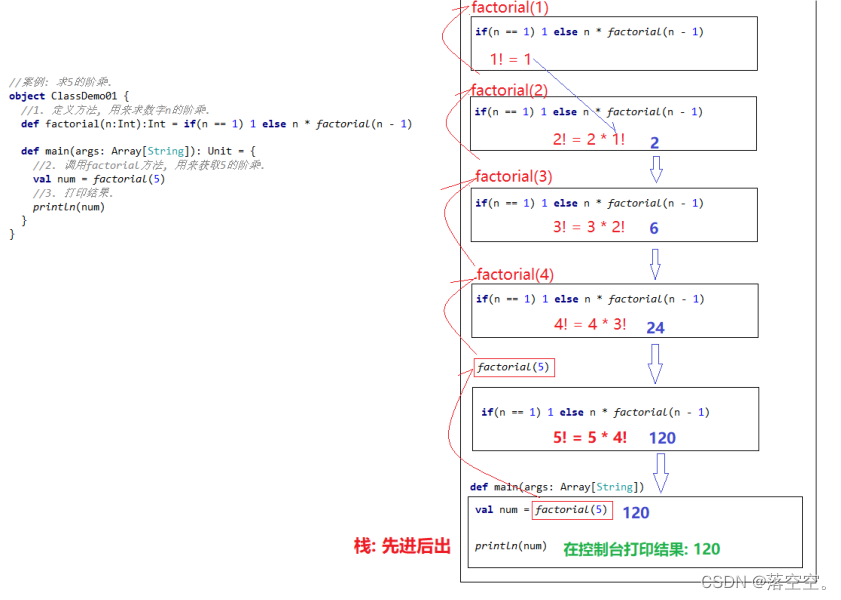
Scala基础教程--15--递归
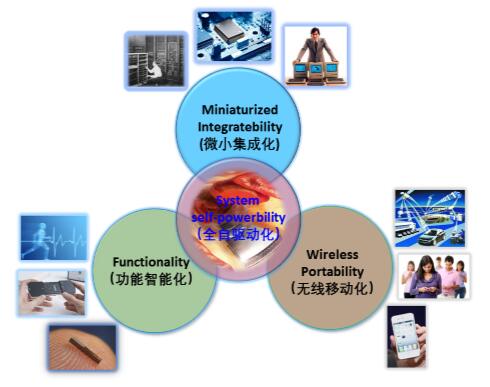
神经网络物联网应用技术学什么
神经网络物联网应用技术就业前景【欢迎补充】
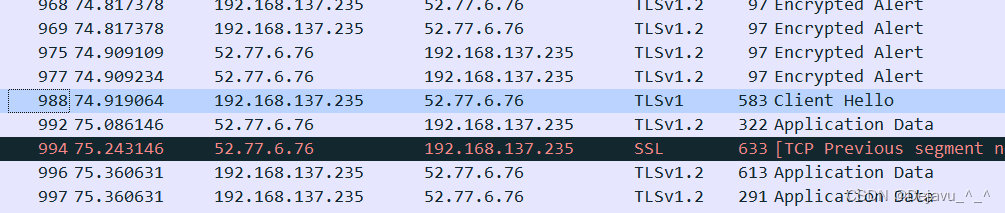
Wireshark抓包TLS协议栏显示版本不一致问题
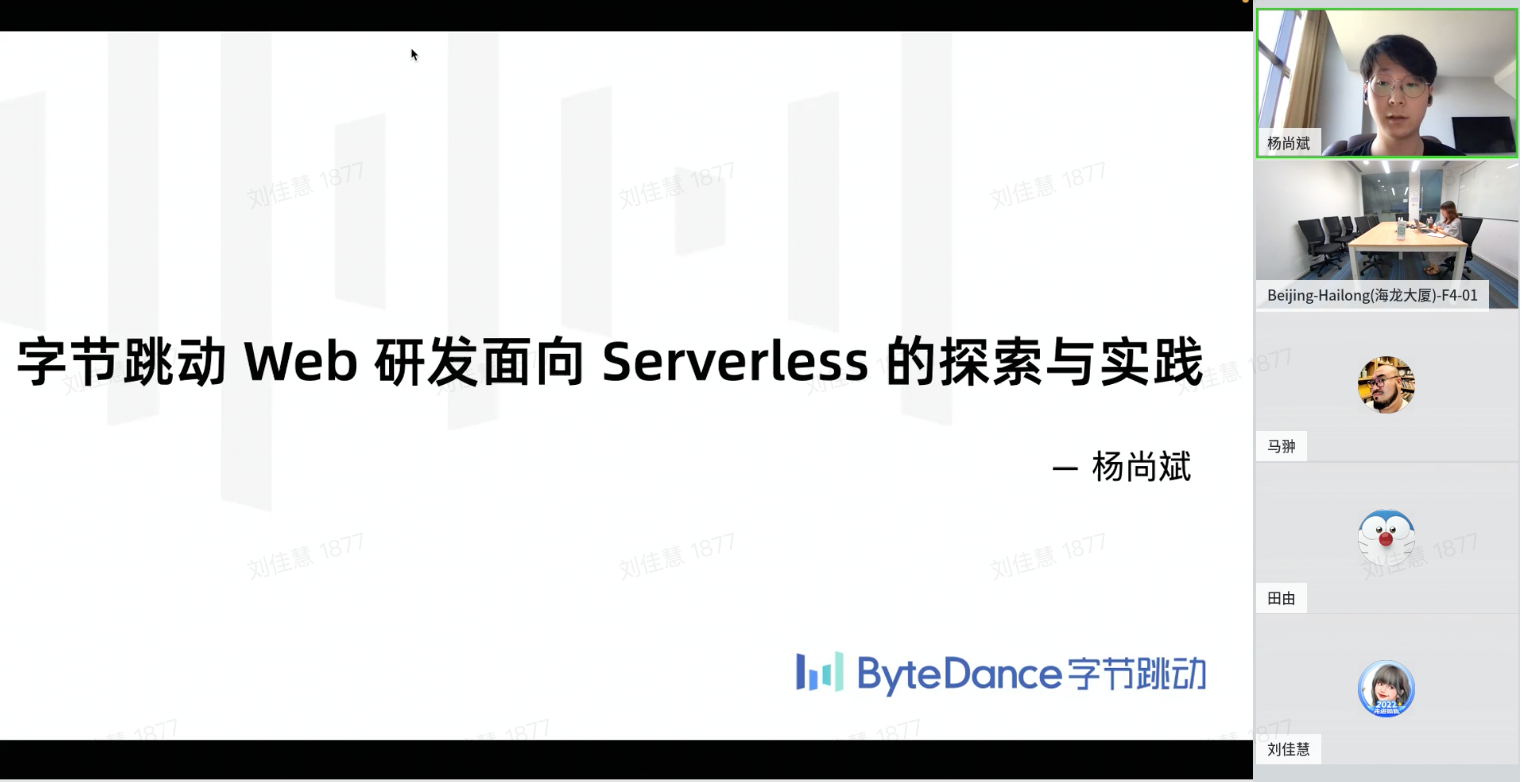
ByteDance dev better technology salon was successfully held, and we joined hands with Huatai to share our experience in improving the efficiency of web research and development
![[mathematical modeling of graduate students in Jiangxi Province in 2022] analysis and code implementation of haze removal by nucleation of water vapor supersaturation](/img/da/d46cca19f34223d29003be2e33aaa4.png)
[mathematical modeling of graduate students in Jiangxi Province in 2022] analysis and code implementation of haze removal by nucleation of water vapor supersaturation
随机推荐
Mxnet implementation of googlenet (parallel connection network)
[mathematical basis of machine learning] (I) linear algebra (Part 1 +)
File processing examples of fopen, FREAD, fwrite, fseek
Download the first Tencent technology open day course essence!
Li Kou brush question diary /day4/6.26
IBM WebSphere MQ检索邮件
读写关闭的channel是啥后果?
李迟2022年6月工作生活总结
2021 合肥市信息学竞赛小学组
技术分享 | 接口测试价值与体系
Is Guoyuan futures a regular platform? Is it safe to open an account in Guoyuan futures?
ByteDance dev better technology salon was successfully held, and we joined hands with Huatai to share our experience in improving the efficiency of web research and development
ThreadLocal原理与使用
Pb extended DLL development (super chapter) (VII)
[cloud voice suggestion collection] cloud store renewal and upgrading: provide effective suggestions, win a large number of code beans, Huawei AI speaker 2!
Angry bird design based on unity
英特尔集成光电研究最新进展推动共封装光学和光互连技术进步
字节跳动Dev Better技术沙龙成功举办,携手华泰分享Web研发效能提升经验
vbs或vbe如何修改图标
神经网络物联网应用技术就业前景【欢迎补充】