当前位置:网站首页>Data analysis learning records -- complete a simple one-way ANOVA with Excel
Data analysis learning records -- complete a simple one-way ANOVA with Excel
2022-07-02 22:55:00 【Cannon cannon cannon~~】
Data analysis learning records – use EXCEL Complete a simple one-way ANOVA
One Introduction and concept
Analysis of variance is usually used to test whether there is a difference in the number of three or more samples , More often, we call analysis of variance “F test ”, The two most important concepts are the original hypothesis and the alternative hypothesis :
The null hypothesis H0: The mean of each group is equal (H1=H2=H3=H4…=Hk);
The alternative hypothesis H1: The mean of each group is not all equal ;
The judgment method is also very simple , It may be difficult to understand with the concept of Statistics , So I'll put the concept here first , The following will give you a simple example to illustrate .
According to statistics F Value size and correspondence p Value as the criterion of judgment , if p≤0.05, Refuse H0, Accept H1, That is, the population mean of each sample is not all equal ; conversely , received H0, Refuse H1, The population mean of each sample is all equal .
Two example
First of all, here is a set of data for your analysis ( Of samples at different extraction times UV254 The difference in value , Three experiments have been done here ):
stay excel Before performing one-way ANOVA in, we need to transpose the data .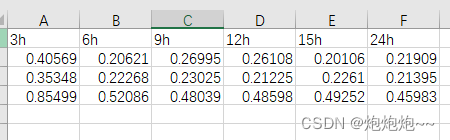
The next in excel Found in one-way ANOVA , As shown in the figure :
Click OK excel A prompt box will pop up , The first thing to note is if you are choosing Input area when , Title selected , So down there The flag is on the first line You need to check , Empathy , If your table is horizontally distributed , Then you need to be in How to group Select That's ok , The prompt below will change to The sign is in the first column ; After selecting the input area, we can set whether the generated analysis results are in the current table or in the new table , So here's what I chose New worksheet group , After choosing, let's order determine .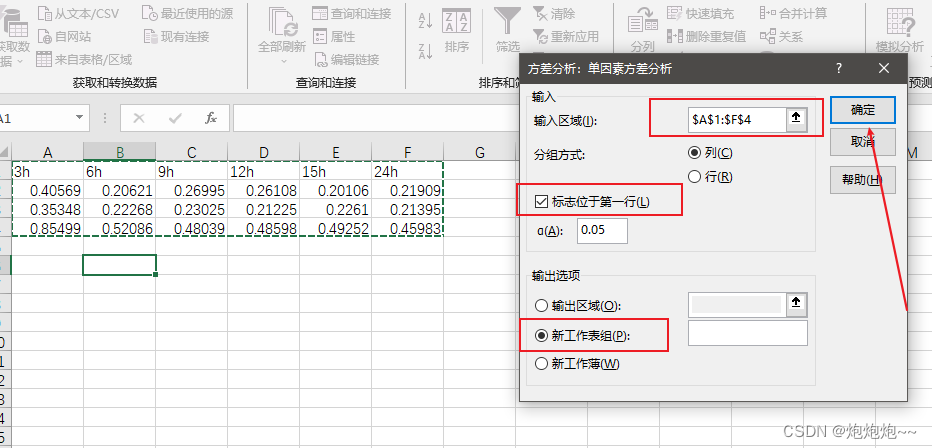
The figure below is the analysis of variance table we generated :
Let me give a little explanation about the contents in the table , First we know that :

The original hypothesis and alternative hypothesis are the first point we need to clarify , Then let's focus on obey F The test statistics of the distribution :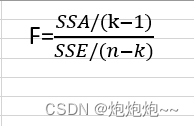
among ,SSA Is the sum of squares between groups ,SSE Is the sum of squares in the group ,k-1 It's the degree of freedom , In the table df It also represents degrees of freedom ,n Is the sample size , here n=18,k=6,SSA/(k-1)=MSA,SSE/(n-k)=MSE;MSE Is the mean square of the Group ,MSA Is the mean square between groups . We can get MSA=0.025533,MSE=0.0321, Of course, these results are all in the table , We can compare it , At this time F The test statistic is equal to MSA/MSE=0.795416.
When the original hypothesis holds, we should obey F Distribution :F~(5,12), There are two ways to judge whether the original hypothesis is true ( Whether to reject the original assumption ). The first one is We can see P value , In this theoretical distribution , Get ratio 0.795416 The more extreme probability is P value :
P-value=0.573332>α=0.05
So the original hypothesis holds – namely There was no significant difference .
The second kind The method is also called Critical value method , We can see in the table F crit Value , That is our critical value :
F0.05(5,12)=3.105875>0.795416
Description is not in the reject field , Original assumption holds – namely There was no significant difference .
3、 ... and summary
- One way ANOVA is used to test whether the mean values of multiple independent samples are different .
- When the analysis result of variance reaches the significance level (P≤0.05), It can only show that the overall mean of multiple groups is not all the same , However, multiple comparisons are needed to know which two groups have differences in mean ; If the result of ANOVA is not significant , You don't need to .
- Two independent groups can be used to compare the mean of the two groups T test , Of course, one-way ANOVA can also be used , If the number of sample groups exceeds three ( Three or more groups ), Only one-way ANOVA can be used .
above !!!( If there is something wrong Welcome to point out .)
边栏推荐
- 送给即将工作的自己
- 手写ORM(对象关系映射)增删改查
- UE4 UI adaptive screen
- Addition, deletion, modification and query of handwritten ORM (object relationship mapping)
- How can I use knockout's $parent/$root pseudovariables from inside a . computed() observable?
- 加油站[问题分析->问题转换->贪心]
- P1007 独木桥
- [ODX studio edit PDX] -0.1- how to quickly view the differences in supported diagnostic information between variant variants (service, sub function...)
- 【硬件】标准阻值的由来
- To myself who is about to work
猜你喜欢


随机推荐
Server response status code
杰理之直接触摸样机的顶针反应不正常【篇】
Qt QScrollArea
JS solution for obtaining the width and height of hidden elements whose display is none
高并发介绍及应对
mysql重置密码,忘记密码,重置root密码,重置mysql密码
[micro service sentinel] rewrite Sentinel's interface blockexceptionhandler
从2022年Q1财报看携程的韧性和远景
数据分析学习记录--用EXCEL完成简单的单因素方差分析
Notes on key vocabulary of the original English book biography of jobs (IX) [chapter seven]
Wait to solve the zombie process
Socket socket c/s end process
Additional: [login information storage] and [login status verification]; (including: summarizing all the contents of [login information storage] and [login status verification] so far;)
世界环境日 | 周大福用心服务推动减碳环保
PHP implements querying the data matching the date of birth according to the entered age
PMP项目整合管理
[leetcode] number of palindromes [9]
[羊城杯2020]easyphp
boot actuator - prometheus使用
World Environment Day | Chow Tai Fook serves wholeheartedly to promote carbon reduction and environmental protection