当前位置:网站首页>How to do thread dump analysis in Windows Environment
How to do thread dump analysis in Windows Environment
2020-11-09 00:33:00 【Java old K】
Now most companies have their own complete set of monitoring system , For example, meituan's CAT, Our company's monitoring system is also based on CAT Do secondary development . General test environment or production environment has problems, you can directly use these systems to view the running situation of threads and memory , Analyze and solve problems .
It is necessary for us to understand the original process , That is, without the help of these systems , Use the most basic commands to solve , After all, it's helpful to understand these underlying implementations for your own development .
There are a lot of articles like this on the Internet , For example, check cpu Too high , Deadlock problem article , But most of it is about Linux How to do it in the environment , In fact, many problems can be found and checked in local development , So I'll mainly talk about Windows How to investigate in the environment , Here's an example of java Apply the troubleshooting method for deadlock problems .
There are two main ways , One is to use JVM Instructions +Process Explorer Tools , The other is to use jdk/bin In the catalog jvisualvm.exe Tools
One . JVM Instructions +Process Explorer
Commonly used JVM Instructions :
jpsIt is mainly used to output jvm Running process statusjstackView a certain java In process thread stack information
For all commands, please refer to the official documentation
Process Explorer yes windows The process manager of the system , You can view the corresponding pid( process id) Thread information under , It is convenient to locate which thread owns cpu High resources .
The screening process :
1. open Process Explorer Tools , Find one's own java application , If you don't know what's wrong java Which process is , Can be in windows Of cmd Input in the command window jps Command to see all java Application process id, Pictured :
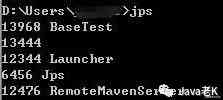
If you're not sure which pid Is your java application , You can add -lm Parameters ,
namely :jps -lm, Print out the detailed class name , It's easy to find the corresponding pid
Another way is in the task manager ( Task manager - see - Select column -pid) You can also find the corresponding pid
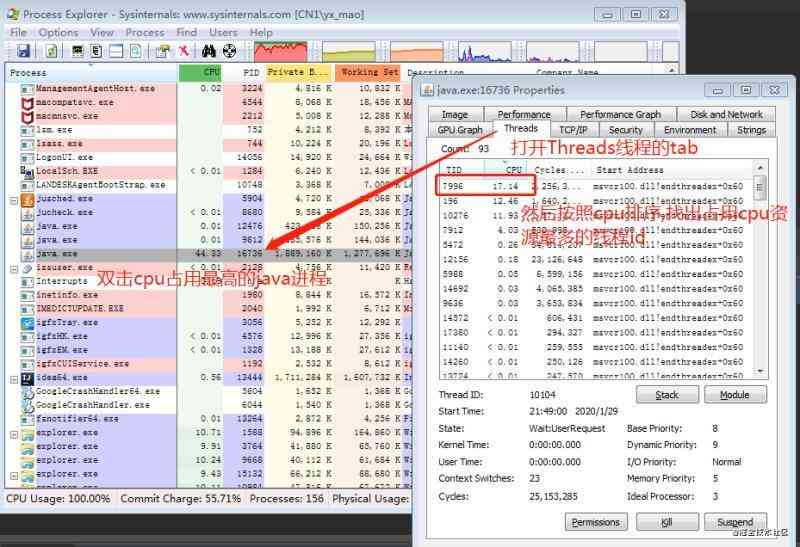
2. According to the first step we found pid stay Process Explorer The tool finds that line of record and double-click to open it Thread One column tab, You can see it java process pid The corresponding thread information ,TID It's the corresponding thread id, Pictured :
3. stay cmd The command line window uses jstack Give orders to java Stack information of the application dump Local analysis , Of course, you can also analyze it directly in the command line window , But the general stack information is relatively large , All the thread information is in it , We only care about the stack information of the thread in question , In this way, you can use : jstack pid|findstr tid This command finds the thread we care about id, But still suggest dump Search locally , there tid Pay attention to ,jstack Thread in id It's in hexadecimal , You need to put the number 2 Step inside tid( Decimal system ) To hexadecimal , Pictured :

jstack After the order -l The parameter represents the output lock information

- open dump text file , Through hexadecimal tid Find the corresponding stack information , You can locate the specific business code call location :

As can be seen from the figure above, the code that caused the problem is DeadLockTest Of 70 That's ok , The status of the thread is BLOCKED, because dump Thread with -l Parameters of (jstack -l pid), So in dump Bottom of jvm Will output deadlock information :

Obviously Thread-1 The thread is waiting 0x000000076b940cf0 This lock , It holds 0x000000076b940d00 This lock , and Thread-0 Just waiting for 0x000000076b940d00 This lock , The lock it holds is 0x000000076b940cf0, In this way, two threads wait for each other's locks , It leads to deadlock .
Two . jvisualvm.exe Tools
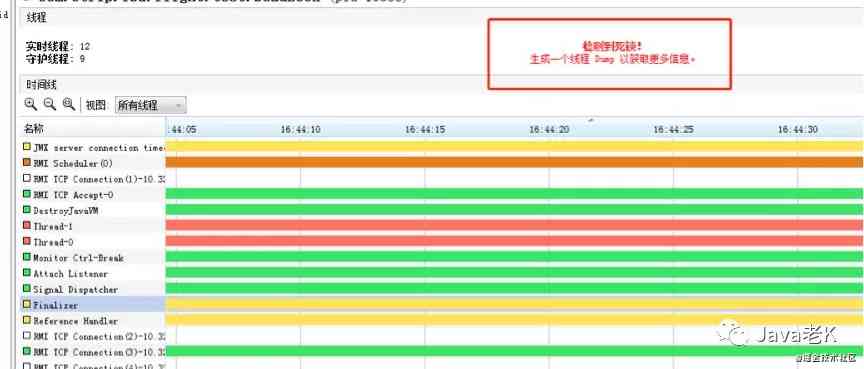
This tool is in JDK Of the installation directory bin Folder , Open it and find the corresponding one pid, It's actually a visit to us JVM Stack information in the virtual machine , The advantage is that it is intuitive and convenient to view the running situation of the thread , If there is a deadlock, it will be prompted , Pictured :
Source of the article :javakk.com/176.html
版权声明
本文为[Java old K]所创,转载请带上原文链接,感谢
边栏推荐
- 六家公司CTO讲述曾经历的“宕机噩梦”
- 服务器性能监控神器nmon使用介绍
- 服务器性能监控神器nmon使用介绍
- App crashed inexplicably. At first, it thought it was the case of the name in the header. Finally, it was found that it was the fault of the container!
- 小议缓冲区溢出
- App crashed inexplicably. At first, it thought it was the case of the name in the header. Finally, it was found that it was the fault of the container!
- Copy on write collection -- copyonwritearraylist
- Flink的DataSource三部曲之三:自定义
- Table join
- How to deploy pytorch lightning model to production
猜你喜欢
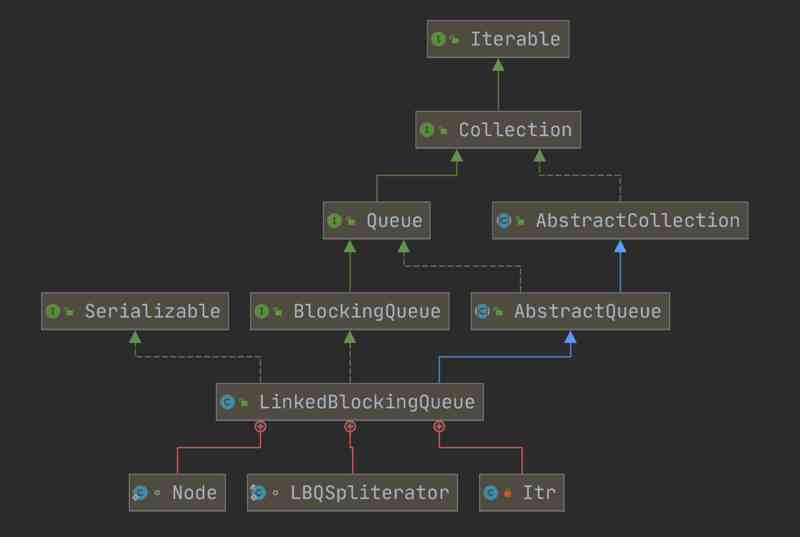
Linked blocking queue based on linked list

Table join
14. Introduction to kubenetes
leetcode之反转字符串中的元音字母
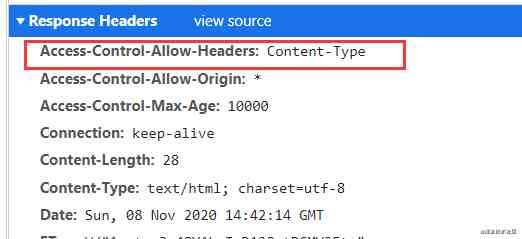
理论与实践相结合彻底理解CORS
Teacher Liang's small class
First development of STC to stm32
Fiddler can't grab requests from browsers like Google_ Solution
Octave basic syntax
Combine theory with practice to understand CORS thoroughly
随机推荐
写时复制集合 —— CopyOnWriteArrayList
VIM Introduction Manual, (vs Code)
leetcode之反转字符串中的元音字母
Introduction to nmon
Chapter 5 programming
Dynamic ReLU:微软推出提点神器,可能是最好的ReLU改进 | ECCV 2020
一堆代码忘了缩进?快捷方式教你无忧无虑!
Five phases of API life cycle
14.Kubenetes简介
How to deploy pytorch lightning model to production
App crashed inexplicably. At first, it thought it was the case of the name in the header. Finally, it was found that it was the fault of the container!
C / C + + Programming Notes: pointer! Understand pointer from memory, let you understand pointer completely
Octave basic syntax
Execution of SQL statement
Fiddler无法正常抓取谷歌等浏览器的请求_解决方案
数据库设计:范式与反范式
1.操作系统是干什么的?
几行代码轻松实现跨系统传递 traceId,再也不用担心对不上日志了!
梁老师小课堂|谈谈模板方法模式
上线1周,B.Protocal已有7000ETH资产!