当前位置:网站首页>Qcustomplot 1.0.1 learning (3) - plotting quadratic functions
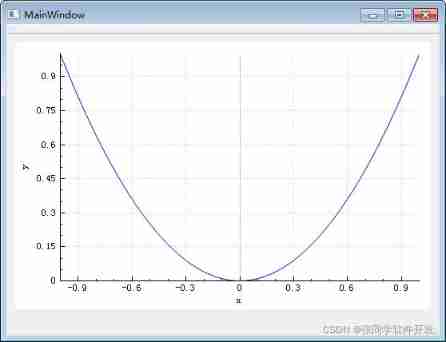
Qcustomplot 1.0.1 learning (3) - plotting quadratic functions
2022-06-11 15:09:00 【Zhang classmate software development】
Interface :
Core code :
    // generate some data:
    QVector<double> x(101), y(101); // initialize with entries 0..100
    for (int i=0; i<101; ++i)
    {
      x[i] = i/50.0 - 1; // x goes from -1 to 1
      y[i] = x[i]*x[i];  // let's plot a quadratic function
    }
    // create graph and assign data to it:
    customPlot->addGraph();
    customPlot->graph(0)->setData(x, y);
    // give the axes some labels:
    customPlot->xAxis->setLabel("x");
    customPlot->yAxis->setLabel("y");
    // set axes ranges, so we see all data:
    customPlot->xAxis->setRange(-1, 1);
    customPlot->yAxis->setRange(0, 1);
Source code :
https://gitee.com/zhangtongxueruanjiankaifa/qcustom-plot-demo/tree/master/QuadraticDemo
边栏推荐
- Uniapp développe des applets Wechat, de la construction à la mise en ligne
- 01discussion on Tekton
- Ali, tell me about the application scenarios of message oriented middleware?
- Managing technology debt in a microservice architecture
- Lippon instrument software intern interview
- How about art plus online school? Is it a new online organization?
- one hundred and twenty-three thousand four hundred and sixty-five
- C语言简易版webserver
- Microservices - use of Nacos
- PowerShell主架构师:我用业余时间开发项目,表现优秀反而被微软降级了
猜你喜欢

uniapp開發微信小程序,從構建到上線

数据分析系统的设计与实现

见微知著,细节上雕花:SVG生成矢量格式网站图标(Favicon)探究

Station B executives interpret the financial report: the epidemic has no impact on the company's long-term development, and the video trend is irresistible

How to play seek tiger, which has attracted much attention in the market?

深度剖析「圈組」關系系統設計 | 「圈組」技術系列文章

腾讯面试官分享面试经验,如何考察面试者技术及个人综合素质,给正在面试的你一点建议

Oauth2的理解

North China pushed Yale hard, MIT won the first place in a row, and the latest 2023qs world university ranking was released

C语言简易版webserver
随机推荐
Lippon instrument software intern interview
老虎国际季报图解:营收5263万美元 持续国际化布局
浅析分布式系统之体系结构-事务与隔离级别(多对象、多操作)下篇
回溯法/解空间树 排列树
3年亏损136亿,上市能救活威马吗?
Exporting data using mysqldump
North China pushed Yale hard, MIT won the first place in a row, and the latest 2023qs world university ranking was released
Nomad application layout scheme 04 of hashicopy (scaling and updating a job)
Nexus of repository manager
深度剖析「圈组」关系系统设计 | 「圈组」技术系列文章
Determine whether a string contains the specified string (verified)
Illustration of tiger international quarterly report: revenue of USD 52.63 million continued to be internationalized
Leetcode daily question - plus one
英伟达研发主管:AI 是如何改进芯片设计的?
2022质量员-市政方向-岗位技能(质量员)考试模拟100题及模拟考试
When open source meets KPI, globalization vs localization, how can the ideal and reality of open source be reconciled?
2022年湖南省安全员-C证考试练习题及在线模拟考试
Hashicopy之nomad应用编排方案03(运行一个job)
大道至簡 | 設計 ViT 到底怎麼配置Self-Attention才是最合理的?
汤峥嵘:CTO 是商业思维和技术思维交汇的那个点