当前位置:网站首页>Interpretation of opentelemetry project
Interpretation of opentelemetry project
2022-06-23 21:52:00 【Duncan_】
As distributed applications become more and more common , Distributed applications need to rely on powerful observability facilities to provide monitoring support , Strong observability facilities need to rely on high-quality telemetry data . There are many open source monitoring solutions or telemetry providers . But in the absence of uniform standards , The compatibility of telemetry data collected is poor , The maintenance and monitoring client also brings a heavy burden to users .
Opentelemetry It can provide developers with a unified , Telemetry data acquisition scheme independent of the third party , To solve the above problems .
Origin
Opentelemetry From the OpenTracing And OpenCensus The merger of the two open source communities .OpenTracing stay 2016 Year by year Ben Sigelman launch , Designed to address open source Tracing Realize repeated development and monitoring client , Data models are not uniform , Tracing The high cost of back-end compatibility .OpenCensus It is from Google From internal practice , Combined with the Tracing and Metrics Open Source Toolkit for monitoring client .
Because the influence of the two open source communities is not small , There are two or more Tracing The standard itself is contrary to the purpose of community formation . So the two open source communities hit it off , Set up the OpenTelemetry.
Why
From the user's point of view , Access Tracing Monitor client , It has certain invasiveness to business code . Once connected to a supplier's monitoring client , It is difficult to switch to the monitoring client provided by other suppliers . And from Tracing From the perspective of service providers , The server should be able to handle itself Tracing Outside the data of the client , It also needs to be compatible with other suppliers Tracing Data generated by the client , Maintenance costs are getting higher . Especially when distributed applications are becoming more and more popular , As said at the beginning of the article , Opentelemetry The value of is more obvious .
Opentelemetry The project of
Opentelemetry The project is mainly divided into four parts
- Cross language specification
- collect 、 transformation 、 A tool for forwarding telemetry data Collector
- Each language monitoring client API & SDK
- Automatic monitoring of clients and third-party libraries Instrumentation & Contrib
Cross language specification
The specification covers a wide range of topics . It contains the specifications required for the internal implementation of telemetry client , It also contains the protocol specifications that need to be implemented for telemetry client and external communication .
Code warehouse :opentelemetry-specification
Specifications required for internal implementation of telemetry client , Such as monitoring the basic architecture of the client 、 Design principles , Telemetry signal (Traces/ Metrics/ Logs) With helpers (Baggage/ Context/ Propagator) Concept and model definition of , Design of classes and functions needed to realize telemetry client, etc . This part will not be introduced in detail in this paper , Can be in specification/overview.md And the corresponding folder datamodel.md/ api.md/ sdk.md Can be consulted .
The protocol specification needed to realize the communication between telemetry client and external mainly refers to OpenTelemetry Protocol ( abbreviation OTLP).OTLP yes Opentelemetry Native telemetry signaling protocol , Although in Opentelemetry Components in the project support Zipkin v2 or Jaeger Thrift Implementation of protocol format , But they are all provided in the form of third-party contribution Library . Only OTLP yes Opentelemetry Official native supported formats .
OTLP The definition of the data model is based on ProtoBuf Accomplished , If you need to implement a set, you can collect OTLP Back end service of telemetry data , Then you need to understand the content , You can refer to the code warehouse :
Code warehouse :opentelemetry-proto
collect 、 transformation 、 A tool for forwarding telemetry data Collector
stay Tracing There is a principle in practice , The telemetry data collection process needs to be orthogonal to the business logic processing . It means that the process of telemetry data collection and transmission to telemetry back-end service does not occupy the channel of business logic / Threads , Minimize the impact of the client on the original business logic .Collector It is the product of practice based on this principle .
Code warehouse :opentelemetry-collector
In terms of Architecture ,Collector There are two patterns . One is the Collector Deployed in the same host as the application ( Such as K8S Of DaemonSet), Or deploy in the same application Pod Inside ( Such as K8S Medium Sidecar), The telemetry data collected by the application , Directly through the loopback network to Collector. This model is collectively referred to as Agent Pattern .
Another model is to put Collector As an independent Middleware , The application transmits the collected telemetry data to the middleware . This pattern is called Gateway Pattern .
The two modes can be used alone , You can also combine , Only the data protocol format of the data export should be consistent with that of the data entry .
stay Collector Internal design , The inflow of a set of data 、 Handle 、 The process of outflow is called pipeline. One pipeline It is composed of three parts , They are receiver/ processor/ exporter.
- receiver
- Be responsible for monitoring and receiving telemetry data according to the corresponding protocol format , And transfer the data to one or more processor
- processor
- Be responsible for telemetry data processing , Such as discarding data , Add information , Transfer to batch processing, etc , And pass the data to the next processor Or to one or more exporter
- exporter
- Responsible for sending data to the next receiving end ( Usually telemetry backend ),exporter Can be defined simultaneously from multiple different processor Obtain telemetry data from
As can be seen from the above design ,Collector In addition to providing the ability to orthogonalize telemetry data collection with business logic processing , It also acts as an adapter for telemetry data docking and telemetry back-end .Collector You can receive otlp, zipkin, jaeger And other data in any format , And then to otlp, zipkin, jaeger Wait for data in any format to be forwarded . It all depends on whether the format you need to input or output has a corresponding receiver and exporter Realization . otlp The related implementations are in opentelemetry-collector Warehouse . and otlp Protocol implementation other than , You can refer to the following code warehouse .
Code warehouse :opentelemetry-collector-contrib
Each language monitoring client API & SDK
Opentelemetry Provides a basic monitoring client for each language API & SDK package . These bags are generally based on opentelemetry-specification The suggestions and definitions , And combining the characteristics of the language itself , The basic ability of collecting telemetry data at the client is realized . Such as metadata in the service room 、 Transfer between processes ,Trace Add monitoring and data export ,Metrics The creation of indicators 、 Use and data export . The following is the language monitoring client API & SDK Code warehouse table corresponding to package .
Language | Warehouse address |
|---|---|
C++ | |
.NET | |
Erlang | |
Golang | |
Java | |
javaScript | |
PHP | |
Python | |
Ruby | |
Rust | |
Swift |
according to Opentelemetry Project planning ,2021 Most components were completed in the first half of the year Tracing Support for . At the current point in time (2021 year 12 month ) Look at ,C++/.NET/Golang/Java/Javascript/Python/Ruby Monitor client pair Tracing Support has entered Stable state . Erlang/Rust/Swift Monitor client pair Tracing Support is entering Beta Testing phase .
and Opentelemetry Project planning for Mertics Your support is later . Hope that in 2021 In the second half of the year, most components can be completed Metrics Support for . Judging from the current situation , Each language client package is for Metrics Support is still in Alpha Testing phase . And for Logs Support for , The plan is to 2022 Year begins .
Instrumentation & Contrib
If you simply use the monitoring client API & SDK package , Many operations need to modify the application code . Such as adding Tracing Monitoring point , Record field information , Metadata is in process / Packing and unpacking delivered between services . This approach is code intrusive , Not easy to decouple , And the operation cost is high , Increase the threshold for users . At this time, the design patterns or language features of common components can be used to reduce the user's threshold .
Design patterns that leverage common components , For example, in Golang Of Gin Components , Realized Middleware Responsibility chain design pattern . We can quote github.com/gin-gonic/gin library , Create a otelgin.Middleware, Manually add to Middleware In the chain , Realization Gin Rapid monitoring of .
Using language features , for example Java Use Java Agent Ability and bytebuddy Bytecode weaving technology , stay Java Find the corresponding classes and methods before the application starts , Modify bytecode injection monitoring , Realize the automatic monitoring of the specified class .
In theory , Fast monitoring depends on the client API & SDK, Automatic monitoring relies on rapid monitoring . But the actual operation did not follow the theory . Such as Java Language use Java Agent And bytebuddy Technology can realize the automatic monitoring of specified open source components , So there is no separate rapid monitoring ( stay OpenTracing There are separate ).
Language | Rapid monitoring | automatic monitoring |
|---|---|---|
Python | ||
javaScript | ||
Ruby | ||
Java | (x) | |
Golang | (x) | |
.NET | ||
Erlang | ||
Rust | ||
Swift |
summary
Opentelemetry Our mission is to achieve high-quality collection 、 large-scale 、 Portable telemetry data , Make effective observability facilities possible . It itself does not provide a complete observability solution , Instead, it provides a unified telemetry data acquisition scheme . If it is necessary to build a complete set of observability facilities , It also needs to be matched with the corresponding monitoring backend for data persistence and data query , Such as Tracing Back end zipkin/jaeger/tempo/,metrics Back end prometheus,logs Back end loki etc. .
边栏推荐
- Modify jar package
- The 11th Blue Bridge Cup
- Make it simple. This wave of global topology is quite acceptable!
- v-chart
- TDD开发模式推荐流程
- Teach you to turn the web page into Exe file (super simple)
- Explain the rainbow ingress universal domain name resolution mechanism
- How to make a label for an electric fan
- Experiment 5 module, package and Library
- HR SaaS is finally on the rise
猜你喜欢

Find My资讯|苹果可能会推出第二代AirTag,试试伦茨科技Find My方案

How to calculate individual income tax? You know what?

智能座舱SoC竞争升级,国产7nm芯片迎来重要突破

Intel openvino tool suite advanced course & experiment operation record and learning summary
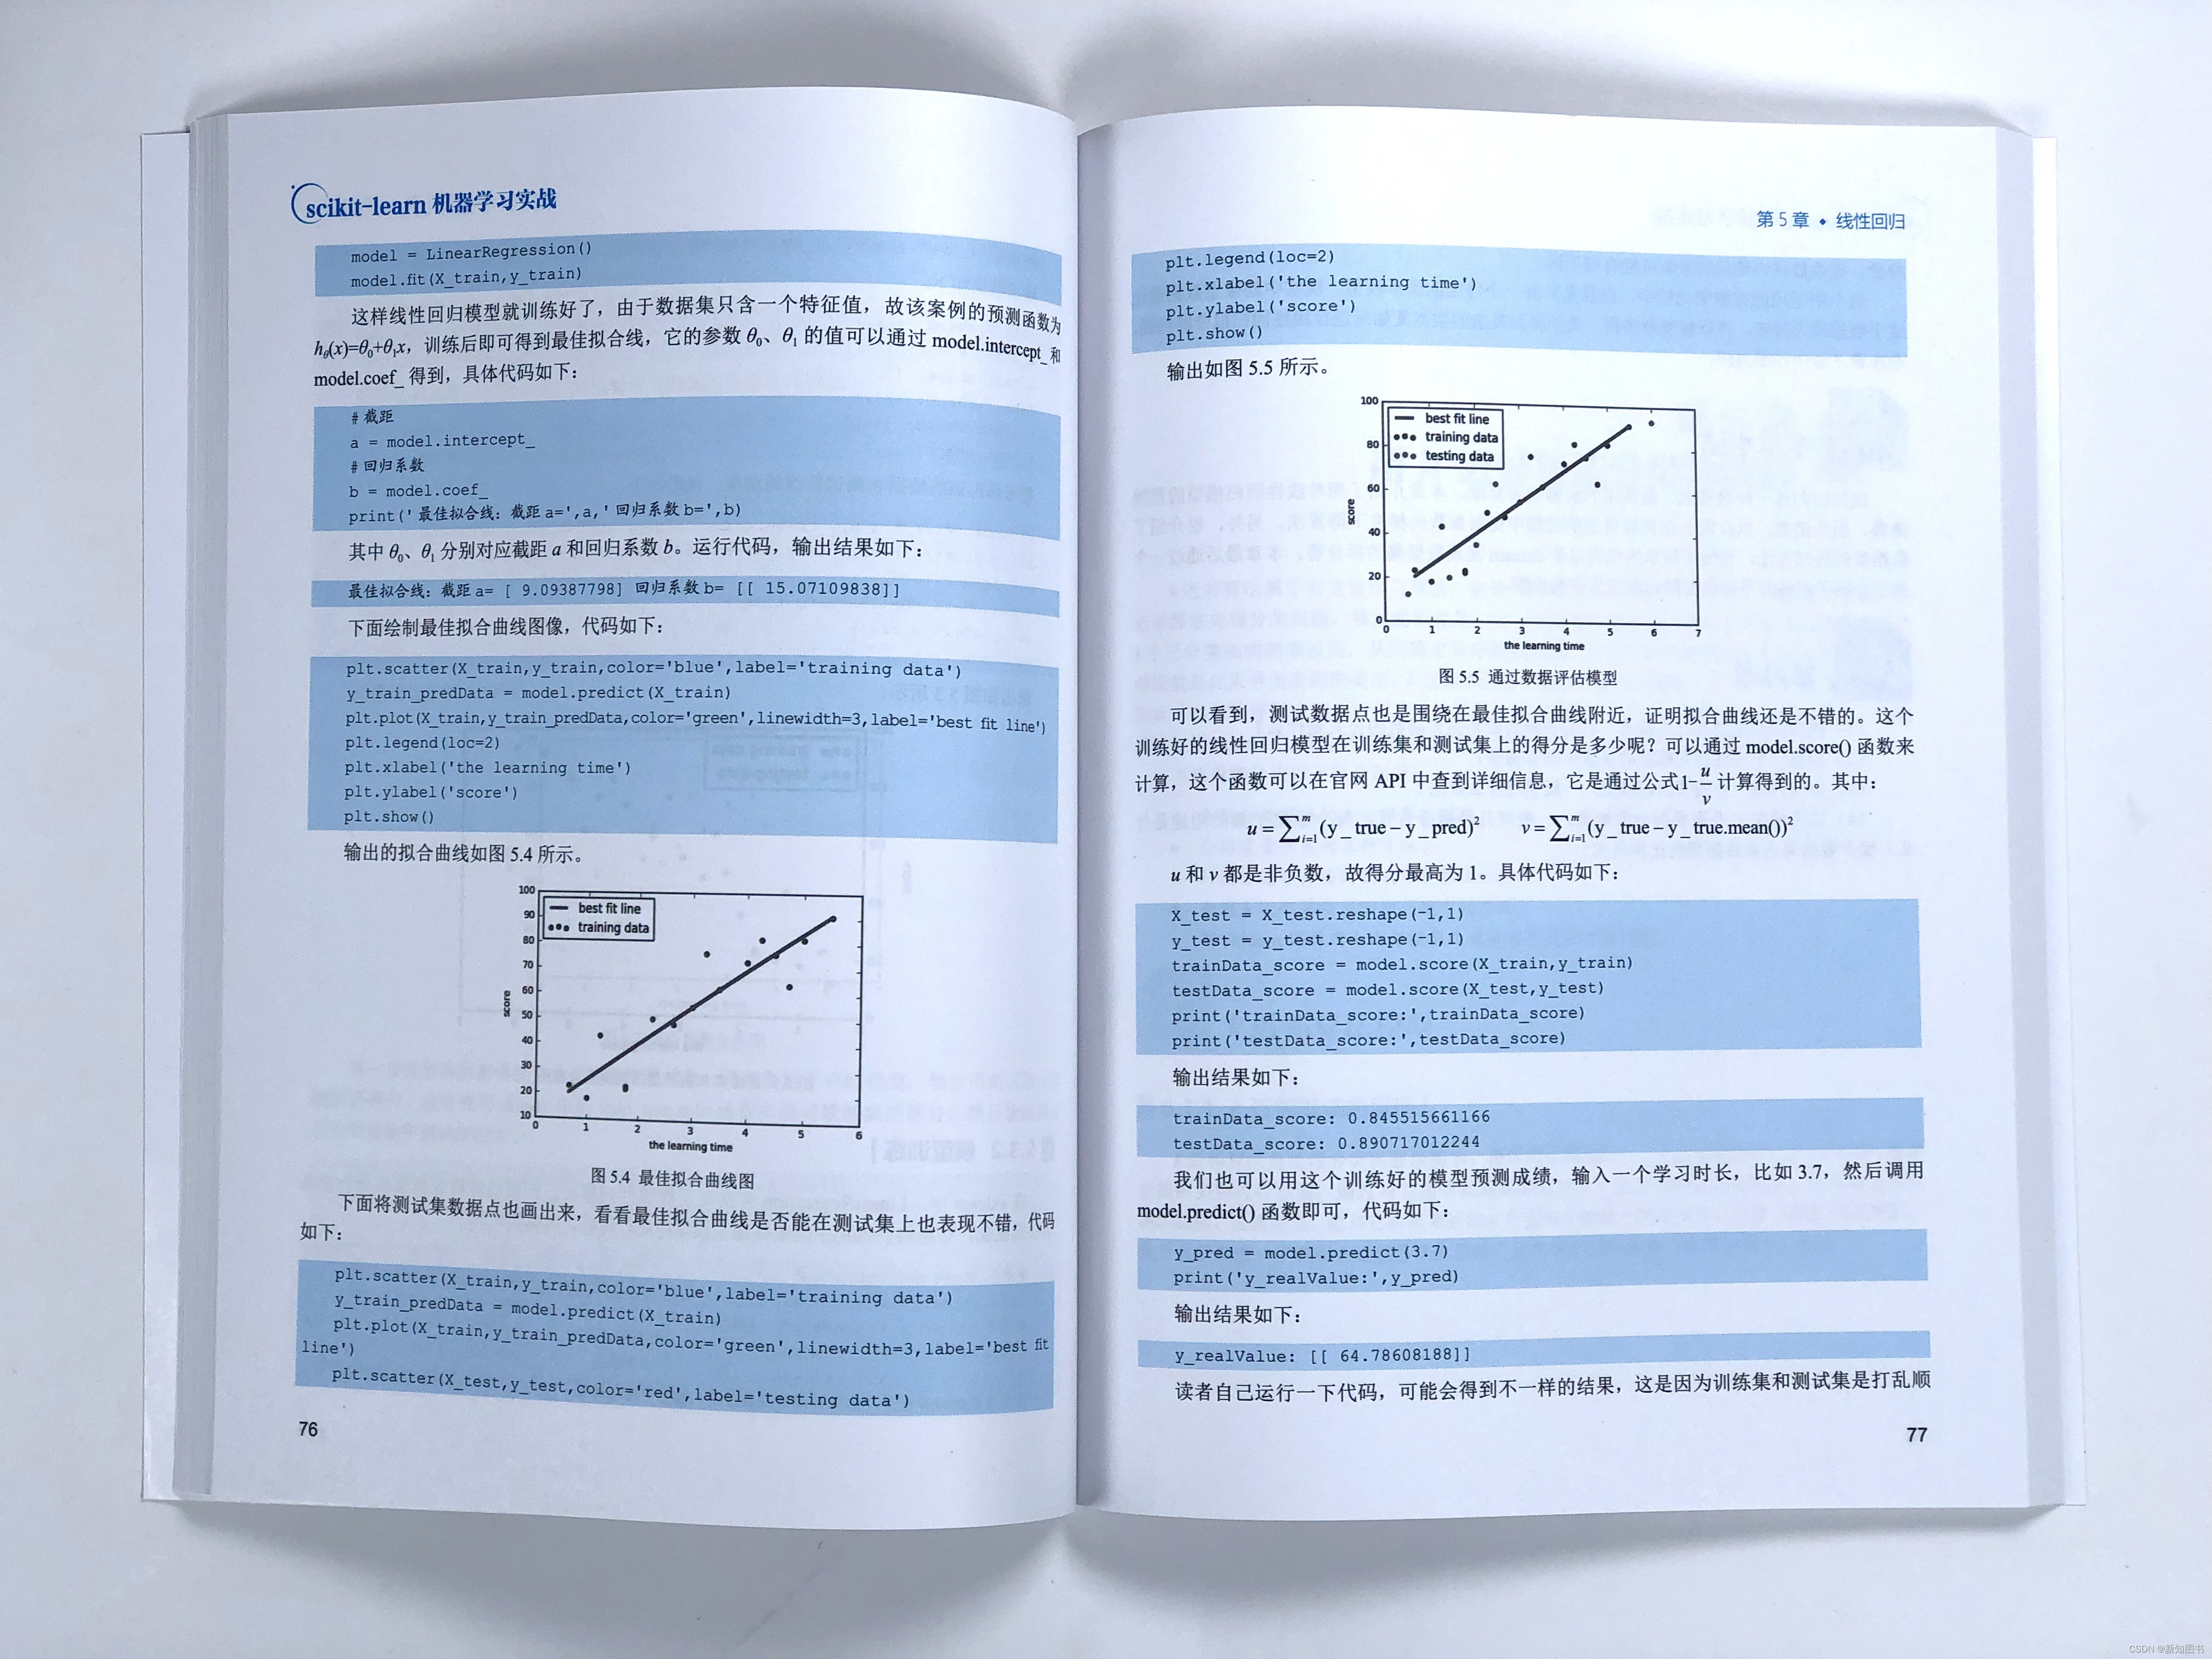
《scikit-learn机器学习实战》简介

Selenium batch query athletes' technical grades
Smart cockpit SOC competition upgraded, and domestic 7Nm chips ushered in an important breakthrough

Cloud native practice of meituan cluster scheduling system

Leetcode must review six lintcode (28348455116385)
ACL2022 | MVR:面向开放域检索的多视角文档表征
随机推荐
股票开户要找谁?网上开户安全么?
What causes the applet SSL certificate to expire? How to solve the problem when the applet SSL certificate expires?
How to use zero to build a computer room
HDLBits->Circuits->Arithmetic Circuitd->3-bit binary adder
How to improve the content quality of short video, these four elements must be achieved
Analysis of visual analysis technology
Surprise! Edge computing will replace cloud computing??
High quality "climbing hand" of course, you have to climb a "high quality" wallpaper
How to realize batch generation of serial number QR code
Troubleshooting the problem that the channel cannot play after easycvr cascades to the upper platform
Take you through the distributed file system
How do I clean the ECS hard disk? Why do I clean the hard disk regularly?
2021-12-22: palindrome substring. Give you a string s, please count and return
Selenium batch query athletes' technical grades
Analysis of a series a e-commerce app docommandnative
What about the cloud disk service status error? How to format the cloud disk service?
Selenium批量查询运动员技术等级
How to write test cases efficiently?
Open source C # WPF control library ---newbeecoder UI drop down box
Real time crawler launches a number of special new products