当前位置:网站首页>pybullet机器人仿真环境搭建 5.机器人位姿可视化
pybullet机器人仿真环境搭建 5.机器人位姿可视化
2022-06-26 16:05:00 【RuiH.AI】
前言
本篇记录一下如何在pybullet中可视化机器人的位姿。
在仿真环境中画线
pybullet提供了在仿真环境中添加点线文本的api,比如addUserDebugLine, addUserDebugPoints等,并返回这些点线的id,可用于后续的删除修改。
这里我写了一个画物体坐标系的函数,来可视化位姿,代码应该很容易懂:
def draw_pose_in_pybullet(*pose):
    """ *Draw pose frame in pybullet* :param pose: np.ndarray, shape=[4, 4] or tuple of (position, orientation) """
    if len(pose) == 1:
        position = pose[0][:3, 3]
        rotation = pose[0][:3, :3]
    else:
        position, orientation = pose
        print(orientation)
        rotation = np.array(p.getMatrixFromQuaternion(orientation)).reshape([3, 3])
        print(rotation)
    start_point = position
    end_point_x = position + rotation[:, 0] * 2
    end_point_y = position + rotation[:, 1] * 2
    end_point_z = position + rotation[:, 2] * 2
    p.addUserDebugLine(start_point, end_point_x, [1, 0, 0])
    p.addUserDebugLine(start_point, end_point_y, [0, 1, 0])
    p.addUserDebugLine(start_point, end_point_z, [0, 0, 1])
代码例程
把上面的函数与上一篇pybullet环境的博客结合,给出机器人当前的位姿:
import time

import numpy as np
import pybullet
import pybullet_data


def draw_pose_in_pybullet(*pose):
    """ *Draw pose frame in pybullet* :param pose: np.ndarray, shape=[4, 4] or tuple of (position, orientation) """
    if len(pose) == 1:
        position = pose[0][:3, 3]
        rotation = pose[0][:3, :3]
    else:
        position, orientation = pose
        print(orientation)
        rotation = np.array(pybullet.getMatrixFromQuaternion(orientation)).reshape([3, 3])
        print(rotation)
    start_point = position
    end_point_x = position + rotation[:, 0] * 2
    end_point_y = position + rotation[:, 1] * 2
    end_point_z = position + rotation[:, 2] * 2
    pybullet.addUserDebugLine(start_point, end_point_x, [1, 0, 0])
    pybullet.addUserDebugLine(start_point, end_point_y, [0, 1, 0])
    pybullet.addUserDebugLine(start_point, end_point_z, [0, 0, 1])


if __name__ == '__main__':
    client = pybullet.connect(pybullet.GUI)
    pybullet.setAdditionalSearchPath(pybullet_data.getDataPath())
    pybullet.setPhysicsEngineParameter(numSolverIterations=10)
    pybullet.configureDebugVisualizer(pybullet.COV_ENABLE_RENDERING, 0)
    pybullet.configureDebugVisualizer(pybullet.COV_ENABLE_GUI, 0)
    pybullet.configureDebugVisualizer(pybullet.COV_ENABLE_TINY_RENDERER, 0)

    pybullet.setGravity(0, 0, -9.8)
    # pybullet.setRealTimeSimulation(1)

    shift = [0, 0, 0]
    scale = [1, 1, 1]

    visual_shape_id = pybullet.createVisualShape(
        shapeType=pybullet.GEOM_MESH,
        fileName="sphere_smooth.obj",
        rgbaColor=[1, 1, 1, 1],
        specularColor=[0.4, 0.4, 0],
        visualFramePosition=[0, 0, 0],
        meshScale=scale)
    collision_shape_id = pybullet.createCollisionShape(
        shapeType=pybullet.GEOM_MESH,
        fileName="sphere_smooth.obj",
        collisionFramePosition=[0, 0, 0],
        meshScale=scale)
    pybullet.createMultiBody(
        baseMass=1,
        baseCollisionShapeIndex=collision_shape_id,
        baseVisualShapeIndex=visual_shape_id,
        basePosition=[-2, -1, 1],
        useMaximalCoordinates=True)

    plane_id = pybullet.loadURDF("plane100.urdf", useMaximalCoordinates=True)
    cube_ind = pybullet.loadURDF('cube.urdf', (3, 1, 1), pybullet.getQuaternionFromEuler([0, 0, 0]))
    r_ind = pybullet.loadURDF('r2d2.urdf', (1, 1, 1),  pybullet.getQuaternionFromEuler([0, 0, 1.57]))
    # 创建结束,重新开启渲染
    pybullet.configureDebugVisualizer(pybullet.COV_ENABLE_RENDERING, 1)

    num_joints = pybullet.getNumJoints(r_ind)
    # 获得各关节的信息
    joint_infos = []
    for i in range(num_joints):
        joint_info = pybullet.getJointInfo(r_ind, i)
        if joint_info[2] != pybullet.JOINT_FIXED:
            if 'wheel' in str(joint_info[1]):
                print(joint_info)
                joint_infos.append(joint_info)

    maxforce = 10
    velocity = 31.4
    while True:
        pybullet.removeAllUserDebugItems() # 把之前的线删除,否则会一直在仿真环境中出现
        for i in range(len(joint_infos)):
            pybullet.setJointMotorControl2(bodyUniqueId=r_ind,
                                           jointIndex=joint_infos[i][0],
                                           controlMode=pybullet.VELOCITY_CONTROL,
                                           targetVelocity=velocity,
                                           force=maxforce)
        position, orientation = pybullet.getBasePositionAndOrientation(r_ind)
        draw_pose_in_pybullet(position, orientation)
        pybullet.stepSimulation()
        time.sleep(1./240)
可视化效果如下:
需要注意,画线操作和删除线操作都会严重影响pybullet引擎的运行速度,实际感觉一卡一卡的。
边栏推荐
- 手写数字体识别,用保存的模型跑自己的图片
- R语言plotly可视化:小提琴图、多分类变量小提琴图、分组(grouped)小提琴图、分裂的分组小提琴图、每个小提琴图内部分为两组数据、每个分组占小提琴图的一半、自定义小提琴图的调色板、抖动数据点
- Acid of redis
- Big talk Domain Driven Design -- presentation layer and others
- 基于STM32+华为云IOT设计的云平台监控系统
- NFT合约基础知识讲解
- R language generalized linear model function GLM, GLM function to build logistic regression model, analyze whether the model is over discrete, and use the ratio of residual deviation and residual degr
- 5 模型保存与加载
- 【力扣刷题】单调栈:84. 柱状图中最大的矩形
- Svg animation around the earth JS special effects
猜你喜欢

STEPN 新手入门及进阶
基于STM32+华为云IOT设计的云平台监控系统

Everyone is a scientist free gas experience Mint love crash

How to implement interface current limiting?
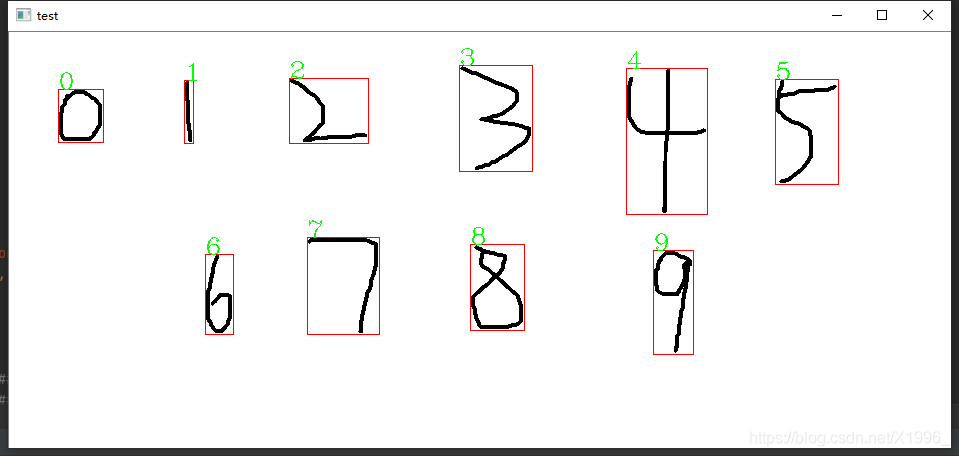
手写数字体识别,用保存的模型跑自己的图片
What is the difference between stm32f1 and gd32f1?

Svg savage animation code

对话长安马自达高层,全新产品将在Q4发布,空间与智能领跑日系
Stepn novice introduction and advanced

『C语言』题集 of ⑩
随机推荐
人人都当科学家之免Gas体验mint爱死机
心情不好,我就这样写代码
C. Inversion Graph
JS教程之使用 ElectronJS 桌面应用程序打印贴纸/标签
Panoramic analysis of upstream, middle and downstream industrial chain of "dry goods" NFT
MHA switching (recommended operation process)
Acid of redis
Practice of federal learning in Tencent micro vision advertising
理想路径问题
100+数据科学面试问题和答案总结 - 基础知识和数据分析
C# 读写文件从用户态切到内核态,到底是个什么流程?
Net基于girdview控件实现删除与编辑行数据
网页课程设计大作业——华山旅游网
TCP拥塞控制详解 | 1. 概述
[time complexity and space complexity]
I want to know how to open an account through online stock? Is online account opening safe?
【力扣刷题】11.盛最多水的容器//42.接雨水
(1) Keras handwritten numeral recognition and recognition of self written numbers
Ideal path problem
油田勘探问题