当前位置:网站首页>Burndown chart of project management tools: Dynamic assessment of team work ability
Burndown chart of project management tools: Dynamic assessment of team work ability
2022-07-31 09:48:00 【LCDPyyds】
The burn down chart, English is Burn down Chart, was created by the "father of Scrum" Ken Schwaber and first described it, so he is also considered to be the inventor of the burn down chart.From the earliest days, the burndown chart was positioned as a simple tool for Scrum teams to help them map the progress of their projects. As the burndown chart became more and more popular in the Scrum community, it began to be used in other areas outside scrum.Be a useful tool for managers to control the progress of projects.
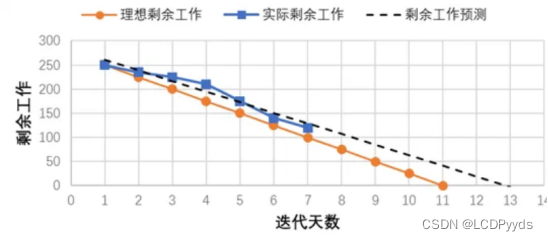
The burnout of the burndown chart means that with the gradual completion of the work item, the overall work task is gradually burned to 0 like burning ashes, which is a visual display of the completion progress of the workload.A burndown chart consists of a horizontal axis and a vertical axis. As the remaining work is gradually completed, the chart has a downward curve until it drops to 0.The horizontal axis is the date from implementation to completion of the project, and the vertical axis is the number of work items.
For managers, by looking at the completion of the iteration within a period of time, when the curve of "actual remaining work" fluctuates up and down, they can find out how many new work items have been added or how much has been reduced after the implementation of the iteration.Work items can further find out the reasons for adding and reducing work items, so as to judge whether the project is risky, whether it needs to be adjusted in time, and whether the delivery of the project on the deadline is guaranteed. The burndown chart can help managers make timely decisions..At the same time, managers can judge the workload and project completion of the team and individual through a burndown chart, and how much the actual work situation deviates from the ideal plan.
In the project management of agile development, the burndown chart has gained more space for display, from simple task completion estimation, to observation and assessment in the project, to see the work of project team membersThe capacity and the corresponding workload, the burndown chart has also been promoted to a more important position.
In many project management tools at home and abroad, burndown charts are often seen, such as Report in Jira's Agile component, that is, burndown charts are used as a common tool for managing R&D projects.The project management software UniPro can also automatically generate burndown charts in the dashboard by selecting projects, viewing types, work item types, time accuracy, etc., which is characterized by complementing Gantt charts that cannot capture the lack of fluidity in project schedule execution, which provides employees and managers with a visual representation of team or individual project progress, helping to identify problems and improve team and individual execution.
边栏推荐
猜你喜欢


随机推荐
Andoird开发--指南针(基于手机传感器)
UE4插件软链接(关联)
Mysql+Navicat for Mysql
js部门预算和支出雷达图
生成随机数
【软考软件评测师】2012综合知识历年真题
[ verb phrase ] collection
第五章
GVINS论文阅读笔记
【Redis高手修炼之路】Jedis——Jedis的基本使用
loadrunner脚本--添加事务
MySQL 高级(进阶) SQL 语句 (一)
NowCoderTOP23-27二叉树遍历——持续更新ing
(C语言)程序环境和预处理
湖仓一体电商项目(二):项目使用技术及版本和基础环境准备
SQLite3交叉编译
loadrunner-controller-场景执行run
qt在不同的线程中传递自定义结构体参数
js右侧圆点单页滚动介绍页面
安装gnome-screenshot截图工具