当前位置:网站首页>How does factor analysis calculate weights?
How does factor analysis calculate weights?
2022-07-01 18:37:00 【spssau】

One 、 Case description
Case background and research purpose
Study the weight of different dimensions of short video platform , The investigation collected 200 Data, of which 20 Items can be divided into brand activities , Brand spokesperson , Social responsibility , Five dimensions of brand sponsorship and purchase intention . The case data also includes basic individual characteristics such as gender 、 Age , Education , Monthly income, etc . And the viewing and consumption of short video platforms . The data sample is 200 individual .
Want to conduct factor analysis based on the data surveyed by the short video platform , The relationship between the judgment factor and the measurement item gets the corresponding dimension , For the secondary index, the entropy method is used to calculate the weight , The weight of primary indicators is calculated from the corresponding dimensions obtained by factor analysis , Final summary .
Two 、SPSSAU operation
Because the default dimension of the case is 5 So drag the analysis item to the right analysis box , The number of drop-down selection factors is 5. This case uses factor analysis to calculate the weight , So you don't need to check it “ Factor analysis ” And “ Comprehensive score ”.

SPSSAU
3、 ... and 、 Factor analysis results
1.KMO Value and Bartlete Spherical test
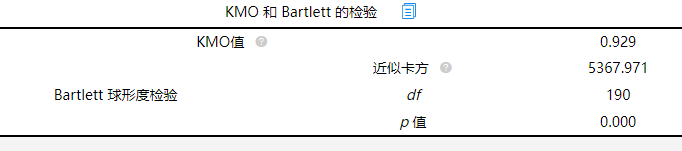
Using factor analysis for information enrichment research , First, analyze whether the research data is suitable for factor analysis , As can be seen from the table above :KMO The value is 0.929, Greater than 0.6, Meet the prerequisite requirements of factor analysis , It means that the data can be used for factor analysis research . And data through Bartlett Sphericity test (p<0.05), It shows that the research data is suitable for factor analysis . Next, check whether the analysis item needs to be adjusted .
2. The relationship between the factor and the measured item
Factor analysis for factor concentration , It usually goes through multiple cycles , Delete unreasonable items , And repeat the cycle many times , Finally, a reasonable result . Generally, there are two kinds of situations , One is “ the wrong person ”, One is “ become entangled in ”, The details are as follows .
(1)“ the wrong person ”
In general , If 20 Item and 5 The corresponding relationship between the factors , Inconsistent with professional knowledge , For example, the first item should belong to the second factor but be divided under the first factor , In this case, it indicates that the item should be deleted , It appears ‘ the wrong person ’ The phenomenon . For example, in the case of “ Purchase intention 1” and “ Purchase intention 4”.

(2)“ become entangled in ”
except “ the wrong person ” The phenomenon , Sometimes there will be ‘ become entangled in ’ The phenomenon , For example, in the case of “ Brand sponsorship 4” Can be attributed to factors 2, It can also be attributed to factors 4, This is more normal ( Referred to as ‘ become entangled in ’), It needs to be handled in combination with the actual situation , This item can be deleted , You can also not delete , At this time , Analysis is somewhat subjective .

Step1: The first analysis
This example contains 20 Analysis items , this 20 The analysis items are divided into 5 Dimensions , Therefore, you can take the initiative to tell SPSSAU, this 20 The term is five factors , otherwise SPSSAU Will automatically determine how many factors ( Usually, the automatic judgment of software is quite different from the actual situation , Therefore, it is recommended to actively set the number of factors ). Here's the picture :

As can be seen from the above figure :
Brand events 1-4 this 4 term , They all correspond to factors 1, The values of factor load coefficients are higher than 0.4, Illustrate this 4 Items should belong to the same dimension , That is, logically, brand activities 1-4 this 4 term , It didn't show up “ the wrong person ” The phenomenon .4 The values of analysis items belong to factors 1 None of the dimensions appear “ become entangled in ” The situation of .
Brand spokesperson 1-4 common 4 term , They all correspond to factors 1, But the brand spokesperson 3、 Brand spokesperson 4 At the same time, it belongs to the factor 3, Belong to “ become entangled in ”, Not to deal with temporarily .
“ Social responsibility 1-4” common 4 term , this 4 Each term corresponds to a factor 1 Or factor 3, this 3 Item does not appear ‘ the wrong person ’ problem , But there was “ become entangled in ”.
“ Brand sponsorship 1-4” common 4 term , They all correspond to factors 2,“ Brand sponsorship 4” It corresponds to the factor 2 And corresponding factor 4 There is “ become entangled in ”, Attention should be paid to .
“ Purchase intention 1-4” Four items in total , When they correspond to factors 4 be “ Purchase intention 1” appear “ the wrong person ” If the corresponding factor 5 be “ Purchase intention 4” appear “ the wrong person ”.
Summing up the above analysis, we can see :“ Purchase intention 1” perhaps “ Purchase intention 4” These two items appear “ the wrong person ”, One of these two items should be deleted first ; And others appear “ become entangled in ” Phenomenal , Do not deal with ( Just pay attention ). This time “ Purchase intention 1” Re analyze after deletion ( take “ Purchase intention 4” Deletion is also possible , It is up to the researcher to decide ).
Step2: The second analysis
take “ Purchase intention 1” After this item is deleted , Conduct a second analysis . give the result as follows :

It can be seen from the figure above “ Brand spokesperson 3”、“ Brand spokesperson 4” appear ‘ the wrong person ’ The phenomenon , Should delete , as well as “ Brand events 1-4”、“ Brand spokesperson 1-2” Etc ‘ become entangled in ’ The phenomenon , Not to deal with temporarily , But attention should be paid . Summing up : Should be “ Brand spokesperson 3”、“ Brand spokesperson 4” Delete it first and then proceed to the... Again 3 dimensional analysis .
Step3: The third analysis
take “ Brand spokesperson 3”、“ Brand spokesperson 4” After deletion, the analysis results are as follows :

It can be seen from the figure above
“ Brand spokesperson 1-2” Can also appear in factors 1 Sum factor 5 below , But considering the factors 5 Currently, only 2 term , Therefore, it means that it is acceptable , as well as “ Social responsibility 1-4” It's the same , Finally, find five factors , The correspondence between them and items is good . End of factor analysis .
3. The result after adjusting the factor
Because this case analysis focuses on the use of factor analysis to calculate weights, so for factor extraction 、 The results of information enrichment will be briefly described , If you want detailed analysis results, please log in SPSSAU Upload data for analysis .
4. Factor extraction and information enrichment
(1) Factor extraction

The above table is for factor extraction , And analyze the information extracted by factors , It can be seen from the above table that : Factor analysis extracted 5 A factor , this 5 The variance interpretation rates after the rotation of the factors are 26.400%,21.703%,19.013%,15.359%,7.087%, The interpretation rate of cumulative variance after rotation is 89.563%. There is no fixed standard for the cumulative variance interpretation rate , Generally more than 60% All acceptable .

(2) Information enrichment
Load factor table after rotation


factor 1 Brand events ; factor 2 Brand sponsorship ; factor 3 Social responsibility ; factor 4 Purchase intention , factor 5 There is a higher load on , They mainly reflect the audience of the spokesperson used by a brand on the short video platform, which is the brand spokesperson . Use the variance interpretation rate after rotation to calculate the weight of five primary indicators :

The weight of each dimension is normalized by the variance interpretation rate after rotation : factor 1 The weight :0.264/0.896=0.295 factor 2 The weight :0.217/0.896=0.242: factor 3 The weight :0.190/0.896=0.212, factor 4 The weight 0.154/0.896=0.172, factor 5 The weight 0.071/0.896=0.079.
Here we are , End of factor analysis , The purpose of the above factor analysis is to judge the relationship between factors and measurement items , Repeat the analysis , Delete the analysis items that do not meet the analysis , Describe the corresponding five dimensions , Use the variance interpretation rate after rotation to calculate the weight of five primary indicators . Next use SPSSAU Calculate the weight of secondary indicators by entropy method, and then calculate the final weight .
Four 、 Calculation of secondary index weight
1. Secondary index weight results
Factor analysis will determine the final 17 Two secondary indicators are used SPSSAU Entropy method , because 17 Item is an index under five dimensions, so repeat the entropy analysis five times , Get the weight of the secondary indicators of brand activities as follows :

Use entropy method to analyze brand activities 1 Wait a total 4 Item for weight calculation , As can be seen from the table above : Brand events 1, Brand events 2, Brand events 3, Brand events 4 in total 4 term , Their weight values are 0.247, 0.266, 0.235, 0.252. And the weight of each item is relatively uniform , Both in 0.250 near .
The weight of brand sponsorship secondary indicators is as follows :

Use entropy method to sponsor brands 1 Wait a total 4 Item for weight calculation , As can be seen from the table above : Brand sponsorship 1, Brand sponsorship 2, Brand sponsorship 3, Brand sponsorship 4 in total 4 term , Their weight values are 0.225, 0.237, 0.271, 0.267. And the weight of each item is relatively uniform , Both in 0.250 near .
The weight of secondary indicators of social responsibility is as follows :

The analysis results come from SPSSAU
Use entropy method for social responsibility 1 Wait a total 4 Item for weight calculation , As can be seen from the table above : Social responsibility 1, Social responsibility 2, Social responsibility 3, Social responsibility 4 in total 4 term , Their weight values are 0.254, 0.256, 0.224, 0.265. And the weight of each item is relatively uniform , Both in 0.250 near .
The weight of the brand spokesperson's secondary indicators is as follows :

Use entropy method to analyze brand spokesperson 1 Wait a total 2 Item for weight calculation , As can be seen from the table above : Brand spokesperson 1, Brand spokesperson 2 in total 2 term , Their weight values are 0.490, 0.510. And the weight of each item is relatively uniform , Both in 0.500 near .
The weights of secondary indicators of purchase intention are as follows :

The analysis results come from SPSSAU
Use the entropy method to measure the purchase intention 2 Wait a total 3 Item for weight calculation , As can be seen from the table above : Purchase intention 2, Purchase intention 3, Purchase intention 4 in total 3 term , Their weight values are 0.327, 0.340, 0.332. And the weight of each item is relatively uniform , Both in 0.333 near .
To sum up, you can get brand sponsorship 、 Social responsibility 、 Brand spokesperson 、 The weights of brand activities and purchase intention are 0.242、0.212、0.079、0.295 as well as 0.172. Sort out the primary and secondary indicators as follows and calculate the corresponding final weight .
2. Final weight result

such as , The weights of the first level indicators are calculated as 0.242、0.212、0.079、0.295 as well as 0.172. Second level indicator purchase intention 2 The weight of 0.327, Then purchase intention 2 The final weight value is 0.172*0.327=0.06. According to the weight results, it can be found that the weight distribution of each primary index is uniform , For platform short videos, you can also pay attention to users “ Brand events ”.
5、 ... and 、 summary
This case mainly uses SPSSAU Analyze and calculate the weight , The methods used include the combination of factor analysis and entropy method , Because this case uses factor analysis to calculate the weight , So you don't need to check it “ Factor analysis ” And “ Comprehensive score ”. Adjust the corresponding analysis items through the relationship between factors and measurement items , After adjustment, the result of factor analysis , The results of irrelevant weights will not be repeated , Finally, the weight of analysis items and primary indicators under the corresponding dimensions is obtained , Entropy method is used to calculate the weight of secondary indicators , Because of the five dimensions obtained from the analysis, the entropy method analysis is repeated five times , The final weight of each item is obtained by using the weight results of factor analysis and entropy method .
边栏推荐
- 540. Single element in ordered array / 1684 Count the number of consistent strings
- Pytorch crossentropyloss learning
- A database editing gadget that can edit SQLite database. SQLite database replaces fields. SQL replaces all values of a field in the database
- Batch export all pictures in PPT in one second
- 关于企业中台规划和 IT 架构微服务转型
- How to find the optimal learning rate
- C# SelfHost WebAPI (2)
- Sanfeng cloud 0215 I often use
- Convert the robot's URDF file to mujoco model
- Detailed explanation of ArrayList expansion
猜你喜欢
Blue Bridge Cup real topic: the shortest circuit
Principal component calculation weight
![[today in history] February 15: Pascal's father was born; YouTube was founded; Kotlin language comes out](/img/f3/20b73f3545cdd17b9fbc52bf493ab4.jpg)
[today in history] February 15: Pascal's father was born; YouTube was founded; Kotlin language comes out

Unity learning fourth week

Using OpenSSL encryption to rebound shell traffic

What impact will multinational encryption regulation bring to the market in 2022

The method of real-time tracking the current price of London Silver
. Net cloud native architect training camp (permission system code implements actionaccess) -- learning notes

PTA year of birth

Force buckle day33
随机推荐
1、《创建您自己的NFT集合并发布一个Web3应用程序来展示它们》什么是NFT
Mysql database of easyclick
Highly reliable program storage and startup control system based on anti fuse FPGA and QSPI flash
Xia CaoJun ffmpeg 4.3 audio and video foundation to engineering application
To improve the efficiency of office collaboration, trackup may be the best choice
How to learn automated testing?
Pytorch crossentropyloss learning
Implementation of converting PCM file to WAV
Rust language - cargo, crates io
Set the style of QT property sheet control
必看,时间序列分析
R语言ggplot2可视化:gganimate创建动态柱状图动画(gif)、在动画中沿给定维度逐步显示柱状图、enter_grow函数和enter_fade函数控制运动内插退出(渐变tweening)
. Net cloud native architect training camp (permission system code implements actionaccess) -- learning notes
Database - MySQL advanced SQL statement (I)
Leetcode-141环形链表
Highly reliable program storage and startup control system based on anti fuse FPGA and QSPI flash
Nearly 60% of the employees strongly support Ctrip's "3+2" working mode, and work at home for two days a week
Zabbix报警执行远程命令
Session layer of csframework, server and client (1)
A wonderful time to buy and sell stocks