当前位置:网站首页>CNN visualization technology -- detailed explanation of cam & grad cam and concise implementation of pytorch
CNN visualization technology -- detailed explanation of cam & grad cam and concise implementation of pytorch
2022-07-02 06:01:00 【occasionally.】
List of articles
Preface
CNN Feature visualization in can be roughly divided into two categories :
- Details :ZFNet Used in deconvolution, The improved guide backpropagation
- The importance of information : Class activation graph (CAM), The improved Grad-CAM
The first method only shows what information is retained in the deep features , The relative importance of this information is not highlighted . The second kind of method has certain explanatory , For example, in classification tasks , adopt CAM It can explain what information the model focuses on to judge the category .
1. CAM(Class Activation Map)
Network in Network Global average pooling is proposed in (GAP) Replace the full connection layer with Strengthen the connection between feature mapping and categories , More explicable . Inspired by this idea ,CAM Visualization technology should be shipped . Generate CAM The process is shown in the figure below ( The original picture of the paper ):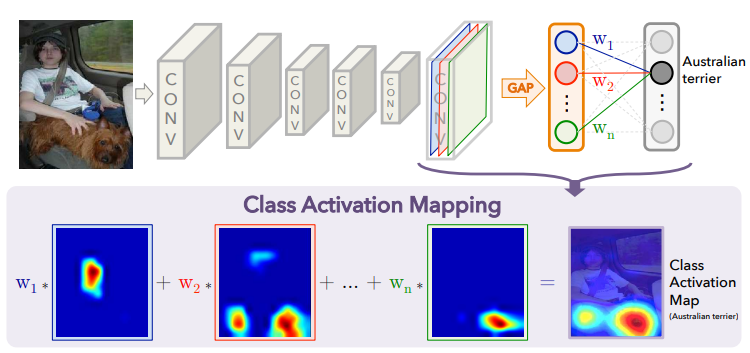
It can be seen that , Generate CAM The steps are very simple , But there are requirements for network structure ( The end of the network is GAP+FC Such a structure , also FC There is only one floor , Used to output category probability ). Suppose the classification task adopts VGG The Internet , At this time to generate CAM The steps are :
- take VGG The first two of FC Replace with GAP, Retraining ;
- Get the characteristic map of the last convolution layer output [ f 1 , f 2 , . . . , f n ] [f_1, f_2, ..., f_n] [f1,f2,...,fn], And the weight of the whole connection layer [ w 1 , w 2 , . . . , w n ] [w_1, w_2, ..., w_n] [w1,w2,...,wn];
- Calculation C A M = ∑ i = 1 n w i f i CAM=\sum_{i=1}^{n}w_if_i CAM=∑i=1nwifi
It's not hard to find out , If the network structure does not meet the requirements , Calculate according to the above method CAM Need to modify the network structure and retrain . For this problem , In the follow-up study Gard-CAM.
2. Grad-CAM
From the above CAM The calculation method of , Generate CAM The key is to obtain the weight of the feature graph . Based on the original CAM Improvement ,Grad-CAM By seeking The partial derivative of the category confidence of the network output to the characteristic graph To get the weight , Applicable to any network , And it can visualize the class activation diagram of any layer ( Usually choose the last convolution , Because it contains rich high-level semantic and spatial information ).
- Generate Grad-CAM The steps are as follows :
- Send pictures to the network , Forward propagation , Get the characteristic map of the last convolution A k A^k Ak( Optional , Any layer can , k k k For the passage index);
- Back propagation , Get the category of network output c c c Probability y c y^c yc About A k A^k Ak Gradient of ∂ y c ∂ A k \frac{\partial y^c}{\partial A^k} ∂Ak∂yc;
- Calculate weight α k c = 1 Z ∑ i ∑ j ∂ y c ∂ A i , j k \alpha^{c}_{k}=\frac{1}{Z}\sum\limits_{i}\sum\limits_{j}\frac{\partial y^c}{\partial A^k_{i,j}} αkc=Z1i∑j∑∂Ai,jk∂yc
- Calculation Grad-CAM: L G r a d − C A M c = R e L U ( ∑ k α k c A k ) L_{Grad-CAM}^{c}=ReLU(\sum\limits_{k}\alpha^{c}_{k}A^k) LGrad−CAMc=ReLU(k∑αkcAk)
- The meaning of finding partial derivatives : Reference resources Zhihu's article , The partial derivative represents the rate of change of the output with respect to the input , That is, a unit changes on the characteristic graph , How many units does the output change . It can reflect the output y c y^c yc About A i , j k A^k_{i,j} Ai,jk The sensitivity of , If the gradient is large , Is very sensitive , Indicates that the location is more likely to belong to the category c c c.
3. PyTorch Medium hook Mechanism
- PyTorch Middle design hook Purpose : Without changing the network code 、 be not in forward In the case of returning the output of a certain layer , Get the input and output of a certain layer in the network in the forward propagation or back propagation process , And carry out relevant operations ( for example : Visual feature map , Gradient cut ).
4. Grad-CAM Of PyTorch Concise implementation
import numpy as np
import torch
import cv2
import matplotlib.pyplot as plt

class GradCAM():
    ''' Grad-cam: Visual explanations from deep networks via gradient-based localization Selvaraju R R, Cogswell M, Das A, et al. https://openaccess.thecvf.com/content_iccv_2017/html/Selvaraju_Grad-CAM_Visual_Explanations_ICCV_2017_paper.html '''
    def __init__(self, model, target_layers, use_cuda=True):
        super(GradCAM).__init__()
        self.use_cuda = use_cuda
        self.model = model
        self.target_layers = target_layers

        self.target_layers.register_forward_hook(self.forward_hook)
        self.target_layers.register_full_backward_hook(self.backward_hook)

        self.activations = []
        self.grads = []

    def forward_hook(self, module, input, output):
        self.activations.append(output[0])

    def backward_hook(self, module, grad_input, grad_output):
        self.grads.append(grad_output[0].detach())

    def calculate_cam(self, model_input):
        if self.use_cuda:
            device = torch.device('cuda')
            self.model.to(device)                 # Module.to() is in-place method
            model_input = model_input.to(device)  # Tensor.to() is not a in-place method
        self.model.eval()

        # forward
        y_hat = self.model(model_input)
        max_class = np.argmax(y_hat.cpu().data.numpy(), axis=1)

        # backward
        model.zero_grad()
        y_c = y_hat[0, max_class]
        y_c.backward()

        # get activations and gradients
        activations = self.activations[0].cpu().data.numpy().squeeze()
        grads = self.grads[0].cpu().data.numpy().squeeze()

        # calculate weights
        weights = np.mean(grads.reshape(grads.shape[0], -1), axis=1)
        weights = weights.reshape(-1, 1, 1)
        cam = (weights * activations).sum(axis=0)
        cam = np.maximum(cam, 0) # ReLU
        cam = cam / cam.max()
        return max_class, cam

    def show_cam_image(self, image, cam):
        # image: [H,W,C]
        h, w = image.shape[:2]

        cam = cv2.resize(cam, (h,w))
        cam = cam / cam.max()
        heatmap = cv2.applyColorMap((255*cam).astype(np.uint8), cv2.COLORMAP_JET) # [H,W,C]

        image = image / image.max()
        heatmap = heatmap / heatmap.max()

        result = 0.4*heatmap + 0.6*image
        result = result / result.max()

        plt.figure()
        plt.imshow((result*255).astype(np.uint8))
        plt.colorbar(shrink=0.8)
        plt.tight_layout()
        plt.show()
Reference material
边栏推荐
- Page printing plug-in print js
- 数理统计与机器学习
- 1035 Password
- Gcnet: non - local Networks meet Squeeze excitation Networks and Beyond
- Oled12864 LCD screen
- Picture clipping plug-in cropper js
- uni-app开发中遇到的问题(持续更新)
- Scheme and implementation of automatic renewal of token expiration
- Comment utiliser mitmproxy
- Happy Lantern Festival | Qiming cloud invites you to guess lantern riddles
猜你喜欢

Shenji Bailian 3.52-prim
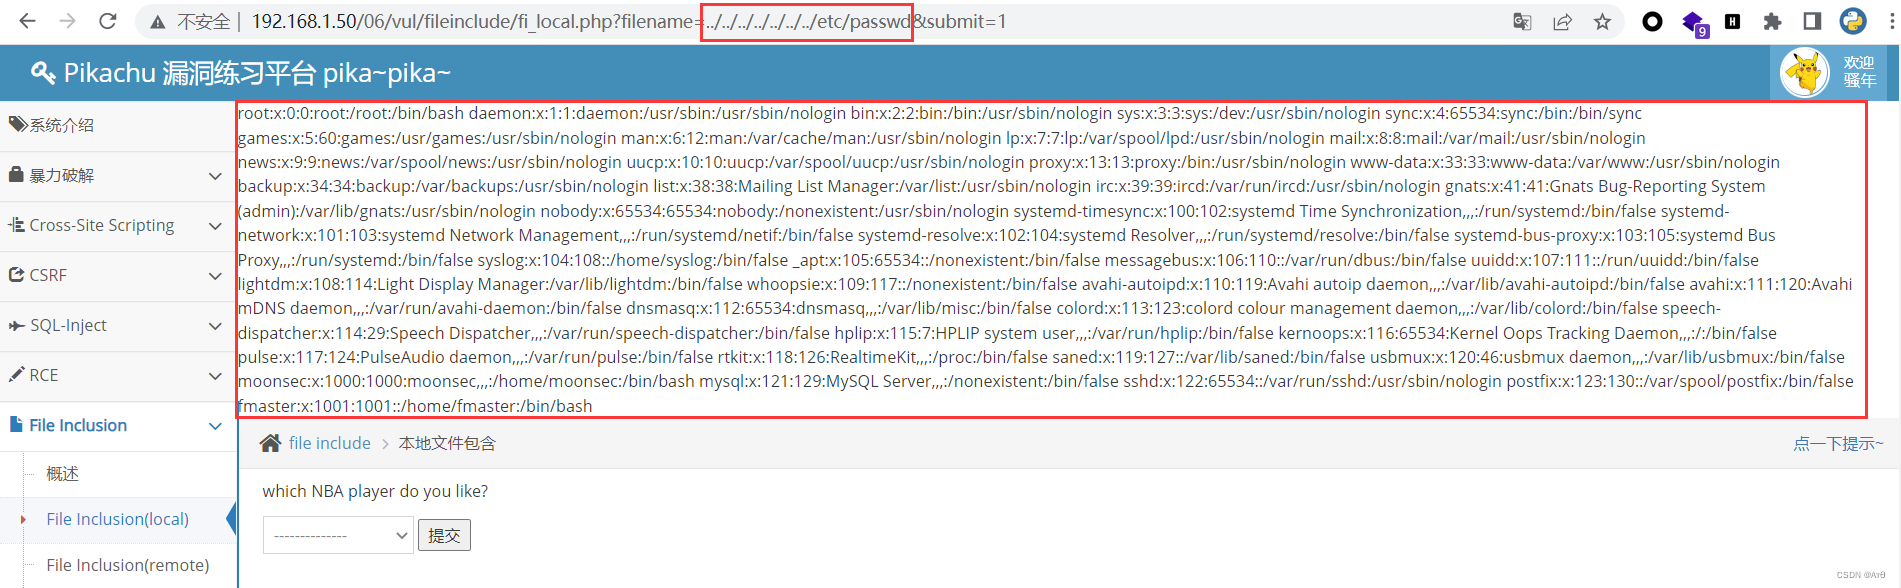
File contains vulnerability (I)
在uni-app中引入uView
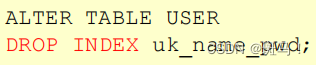
mysql的约束总结
Software testing Q & A
如何使用MITMPROXy
测试 - 用例篇
Conglin environmental protection rushes to the scientific and Technological Innovation Board: it plans to raise 2billion yuan, with an annual profit of more than 200million yuan

keepalived安装使用与快速入门

memcached安装
随机推荐
LCD之MIPI协议的一些说明
mock-用mockjs模拟后台返回数据
PHP array to XML
【LeetCode】Day92-盛最多水的容器
Servlet web XML configuration details (3.0)
cookie插件和localForage离线储存插件
Comment utiliser mitmproxy
MUI底部导航的样式修改
Stc8h8k Series Assembly and c51 Real combat - NIXIE TUBE displays ADC, Key Series port reply Key number and ADC value
Generics and generic constraints of typescript
Go language web development is very simple: use templates to separate views from logic
1035 Password
神机百炼3.52-Prim
token过期自动续费方案和实现
RGB infinite cube (advanced version)
PHP read file (read the specified line containing a string in the file)
VSCode paste image插件保存图片路径设置
步骤详解 | 助您轻松提交 Google Play 数据安全表单
神机百炼3.53-Kruskal
PHP 开发与测试 Webservice(SOAP)-Win