当前位置:网站首页>[20220605] Literature Translation -- visualization in virtual reality: a systematic review
[20220605] Literature Translation -- visualization in virtual reality: a systematic review
2022-07-01 12:25:00 【Yang SiCheng】
Visualization in virtual reality: a systematic review
- Abstract
- 1 brief introduction
- 4 Results and Analysis
- 4.1 Tools 、 Toolkits and frameworks
- 4.2 Data visualization
- 4.3 Information visualization
- 4.4 Scientific visualization
- 4.5 Collaborative virtual reality
- 4.6 Training and simulation
- 4.7 Web Virtual reality
- 4.8 game 、 Visualization and VR
- 4.9 Design considerations and user interaction
- 4.10 comparative study
- 5 Discuss
- 6 Conclusion
Abstract
In recent years , The rapid development of virtual reality (VR) Technology has received more and more attention , Scholars and practitioners have been looking for effective virtual reality visualization technology . up to now , The application of game technology has always been the focus . Although there is more and more interest and discussion in visualization research , But in 2D The transition from visualization to immersive visualization , Visualization research lacks a common baseline . So , This study aims to provide a systematic literature review , Explain the latest research and future trends of virtual reality visualization . The research framework is a visual work based on experience and theory . We describe the review literature based on three dimensions :(a) Connection with visualization background and theory ,(b) Evaluation and design considerations of virtual reality visualization , And empirical research . The results show that :(1) There is less research on the standard guiding principles of Virtual Reality Technology , And each research provides a separate framework or draws on the research results of traditional two-dimensional visualization technology ;(2) Due to the many advantages of visualization and virtual reality , Most studies tend to use game engines ;(3) Although game engines are widely used , But it is not convenient for critical scientific research ;(4) Traditional statistical visualization technology 3D edition , Such as bar chart and scatter chart , Still commonly used in data visualization environments . This systematic review attempts to add a clear picture to the literature , Emerging background , Different elements , And their interdependence .
1 brief introduction
“ visualization ” This word was already an overloaded term before it was established as a scientific field , And it has different meanings in different contexts . Because the visual structures and types that can be presented in an immersive environment are very diverse , Immersive visualization is placed in the fusion of different research fields . In an immersive environment , Data can be obtained by 3D Model 、3D Graphics and graphics 、 Simulation and various 2D To express . The data source can be statistics 、 Medical Science 、 Computer science 、 Heritage and many other things . Its scope includes technology related fields , Such as multi sensory interface 、 Interaction 、 Navigation 、 Collaboration 、 Present technology and domain specific topics .
There is no definite starting event , The history of visualization includes around design 、 Many discussions on the topic of purpose or intention . Geometric charts 、 Astronomical tables and navigation graphics are considered to be the first visualization attempt , The prominent themes in this field vary according to the problems of the times and areas of interest .17 The increase of practical applications in the 21st century is closely related to the interest in physical measurement , This leads to more line graphs 、 Astronomical graphics and maps . for example , The first known weather map , Edmund · Halley (Edmund Halley) The theoretical curve drawn between air pressure and altitude , And Christian · Huygens (Christian Huygens) Draw the “ Life expectancy and age ” The pictures were drawn in that era (Chen et al., 2014). In addition to the increase of practical applications , With the collection of social data , Population and economic visualization in “ Political arithmetic ” Generated in the method of .“18 The century has brought new fields and graphic forms , Such as abstract charts and thematic drawings . Joseph · Priestley made a more convenient timeline (1765 year ) And a detailed historical chart (1769 year ). With the creative combination of basic forms , First line chart and bar chart (1786 year ), Pie chart and circle chart (1801 year ) By William Playfair The invention , These graphical representations are still widely used (Friendly, 2007 year ).
Most of the data representations used today are in 19 With the development of statistical charts in the 21st century . With the official and scientific recognition of graphical representation , Graphic analysis is used in scientific publications and National Planning . Charles · Joseph · Minard (Charles Joseph Minard) Other innovative works of , His famous visual narrative , The fate of Napoleon and Hannibal's army , It is an example of the social and political application of graphics , Later, it was appreciated by most important figures in this field (Rendgen, 2018). besides , Nightingale's carefully designed plot 、 Jon · Cholera map drawn by snow to improve public health 、 Francis · Galton's statistical graphs and weather patterns and Carl · Pearson's work is also a typical example of historical visualization . After a period of prosperity ,20 The beginning of the century was defined as the dark age of modern visualization . The analysis of the relational database of the milestone project shows , as time goes on , stay 19 The century has risen steadily , And then in 20 The century fell , until 1945 year , And continue to rise sharply to today (Friendly et al., 2017).
The deficiency of traditional two-dimensional representation urges the visual community to find more effective solutions . In recent years , People's interest in virtual reality technology and interdisciplinary contributions have created new possibilities for the application and Realization of virtual reality . Virtual reality is an immersive experience in an artificial environment . as time goes on , People are right. VR Different methods and settings are proposed .VR The simplest version is desktop VR, A display . Fish tank VR Both display , It also includes special glasses for stereoscopic viewing , And take the keyboard as the main input source . Cave Automatic Virtual Environment (Cave) It is a surround screen display technology , Include room sized projected surfaces , To promote the exploration of immersive virtual reality and interactive design . The projection technology used allows users to see all directions . Now , Immersive systems are mainly used in head mounted displays (HMDs) With the help of .hmd It's a three-dimensional device , You can display two images in front of your eyes , To create a three-dimensional sense . Depending on the technology used , Interaction technology is also different . Technology includes head tracking 、 Eye tracking and motion tracking . Headworn devices provide opportunities for new methods of data exploration and interaction .
In an immersive environment , Visual signals indicate the presence of body movement , But in fact, there is no exercise , The result of this sensory conflict is Network disease . Different hardware has different frequency requirements for network diseases . freedom (DoF) Is a term used to describe the ability of an object to move . Basic hmd Provided along x、y、z Axis moving 3 freedom , And more advanced equipment provides 6 freedom , Including translational motion in physical space 、 wave 、 Ups and downs .VR There are different interaction modes . Users can only play a passive role , Or the most common is to move according to the preset trajectory . Exploratory VR Allow users to move themselves . In interactive mode , Users can explore the environment , And through the interactive operation environment , This is the most common interaction mode of immersive visualization . Due to the limitation of physical space ,hmd Provide sitting configuration , Allow users to control the room through the controller and the size of VR Move .VR Reconstruct the space environment through visual cues and sounds , Establish a sense of three-dimensional space .
Immersive environment usually refers to certain terms , If it exists 、 Immersion and concretization . The sense of embodiment depends on the spatial components provided to users , Such as position awareness and virtual body . Existence is related to being in a virtual environment , Immersion can be considered as the result of this existence . immersion 、 The combination of sense of existence and concretization is conducive to the user experience , And determine its quality . therefore , They are widely used to evaluate and develop virtual reality experiences . Most studies use questionnaires to measure presence and immersion .
In addition to the architectural settings , Due to the lack of software tools , Create large VR The environment also has problems . In recent years , The game engine Unity And unreal engine are widely used to build virtual reality environment . The fast production provided by the game engine enables many fields to create immersive visual effects . The compressed information extracted from the data needs to be presented in a visual form . This form can be animated 、 Static or interactive . Definition of data type 、 The choice of visualization and interaction technologies is efficient for creation 、 Accurate visualization is crucial . The choice of appropriate presentation technology mainly depends on the user . therefore , Visualization technology relies on perception and cognitive theory to effectively convey data .
Visualization as an interactive way of communication , Need to provide certain features and tasks , Such as data presentation 、 Confirmatory and exploratory analysis . In recent years , Because of the increasing amount of data , Data visualization and exploratory data analysis have received great attention . Extracting information from high-dimensional and large volume data requires visualization , To adopt different automation technologies , Such as machine learning algorithm . The latest advances in immersive technology and computing power provide new possibilities for data exploration methods , It aims to provide interaction with high-dimensional data , To get basic insights . With the continuous improvement of hardware and software capabilities and the needs of the times ,VR Equipment has become more practical and cheap . Immersive technology has changed the data experience and decision-making process . It allows users to analyze complex dynamic data sets , And transform its passive role into an active role .
The visualization sub domain is in addition to VR In addition to the common problems , There are also domain specific design problems . The creation of information visualization includes about abstract methods 、 Visualize the decision-making process of coding and design principles . Scientific visualization needs to deal with scalability 、 Accuracy and accuracy . Visual analysis (VA) Focus on activities that can be performed through visualization , Such as decision-making and reasoning . Immersive analysis (IA) Focus on using display and interface technologies to support better analytical reasoning and decision-making processes .
Visualization and interaction opportunities provide a new way to express ideas and propose new interaction methods for a wide range of research fields and disciplines ( chart 1). With the recent technological progress , Some libraries 、 The invention of tools and equipment ,VR utilize 3D Environmental advantages , It facilitates the operation and analysis of data . combination VR And tactile or sporty aesthetic interface , It can realize various interactive technologies , And maximize efficiency . The generation of immersive visualization is practical 、 Education and cost-effectiveness have further improved in various areas . Digital city technology allows users to create more sustainable and effective solutions for the urban environment . Provide a reusable and safe environment for experiments and education , Virtual environment provides training in different fields .

VR and 3D Immersive environment is a technology related to perception , Need their visual language . therefore , It is necessary to continue to build theoretical methods . Comprehensive research has the ability to lay the foundation for visualization . game 、 The two-way contribution and influence between video games and virtual reality , Promote virtual reality technology to science 、 Art or information 、 The extension of education and other fields . Although most VR The research adopts an interesting method , but VR New mechanisms have been created for the game industry 、 Infinite possibilities of narration and interaction .Zyda(2005) Strongly recommended VR Researchers study games to improve their design and keep pace with the times .
Although this technology is used in a wide range of fields , But think critically about solutions to challenges 、 Visual specifications and design guidelines are essential . The existing virtual reality visualization research mostly focuses on specific fields or specific visualization structures . for example , Zimmerman (2008) Focus on automotive industry and design .Seth wait forsomeone (2011) The assembly method of the prototype is explained ,Radianti wait forsomeone (2017) Focus on Higher Education ,Wang wait forsomeone (2018) From the perspective of education and training, this paper investigates the Construction Engineering ,El Jamiy and Marsh(2019) Check the depth estimation ,Caserman wait forsomeone (2019) The whole body motion reconstruction is studied and analyzed ,Ferdani wait forsomeone (2019) The archaeological research is analyzed . however , Considering the specific requirements of immersive Technology , Visualization techniques used in different fields are closely related , And it is possible to create a relationship to solve the problem of immersive Technology . Before that , Data collection is a problem , And the extraction and representation of knowledge become ubiquitous because of massive data . In order to fully realize the goal of visual representation , The construction of visualization methods depends on various fields from psychology to machine learning . therefore , We look at technology from a broader perspective , To extract the visual relationship in virtual reality 、 Similarity and sharing problems . We think this method can help developers find solutions in other fields , And point out the direction for more specific guidelines . This paper aims to sort out the existing literature , Discuss common problems and methods in different fields , It provides a basis for building a comprehensive and consistent structure in the field of immersive visualization .
The rest of this study is structured as follows . The first II Section presents the background concept , The first III Section briefly describes the method , The first IV Section summarizes the results , The first V Section puts forward conclusions .
This paper systematically summarizes the related research of immersive visualization in virtual reality . The research questions of this study are :
- RQ1: VR What is your favorite visualization type and structure ?
- RQ2: What methods / Theory is used to study VR visualization ?
- RQ3: VR What are the gaps in the research of visualization ?
- RQ4: What are the existing methods and technologies ?
- RQ5: For different types of visualization , Which software and hardware is preferred ?
4 Results and Analysis
4.1 Tools 、 Toolkits and frameworks
Visualization tools can usually be independent 、 be based on web The presentation of , Mainly by the software library (api) Or programming language module ( for example ,Python or Java modular ) The composition is based on web Development of . They can also follow the software 、 Visualization structure 、 operating system 、 license 、 Scalability 、 Scalability or latest release date . According to the above criteria ,Caldarola and Rinaldi(2017) Reported 36 A software tool , It is divided into 4 Sub part ; Scientific visualization 、 Data visualization 、 Information visualization and business intelligence tools . Database related and based on gui The application provides “ Direct operation principle ”, Such as Microsoft Excel、Amazon Quicksight and Microsoft Power BI. Although they are widely used , But because they are beyond the scope of this article , Therefore, no further details will be given . Visual construction tools are often criticized for hindering creativity due to fixed attributes ; however , They are the first choice , Because they provide an easy-to-use environment , Without programming
Although the visualization library reduces complexity , But they still need experience . besides , There are also some development platforms and existing cross platform tools , Their scope covers many fields . Need an easy-to-use and flexible graphics system to support visual thinking , Pave the way for further development . from Bertin Of 《 Graphic semiotics 》(Semiology of Graphics, Bertin, 1983) Start , Graphics technology began to formalize , Later, it was transformed into the structural theory of graphics , Establish a connection between computer graphics and information visualization theory . Cleveland and McGill (1984) For retinal variables ( Location 、 Color and size ) Experiments were carried out . lately ,Wilkinson(2012) The idea and theory of visual interface Lyra (Satyanarayan and Heer, 2014) and VegaLite (Satyanarayan wait forsomeone ,2017) And grammar based systems such as Polaris (Stolte wait forsomeone ,2002) Provides the foundation , The latter expands the pivot table interface . Visual production tools , Such as Lyra and iVisDesigner (Ren wait forsomeone ,2014), Various customized graphical visualizations can be created based on conceptual modularity , Without writing any code . Unfortunately , They only support a small number of visual forms and parameters that restrict users .
Learn from Wilkinson grammar and the formalization of graphic grammar , Many visual grammars 、 Toolkits and frameworks have been implemented . These declarative languages are usually divided into low-level syntax and high-level syntax . Low level grammar , Such as D3 (Bostock wait forsomeone ,2011 year ),Vega (Satyanarayan wait forsomeone ,2015 year ),Protovis (Bostock and Heer, 2009 year ), They are all expressive grammar , To help designers create explanatory and highly customized graphics , These graphs have fine-grained control of data visualization , All mapping elements need to be specified . lately ,D3 Become very popular , Especially in web In development .Protovis Is a kind of use JavaScript Implementation of embedded domain specific language , Define bars 、 Graphical markers such as lines and labels can help users specify data binding to visual attributes .Vega Be similar to Protovis and D3, But it provides the transformation of scale and layout through the support module , The interactive connection between input data and tag attributes allows users to share and reuse products . On the other hand , Advanced declarative syntax , Such as Vega-Lite and ECharts (Li wait forsomeone ,2018) More suitable for exploratory visualization , By encapsulating details and attributes , They focus on the rapid generation of visualization . Developed a software for Python Declarative statistical visualization Library of , be known as Altair (Satyanarayan wait forsomeone ,2017).
Use api Creating visualization requires background knowledge , This is a tiring process . therefore , A framework has been created for faster and better abstraction . In the introduction of InfoVis after , Developed some offerings similar to those based on java Visualization Library of the visualization tool set toolkit , Such as Prefuse (Heer et al., 2005). In addition to providing abstractions of operators and libraries ,preuse and Flare (Gal et al., 2014) Allow users to define new operators , And use fine-grained single block units to provide customization . be based on gpu The visualization technology of has been widely used in scientific visualization , In recent years, with the improvement of rendering performance , Its application in information visualization is also more and more . for example ,Stardust (Ren et al., 2017) Take advantage of these improvements . It does not provide a new visual syntax , But it is a supplement to the previous tools , With more user-friendly building blocks , It supports the creation of 2D and 3D visualization . A group called VisComposer (Mei et al., 2018) Programmable integrated development environment (IDE) It points out the gap between artists and Coding Experts , It uses something similar to D3 Tree based visual structure .VisAct (Wu et al., 2020) Is another interactive visualization system , It provides high-level syntax for semantic operations , And guide users by including wizard panels and extensive visual forms .
Efforts to build interactive toolkits or systems for information visualization are limited to more traditional 2D Express . therefore , As there are already suitable for immersive environments 3D Environmental Science , Scientific visualization has led the development of virtual reality systems . A widely used framework for scientific visualization applications is the Visualization Toolkit (VTK) (Hanwell wait forsomeone ,2015), This is an extensive library for displaying and interacting with data . With OpenVR The development of , Use in virtual reality environment VTK Make it possible . The API Support Valve Developed SteamVR. therefore , The framework and Oculus Rift and HTC Vive compatible .
In recent years , Researchers pay more and more attention to the exploration of immersive environment of non spatial data . Although it is designed for game applications , but Unity Game engines have become the standard platform for developing immersive environments .IATK (Cordeil wait forsomeone ,2019 year ) and DXR (Sicat wait forsomeone ,2019 year ) Our toolkits are all based on Unity Game engine is developed to build immersive data visualization .DXR It's a toolbox , It uses a subject Vega-Lite Inspired declarative framework , It also provides interactive and extensible visualization , Additional classes and applications can be exported to various platforms , Include Microsoft HoloLens Mixed reality on (MR) and VR Helmet . On the other hand ,IATK Of API Be similar to D3, Visualization can be easily built using graphical syntax .IATK Emerging from previous applications , Such as ImAxes( Immersive axis )(Cordeil wait forsomeone ,2017a) and FiberClay (Hurter wait forsomeone ,2018), It allows users to create visualizations through three-dimensional axes , But no collaboration .Fiberclay Is a typical example , It was evaluated with air traffic controllers , It uses 3D Display large-scale spatial trajectory data , And provide the necessary 3D Beam selection .ImAxes Is an open source information visualization tool , It realizes the scatter diagram 、 Histogram and parallel coordinates , These coordinates can be explored by using the reconfigurable axis of natural interaction .
4.2 Data visualization
Data visualization represents data or information in the form of graphics , Enable the audience to recognize patterns , Pull insights , Grasp the true meaning of information , And communicate more quickly and effectively (Aparicio and Costa, 2015). Although different fields benefit from the graphical representation of data , But data visualization also depends on several disciplines . In Psychology 、 Computer science 、 statistical 、 Thanks to the contributions of graphic design and many other disciplines , It is possible to convert data into simple and understandable graphic format information . With the vigorous development of knowledge from various backgrounds , The adaptability and scalability of data visualization have been improved . for example , Data in various fields are accumulating , It eliminates the traditional method , At present, the lack of large quantities of data . Different methods , Like machine learning , It can be analyzed , And create more effective visualization with different properties . The existing 2D The data visualization method can only contain a small amount of correlation between a few indicators . therefore , In order to analyze high-dimensional data , Many separate diagrams are needed to make a comprehensive representation , Ultimately, it will hinder the understanding of relevance and patterns .
Convert directly to 3D Cannot provide enough clarity , Because of occlusion and perspective distortion 3D Problems may lead to incorrect interpretation in analysis use cases . Although 3D graphics are effective , But in terms of data and visual structure , They can be considered unnecessary . To enhance the data visualization experience , More technologies are needed to display information more deeply . for example , According to a survey (Fonnet and Prie, 2021), Location and visual access ( Like texture 、 Color and shape ) Usually used to encode multidimensional data

Timeline of the rendering technologies used to implement immersive analytics system.
Fonnet A, Prie Y. Survey of immersive analytics[J]. IEEE transactions on visualization and computer graphics, 2019, 27(3): 2101-2122.
Interactivity is enhanced 3D One aspect of the environment . Virtual reality has changed the way we interact and interpret data , Visualization should support multiple activities . Virtual reality should be able to conduct exploratory analysis , Discover the input data and its characteristics 、 Trends and relationships . To help users reject or accept built assumptions , It must provide confirmatory analysis . The presentation of data should be presented in a structured way , To reveal hidden features that cannot be presented by other media or platforms .
Sun wait forsomeone (2019) It provides dynamic visualization of time series and geographical attributes , And make visualization available for observation and accumulation 、 wind direction 、 The relationship between time and location . They use aggregation tables 、 Calendar view 、 The sun column chart and line chart are used to visualize the data from air sampling sensors and meteorological data . stay Okada etc. (2018) In the research of , The visualization system of spatiotemporal data generation consists of two layers . The first layer is a spatial model that can be scaled according to the worldview and small map options . The second layer uses cubes of different colors and transparency to represent frequencies . In a single VR A variety of visualization technologies are combined in visualization , Improved information flow , Create a more attractive experience .

Overview of VR Laboratory for Visual Analytics
Visual analysis VR Laboratory overview 
Geographic View
Geographical view 
The dial controls and the application button
Dial control and Application Buttons 
The accumulation snapshot and accumulation scaling dial
Cumulative snapshot and cumulative zoom dial 
Analysis Table
Analysis of the table 
(a) Calendar Display; (b) Day Bar Graph; Aggregation Table (d) Inactive Line Plot
(a) The calendar shows ;(b) Daily bar chart ; Aggregate table (d) Inactive line diagram 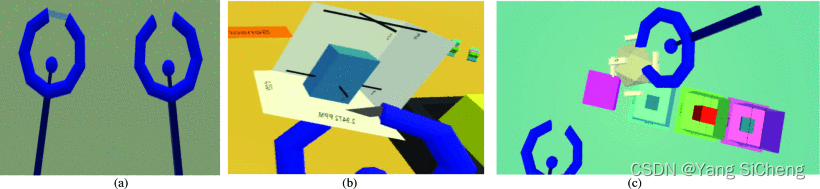
(a) User controllers, left controller is grabbing (b) A single physical reading ( c) Toolbelt holding readings
(a) User controller , The left controller grabs (b) A single physical reading tool belt keeps reading
Sun B, Fritz A, Xu W. An Immersive Visual Analytics Platform for Multidimensional Dataset[C]//2019 IEEE/ACIS 18th International Conference on Computer and Information Science (ICIS). IEEE, 2019: 24-29.

WorldView. (Left) Temporal change of the number of tweets is shown as the overview in a VR space. (Center) Panels which display actual tweets included in each cube appeared when users select each cube. (Right) The character icon with yellow highlight indicates the position of a user to prevent missing his/her current position.
( Left ) The time variation of the number of tweets is VR Overview of space .( middle ) When the user selects each cube , A panel will appear showing the actual tweets contained in each cube .( Right ) The Yellow highlighted role icon indicates the user's location , Prevent users from missing their current location .

Processing flow of cubes generation in worldview.
The processing flow of cube generation in worldview .
Colormap and the transfer function for setting transparency.
Colormap And transfer function to set transparency .
The panel displays the detailed information of each cube. It contains the date, coordinate and text of representative tweets and gives us the knowledge about the reason why people made many tweets in a certain area and time.
The panel displays the details of each cube . It contains the dates of representative tweets 、 Coordinates and text , Let's know why people post a lot of tweets in a certain area and time .
Minimap views the time change of the number of the tweets in a day. Cubes in minimap indicate the aggregation of one-hour data different from those in worldview. Users can observe the time change more specifically.
“ Mini Map ” You can check in one day tweets Time variation of quantity . The cube in the small map represents the aggregation of one hour data , Different from the data in the world view . Users can observe the change of time more specifically .
Example. Top left figure shows people tweet a lot during japanese summer vacation. Top right figure is the map looked down from the position of cubes. It indicates user is in front of cinderella castle. Panels of the both figure below pick up actual tweets.
Example . The picture in the upper left corner shows that people often tweet during the summer vacation in Japan . The figure in the upper right corner is a map looking down from the position of the cube . Prompt the user in front of Cinderella Castle . The panel in the figure below selects the actual tweets .
Okada K, Yoshida M, Itoh T, et al. VR system for spatio-temporal visualization of tweet data[C]//2018 22nd International Conference Information Visualisation (IV). IEEE, 2018: 91-95.
As a medium of communication , Another key element of visualization is interpretation . Visual design and interpretation choices may change users' ability to understand data or lead to misunderstandings . therefore , A good visualization should protect the balance between aesthetics and function . Graph layout algorithm and clustering algorithm are widely used in the visualization of Complex Networks . Cluster data needs to be transformed into understandable visualization . for example ,Drogemuller wait forsomeone (2017) I like to use spheres to represent entities , Use lines to express relationships , Use circles to represent cluster nodes , Build network visualization with spring embedded layout . Clustering algorithm helps users quickly detect patterns , And help them check high-dimensional data sets . However , The algorithm used may have poor performance due to the dimension or noise of the data . therefore ,Bobek wait forsomeone (2022) In this paper, we propose a fine version of immersive parallel coordinate graph (IPCP) System time , More inclined to use a wide range of clustering algorithms for cubes . Through the test of a variety of feature selection methods , It explains the importance of feature selection .

Fig. 1: Our social network visualisation system running in a VR environment.
Our social network visualization system is VR Running in the environment .

Fig. 2: Basic node and cluster interaction.
Basic node and cluster interaction .
Fig. 3: The filter cube showing Age, Location and Education filters.
chart 3: Show age 、 Filter cube for location and education filters .

Fig. 4: The storage box, used to save a collection of nodes by physically placing them within the box.
chart 4: Storage box , Collection for storage nodes , Physically place the nodes in the box .

Fig. 5: Basic architecture diagram showing the relationship between the various system components.
chart 5: Basic architecture diagram showing the relationship between various system components .

Table 1 : Filter cube properties
TABLE I: Filter Cube Attributes
Drogemuller A, Cunningham A, Walsh J, et al. VRige: Exploring social network interactions in immersive virtual environments[C]//Proceedings of the international symposium on big data visual analytics (BDVA). IEEE NJ, USA. 2017.

Figure 1
The Immersive Parallel Coordinates Plots (IPCP) of the (a) DS1 and (b) DS2 datasets respectively with the accompanying 3D scatter plot generated by mapping onto it the three criteria dimensions (selected in red). Both the IPCP and scatter plots selectors are visible (red spheres) as well as the orange cross-hair used for the user’s gaze tracking. The observable difference in the size of the scatter plots is caused by the different perspectives from which the screen-shots were captured.
(a) DS1 and (b) DS2 Immersive parallel graph of data set (IPCP), And by integrating the three standard dimensions ( Select in red ) Map to the generated 3D Scatter plot .IPCP And the scatter selector are both visible ( Red sphere ), And orange crosshairs for user gaze tracking . The observable difference in the size of the scatter is caused by the different perspectives from which the screenshot is captured .

Figure 2
Comparison of clustering results obtained with selected algorithms: (a) DBSCAN; (b) OPTICS; Affinity Propagation. The top row presents the 2D plots, whereas the bottom one shows 3D scatter plots as the headset wearer sees them. The selected clusters are marked gray hulls (in 2D) and green (in 3D), respectively. These clustering examples were done over the DS1.
Compare with the clustering results of the selected algorithm :(a) DBSCAN;(b) optics ; Affinity propagation . The upper line shows 2D chart , The following line shows what the headphone wearer sees 3D Scatter plot . The selected clusters are marked as grey hulls (2D) And green hull (3D). These cluster examples are in DS1 The complete .

Figure 3
(a) DBSCAN clustering after dimensionality reduction with PCA to 3 components.; (b) feature importances obtained with random forest classifier. Difficulties in proper cluster identification on the correlated axis are shown in . Choosing the set of the uncorrelated axis (d) allows for a better overview of data. The presented clustering was done over the DS1.
chart 3
(a) PCA Dimensionality reduction 3 After four components DBSCAN clustering ;(b) The feature importance obtained by random forest classifier . The difficulty of correctly identifying clusters on the correlation axis is shown in . Select an unrelated axis (d) The collection of can better summarize the data . The clustering shown is in DS1 The complete .

Figure 4
Comparison of clustering results with a given number of the desired clusters (top rows) obtained with the Subspace Memory Clustering (SuMC) algorithms with respect to ground truth (bottom rows). (a,b) contain the results for selected 5 clusters; (c,d) contain the results for selected 3 clusters. The clusters are color-coded (top rows) and put against the patterns recognized by the domain-experts. Each bar constitutes a single point in the DS1 dataset and each cluster is represented by a different color.
chart 4
Cluster the clustering results with a given number of expected clusters ( Top row ) Compare , Use subspace memory clustering (SuMC) Algorithm relative to ground truth ( Bottom line ).(a,b) Contains the selected 5 Group results ;(c,d) Contains the selected 3 Results of clusters . These clusters are color coded ( The top row ), And arrange according to the pattern recognized by the domain experts . Each bar constitutes DS1 A single point in the dataset , Each cluster is represented by different colors .

Figure 5
(a) The left-hand menu with all the implemented data-science analytics: (1) [RESTART] restarts the visualization, (2–4) are the 3D scatter plot clustering solutions attached to individual labeled buttons [DBSCAN], [OPTICS], and [AFFIN], (5) [SORT] sorts the axes (i.e., IPCP’s dimensions) using their calculated importance, (6) [TOGGLE] toggles between the selected and unselected at the moment data items, (7) [DUPLICATE] duplicates the selected data items, and (8) [UNDO] undoes the most recent manipulation result. (b) presents the finger-press gesture used to select a button on the menu. Whereas shows the highlighted [SORT] after the user pressed that button which cased the importance sorting to be executed on the IPCP as shown in Figure 6. Icons by Icons8 (https://icons8.com, accessed on 23 September 2019).
chart 5
(a) The menu on the left contains all executed data - Scientific analysis :(1) [RESTART] Restart visualization ,(2-4) Is attached to a single marker button [DBSCAN], [OPTICS] and [AFFIN] Upper 3D Scatter clustering solution ,(5)[SORT] Use the importance of its calculation on the axis ( namely IPCP Dimensions ) Sort ,(6)[TOGGLE] Switch between the selected and unselected data items ,(7) [DUPLICATE] Repeat the selected data item ,(8)[UNDO] Undo the latest operation result .(b) Displays the finger press gesture used to select buttons on the menu . However, it shows the highlighted after the user presses the button [SORT], This button is used in IPCP Perform important sorting on , Pictured 6 Shown .Icons8 The icon (https://icons8.com, 2019 year 9 month 23 A visit to ).

Figure 6
The IPCP visualization of the DS1 dataset presented in original (a,b) sorted order. The rearrangement of the axes was carried out based on the importances. As it can be seen in (b) the axes containing no knowledge i.e., constant data, were moved on the right of the IPCP main plot, thus reducing the amount of data that has to be visually analyzed by the user. The user can toggle between sorted and unsorted i.e., the original organization of the axes.
chart 6
DS1 Data sets IPCP Visualize in original (a,b) Sort by . The rearrangement of the axes is based on importance . stay (b) Can be seen in , Axis without knowledge , That is, constant data , Be moved to IPCP The right side of the main graph , Thus, the amount of data that users must visually analyze is reduced . Users can switch between sorted and unsorted , That is, the original organization of the shaft .
Bobek S, Tadeja S K, Struski Ł, et al. Virtual reality-based parallel coordinates plots enhanced with explainable ai and data-science analytics for decision-making processes[J]. Applied Sciences, 2021, 12(1): 331.
Unlike 2D Data visualization , Data is always presented from one angle ,VR Shows the potential use of switching between different perspectives . This creates different embodied cognitive cases for users , Interpret data in new ways . The ability to change perspectives creates more immersive experiences and precise insights . In the virtual reality environment , The focus will change as the user moves . therefore , According to the user's perspective , The perception distance of content is different . The layout of the data can provide equivalent perception , And ensure its distribution in spherical space ;Kwon wait forsomeone (2015) Space filling curve layout and spherical edge binding are adopted . Different strategies 、 Algorithm 、 Alternative ideas and demonstrations , The combination of these technologies enhances visualization . Refined interpretation of complex data , Let users view data from different perspectives , Gain a deeper understanding .

Head mounted devices render a warped view with tight control for each eye. Our approach for graph visualization uses techniques targeted specifically for such displays. Color in all figures corresponds to clusters.
Head mounted devices present distorted views by strictly controlling each eye . Our graphic visualization method uses technology specially used for this kind of display . The colors in all graphics correspond to clusters .
Mapping a 2D layout to a sphere. Nai¨ve azimuthal projection distorts distances (a). Warping the space according by d=tan(d) produces even radial spacing (b).
take 2D The layout is mapped to a sphere .Nai¨ve Azimuth projection will deform the distance (a). according to d=tan(d) Distort the space to produce a uniform radial spacing (b).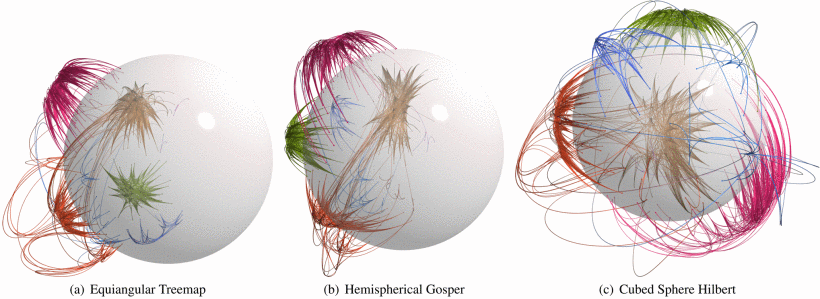
Spherical graph layouts: 2D layouts can be mapped to the sphere with varying amounts of distortion. Preserving angles (a) is appropriate for rigid, rectangular structures, but is limited in field of view (FOV). Azimuthal mapping (b) works well for roughly circular layouts to use a full hemisphere. For full immersion , we use a space filling curve defined on a cubed sphere to cover the entire surface.
Spherical layout : Two dimensional layouts can be mapped to spheres with varying degrees of distortion . Baojiao (a) Suitable for rigid rectangular structures , But in the field of view (FOV) There is a limit on . Azimuth mapping (b) It is suitable for a roughly circular layout using the whole hemisphere . For complete immersion , We use the space filling curve defined on the cube sphere to cover the whole surface .
Hierarchical edge bundling routes edges with splines that follow the clustering hierarchy. For a sphere, we compute the spline in two stages. An angular spline (in yellow) is computed with spherical interpolation according to control points on the surface of the sphere (red points). Then the spline is extended radially by moving the control points outward (blue) and modulating the radius of the edge samples as a 1D spline (green).
Hierarchical edge bundling routing edges and splines follow the cluster hierarchy . For sphere , We calculate the spline in two steps . According to the control point on the sphere ( Red dot ), Use spherical interpolation to calculate angular spline ( yellow ). Then move the control point outward ( Blue ) And modulating the radius of the edge sample to 1D Spline ( green ) To expand the spline radially .
When the user selects a node, it and all its neighbors were brought closer to the user, rendered with a halo effect, and labelled. Here, this is shown at an angle for illustrative purposes; in the HMD view, the nodes move straight towards the user.
When the user selects a node , It and all its neighbors are taken closer to the user , Render to halo effect , And label it . here , This is an angle display , For illustrative purposes ; stay HMD In the view , Nodes move directly to users .
In a 2D view, the whole graph may be visible, but there is no discernable shape to the edges, making them difficult to follow. In a VR environment, only a small section of the graph is visible at a given time, but structure is more tangible.
stay 2D In the view , The entire graph may be visible , But the edge has no recognizable shape , Make it difficult for them to follow . stay VR Environment , Only a small part of the chart can be seen at a given time , But the structure is more shaped .
Kwon O H, Muelder C, Lee K, et al. Spherical layout and rendering methods for immersive graph visualization[C]//2015 IEEE Pacific Visualization Symposium (PacificVis). IEEE, 2015: 63-67.
4.3 Information visualization
Explore spatial mapping of abstract data design space becomes a new sub domain of visualization information visualization (InfoVis) A key theme of . Information visualization is based on graphic designers 、 Statistician 、 human-computer interaction (HCI) Based on researchers and many others . Interdisciplinary fields have been exploring how to effectively use computer graphics to carry out abstract data visualization and interactive exploration ( chart 4).
4.3.1 art 、 Heritage and architecture
Thanks to the game industry , Recently developed a powerful VR And augmented reality (AR) Applied low-cost equipment , Cultural heritage institutions have begun the digital era . The three-dimensional representation of cultural heritage relics and buildings has affected many fields such as virtual cultural heritage tourism and urban history research . The development of technology for capturing and recording heritage has provided new technologies , Instead of manual interpretation that requires more time and effort . stay Leo Biek (Gettens, 1964) Realized the first archaeological object 3D After the documentation , Many cultural relics began to be exported to the digital environment . Cultural heritage that cannot be protected due to natural and man-made disasters , There is enough literature to pass it on to future generations , Digital media preservation has become a reliable method . The final product of the digitalization process not only serves Archaeology and architectural literature , It also provides educational opportunities 、 exhibition 、 Virtual tourism 、 Space experimental research and cultural relics analysis . On the other hand ,3D Preparation of digital content 、 Presentation and interaction require careful work . According to the complexity of three-dimensional digital representation 、 Size and location , You can use different methods , Such as laser scanning and photogrammetry . Besides , People have also developed some techniques to rebuild Art , Such as sculpture and painting . These technologies include image sorting , Volume based approach , Structured form of Motion Algorithm (Sooai etc. ,2017). The problem is , Due to the graphic requirements for details , The generated model is usually complex . Some geometric optimization and compression methods have been developed , To solve technical problems such as managing millions of polygons or processing time , And their main purpose is not to include details and realism . for example ,Fernandez-Palacios wait forsomeone (2017) Provides a solution that includes many optimization techniques , Create immersive by digitally reconstructing heritage scenes VR Experience . Their work includes transferring details of normal maps to low resolution models , Unfolding technology to reduce texture load , And using software tools to reduce the resolution of geometric optimization without reducing the visible quality .Choromanski wait forsomeone (2019 year ) A ground laser scanning VR System , The photo belongs to baroque palace . They also tested various texture mapping algorithms , Mesh geometry of models built to simplify data collected by different methods .

Object placement in virtual environment.
Object placement in virtual environment .
Points (titik) to guide camera movements.
spot (titik) Guide the camera to move .
Application is available on google play
App can be played on Google
Sooai A G, Nugroho A, Al Azam M N, et al. Virtual artifact: Enhancing museum exhibit using 3D virtual reality[C]//2017 TRON Symposium (TRONSHOW). IEEE, 2017: 1-5.
Fernández-Palacios B J, Morabito D, Remondino F. Access to complex reality-based 3D models using virtual reality solutions[J]. Journal of cultural heritage, 2017, 23: 40-48.

Figure 1. Meshes generated from clouds with differently computed normal vectors (particular methods are described in table 2.)
chart 1 Shown . Meshes generated by clouds of different computational normal vectors ( Specific methods are in table 2 Description in ).

Figure 2. Textures in adaptive orthophoto (A) and generic (B) mapping mode.
chart 2. Adaptive orthophoto (A) General purpose (B) Texture in mapping mode .
Figure 3. Comparison of adaptive orthophoto (A) and generic (B) textures mapped on mesh in Unreal Engine.
chart 3. Adaptive orthophoto (A) General purpose (B) Comparison of texture mapping in virtual engine mesh .
Figure 4. Comparison of data preparation workflows.
chart 4. Data preparation workflow comparison .

Figure 5. Sample blueprint responsible for showing user interface element on space bar key pressing action.
chart 5. The example blueprint is responsible for displaying the spacebar press action on the user interface elements .
Figure 6. Content of Oculus Rift VR headset.
chart 6.Oculus Rift VR Content of helmet .
Figure 7. Overhead projection of the palace ground floor, where only three chambers were modelled with textured meshes (Both Galleries and Big Hall). Other chambers were placed in 3D as extrusion of walls outlines.
chart 7. Projection on the ground floor of the palace , There are only three room models and texture meshes ( Galleries and halls ). Other rooms are extruded 3D placement as wall outlines .

Figure 8. Example of additional lighting placement inside Big Hall chamber.
chart 8. Examples of placing additional lighting in the auditorium .
Figure 9. Example of final visualization (North Gallery), on the right-side HUD with additional information about wall painting is visible.
chart 9. The last visualization example ( North Gallery ), On the right side of the HUD You can see additional information about wall paintings on .
Choromański K, Łobodecki J, Puchała K, et al. Development of Virtual Reality application for Cultural Heritage visualization from multi-source 3D data[J]. International Archives of the Photogrammetry, Remote Sensing & Spatial Information Sciences, 2019.
Another way to protect and maintain cultural heritage through digitalization is Virtual Museum .Schweibenz(1998) The virtual museum is defined as a collection of related digital objects , Spread objects and information without real places and spaces . Due to user interaction 、 Environment and content 、 Experience design and other requirements , The construction of virtual museum is challenging . Museums can be designed in realistic forms , Copy a real Museum , Or use alternative methods , But the final product should convey the expected information (Skamantzari, 2018). for example ,Kersten wait forsomeone (2017) Virtual museum design , In addition to realistic models , It also includes the guiding viewpoint for the basic position and the detailed information menu .Monaco wait forsomeone (2022) Created a customizable Virtual Museum , Users can play a more active role in the Virtual Exhibition . Their build process allows users to use knowledge maps (Knowledge Graphs, KGs) Select data , Personalize the museum by changing its layout , And select comments . Knowledge is a set of entities 、 Attributes and the relationship between them . Entity 、 Relationships and attributes can form a graph of nodes and edges , Make graph structure a realistic representation of knowledge . The combination of virtual exhibition and graphic abstraction enhances the interaction , And make the complex knowledge relationship understandable under the background that traditional museums cannot present . They also reported that , The construction time is highly related to the lighting setting selected by the user , Because it requires a lot of calculation . therefore , They offer different lighting options .
Schweibenz W. The" Virtual Museum": New Perspectives For Museums to Present Objects and Information Using the Internet as a Knowledge Base and Communication System[J]. Isi, 1998, 34: 185-200.

Figure 2: The Newggenheim Museum of Second Life.
chart 2:Newggenheim Museum of Second Life.
 Figure 5: The 3D polygonal mesh on the left and the textured 3D mesh on the right
chart 5: On the left 3D Polygonal mesh , Texture on the right 3D grid 
Figure 6: The main Interface and Views of Unity
chart 6:Unity Main interface and view

Figure 7: The main elements that configure the entity of visitor in the environment of Unity
chart 7: stay Unity The main elements of configuring visitor entities in the environment

Figure 8: A snapshot from the virtual museum. The visitor chose to rotate the left sculpture, while the available information appears on the right of the screen. The mini-map can be seen on the bottom left of the screen
chart 8: Snapshot of Virtual Museum . Visitors choose to rotate the sculpture on the left , The available information appears on the right side of the screen . The mini map can be seen at the bottom left of the screen

Figure 9: At the beginning of the virtual tour the visitor reads the available instructions
chart 9: At the beginning of virtual travel , Visitors read the available instructions
Skamantzari M, Georgopoulos A. 3D Visualization for virtual museum development[J]. The International Archives of Photogrammetry, Remote Sensing and Spatial Information Sciences, 2016, 41: 961.
Virtual reality technology and geographic information system (GIS) The fusion of has produced a new information system VRGIS.VRGIS It can support the query of spatial data 、 Handle 、 Storage and analysis functions . The Internet of things (IoT) technology 、 Virtual reality (VR)、 Three dimensional geographic information system (3D GIS) And so on , It provides a new way for the sustainable development of urban environment . Visual analysis and GIS The composite use of the system allows the understanding of important features , For example, the intermediation in the field of urban design 、 Tightness 、 Centrality and shortest path . However , The charts generated by city size and components cannot be explored or understood . One way to solve this clutter problem is to simplify and segment the graph . for example ,Huang et al.(2016) Generated a file named TrajGraph Visual analysis system to study and plan the urban network . They applied a graph partitioning algorithm , Divide the graph into several blocks , At the same time, keep the necessary relationship of the goal . The concept of smart city is proposed to optimize the urban system , Create a sustainable and efficient environment .Lv wait forsomeone (2016) It is believed that the construction of smart city starts from informatization 、 Digitization 、 Intellectualization consists of three stages .Broucke and Deligiannis(2019) This paper proposes a new method based on Brussels smart city data VR platform , This platform can reduce the frustration of participants in the exploration experience .Dong wait forsomeone (2022) A detailed analysis is made , To understand the virtual reality needs of urban multi-layer data . In parallel with their analysis results , They built a digital city simulation model based on multiple components and subsystems , Such as model editing and model reconstruction (MERM) And scene creation and roaming system (SCCM). Their process starts with data collection , Then it evolved into different formats , To create a consistent platform . Most smart city projects aim to improve urban life , Create the environment , Support urban residents to be efficient 、 Easy interaction . The concept of smart city also contributes to urban construction . In the process of construction , It is essential to foresee practical problems . Understand the spatial order 、 Applicable functions 、 Technical requirements and production process are also essential . Consider the parameters and size of the city , Three dimensional visualization and simulation can guide the decision-making process .
 The system architecture
System architecture  The model of the TCM literature
The mode of traditional Chinese medicine literature  The model of the bookcase
Model of bookshelf  The snapshot of the platform scene.
A snapshot of the platform scenario . The snapshot of the platform
Snapshot of the platform
Huang Y, Zhai X, Ali S, et al. Design and implementation of traditional Chinese medicine education visualization platform based on virtual reality technology[C]//2016 8th International Conference on Information Technology in Medicine and Education (ITME). IEEE, 2016: 499-502.
 System overview of the proposed platform. Geographical, Meteorological, Mobility and Social information is gathered from external sources. The data is then formatted, mapped to a visual structures and projected towards the user via using a HMD. The VR equipment captures 3D user interactions which allow for the user to directly interact with virtual objects that depict information from the external sources.
System overview of the proposed platform . Geography 、 meteorological 、 Mobile and social information is collected from external sources . then , The data is formatted , Map to a visual structure , And by using HMD Project to the user .VR Device capture 3D User interaction , Users can interact directly with virtual objects that depict external information . User perspective in the VR application. Bus and bike stations are visualized by poles with counters (a). Real-time buses and trams move along the map surface (a). Metereological information is depicted using weather objects and textual displays (b). Social information is visualized in cluster spheres . The user is capable of touching 3D objects with the virtual index finger, upon which they are able to get more information in the form of a textual user interface (d).
VR User perspective in application . Bus and bicycle radio stations are used by poles with counters (a) visualization . Real time buses and trams follow the surface of the map (a).Metereological Information description uses weather objects and text display (b). Social information visualization in the cluster sphere . Users can touch the virtual index finger 3 d object , On this basis , They can get more information in the form of text user interface (d). Participants of the user study explore Brussels heterogeneous smart city data in virtual reality while executing taskset 4 (a). Real-time smart city data is displayed through moving vehicles, tweet clusters, bus and bicycle stations in a virtual environment (b).
Participants in user research are performing task sets 4 (a) At the same time, explore heterogeneous smart city data in Brussels in virtual reality . The real-time intelligent city data passes through the mobile vehicles in the virtual environment 、 Twitter cluster 、 Bus and bicycle stops display (b). Box plot of perceived workload scores for every subdomain; Mental(M), Physical (Ph), Temporal (T), Performance (Pf), Effort (E) and Frustration (F)
Box graph of perceived workload score of each sub domain ; psychology (M), Physiology (Ph), Time (T), performance (Pf), Strive (E) And frustration (F) Box plot of perceived scores for Data Intuitivity (DI), Data Distinction (DD), Immersion (I), Data Overview (DO) and Intuitive Interaction (II)
Data intuition (DI)、 Data differentiation (DD)、 Immerse (I)、 An overview of the data (DO)、 Intuitive interaction (II) Perceptual scoring box line diagram
Broucke S V, Deligiannis N. Visualization of real-time heterogeneous smart city data using virtual reality[C]//2019 IEEE International Smart Cities Conference (ISC2). IEEE, 2019: 685-690.
In order to make art experience easier to obtain , More immersion , More attractive , Number based strategy , Such as AR, VR and Web3D Already in use . Recent projects have focused on rebuilding artifacts in virtual environments . Although the results of many studies are promising , But it is not easy to realize the artist's universe . for example , take 2D The art form is transformed into VR Experience requires developers to add parts that are not included in the original , Copying requires every detail to be written in 3D Mode modeling .Raya wait forsomeone (2021) by VR Two paintings have been reconstructed , The paintings can let users experience kinesthetic texture through introductory methods . According to a review paper (Zhang et al., 2020), VR Safety planning of technology in the construction field 、 Design interpretation 、 Collaboration 、 construction project management 、 education 、 Planning and human behavior and perception have been applied . In recent years , Computer aided design (CAD) And building information modeling (BIM) Tools combined with virtual reality technology , To maintain efficient communication and design process , And avoid conflicts in the above areas . Architects and engineers are designing efficiently 、 management 、 Used in construction and operation stages BIM. for example , On the influence of daylighting ,Akin wait forsomeone (2020) Developed an integration BIM Immersive design tools for Technology , To improve the visual perception and consciousness in the design process .3D CAD The model contains 3D Model 、2D A lot of information in drawings and diagrams (Ivson et al., 2020). Munster et al (2020 year ) Provides an automated pipeline , Build from historical images 4D City Model , To create browser based mobile VR Applications , The fourth dimension here is time . utilize CNN The architecture of , They generate building models from images based on building plans . Attempts to graft different fields have also led to a wide range of sub fields , Such as immersive city analysis . for example ,Chen wait forsomeone ,2017 A method was proposed in , utilize Li Explosion view and principle explained by et al , Apply visual analysis in urban context (Li wait forsomeone ,2008).
 Images of the virtual paintings using the ImmersArt tool. Left, recreation of the painting The Persistence of Memory (original at www.moma.org/collection/works/79018). Right, recreation of the hellscape panel of The Garden of Earthly Delights (original at www.commons.wikimedia.org/wiki/File:The_Garden_of_earthly_delights.jpg).
Image use of virtual painting ImmersArt Tools . Left for 《 The eternity of memory 》( picture source :www.moma.org/collection/works/79018). Yes , Entertainment hell landscape panel garden secular fun ( Originally in www.commons.wikimedia.org/wiki/File:The_Garden_of_earthly_delights.jpg). Images of some of the virtually recreated details of Salvador Dalí’s painting The Persistence of Memory and the painters’s biographical highlights. At the top, close-ups of the recreation of the artwork. In the lower part, objects extracted from the author’s biography and other of his paintings.
El Salvador Dalí The painting of 《 Lasting memory 》 And the artist's biography highlights some virtual reproduction of the detailed images . At the top , It is a reproduction and close-up of works of Art . In the second half , Objects extracted from the author's biography and other paintings . Haptic device used at ImmersArt to provide virtual touch to the user: the Novint Falcon.
ImmersArt Tactile devices that provide users with virtual touch :Novint Falcon. Process of building this virtual scene. (a) Piece of art origin of the sketches. (b) Modeling/rigging phase. Shading, lighting. (d) Result (with animation, FX, CFX, and optimizations).
The process of creating this virtual scene .(a) The art source of sketches .(b) modeling / Manipulation stage . shadow , lighting .(d) result ( Contains animation 、FX、CFX And optimization ). Simplified class diagram of the interaction system developed for this experience. The Monobehavior class is part of the Unity3D API, and inheritance from it is required in order to be called by the Unity3D internal engine during the rendering of each frame.
Experience in interactive system development that simplifies class diagrams .Monobehavior Class is Unity3D API Part of , In order to be Unity3D Internal engine call , Need to inherit it .
Raya L, García-Rueda J J, López-Fernández D, et al. Virtual Reality Application for Fostering Interest in Art[J]. IEEE Computer Graphics and Applications, 2021, 41(2): 106-113.
4.3.2 Computer science
In order to better understand the software architecture 、 Various algorithms and computer science concepts , Different visualization techniques have been provided . The focus of the research is to explain the complex structure , To understand the different characteristics and concepts related to this field . for example , Visualization technology has been used to better understand and interpret AI (AI). Interpretable AI (XAI) Is a recently developed technology , It aims to deepen the understanding of artificial intelligence through human eyes . As part of this research ,Selvaraju wait forsomeone (2017) A gradient weighted class activation mapping is proposed (GradCAM), This is a visualization method that benefits from the target gradient , And strengthen learning in depth (DRL) Generate location map on Algorithm . By analyzing their understanding of Atari Games The study of , Including visualization of input status and selected output actions , You can understand CNN The role of layers . Another research focusing on neural network visualization is caff2unity (Aamir et al., 2022). take Caffe Framework and Unity Game engine combination , It provides real-time interaction with neural network in image classification tasks . Their interaction method can make users better understand the complex structure of Neural Networks .

Figure 1
(a) Flow chart of the compilation process of the Caffe2Unity.dll and its interfacing with Unity to perform various tasks. In its current form, we used the DLL for image classification as an application domain. (b) Prototypes and attributes of the main classes used in the Caffe2Unity.dll to achieve our goal. Snapshot of the visualization strategy illustrating the immersive model of AlexNet with details of all layers and activation maps that are used in the VR environment.
chart 1
(a) caff2unity .dll Compilation process flow chart , And it's with Unity Interface to perform various tasks . In its current form , We use DLL As an application field of image classification .(b) stay caff2unity .dll Prototypes and properties of the main classes used in to achieve our goals . A snapshot of the visualization strategy , Illustrates the AlexNet Immersive model of , It includes details of all layers and in VR Active map used in the environment .
Figure 2
(a) An immersive visualization of different layers of the AlexNet architecture in Unity, (b) virtual GUI for selecting paths for model weights, CNN structure, labels, and input image, input layer, (d) first convolutional layer icon, (e) snapshot of activation maps of the 1st convolutional layer, (f) selecting the connection of a particular filter of the 1st convolutional layer to visualize its activity across the network, and (g) deeper layer interactions of the selected filter. The user can visualize and hide filters and activation maps by selecting the corresponding option on the layer icon using a laser pointer.
(a) stay Unity Chinese vs AlexNet Immersive visualization of different layers of architecture ,(b) Is the model weight 、CNN structure 、 Label and input image to select the virtual path GUI, Input layer ,(d) Convolution layer first layer icon ,(e) The first layer of convolution layer activates the mapping snapshot ,(f) Select the first 1 Connection of specific filter of convolution layer , To visualize its activities throughout the network , as well as (g) Deeper interaction of selected filters . Users can visualize and hide filters and activate mappings by using the laser pointer to select the corresponding options on the layer icon . Figure 3
Analyzing the network decision using Shapley-value-based interpretations in the VR environment. These interpretations are shown for three hidden layers namely conv1, conv3, and conv5, respectively (see also Figure 4 for zoomed in view).
stay VR Environment based on shapley Value interpretation analysis network decision . These explanations show three hidden layers respectively , namely conv1、conv3 and conv5( See also figure 4 Enlarged view of ). Figure 4
Zoomed in view of VR-based Shapley value results from Figure 3 showing individual interpretation of three hidden layers, (a) conv1, (b) conv3, and conv5 of the weasel image.
Enlarged view 3 Based on vr Of Shapley Worth the result , Shows the image of the weasel (a) conv1, (b) conv3 and conv5 Separate interpretation of the three hidden layers . Figure 5
Zoomed in view of VR-based results, (a) original image on the left whereas the right image shows the overlaid block occlusion, and (b) Shapley-value-based interpretation of the weasel image after being occluded by the VR user. Results are shown for three hidden convolutional layers, where the network strongly predicted the image as being a “guinea pig” instead of a “weasel”.
Based on VR In the result of ,(a) The original image on the left , The image on the right shows the superimposed block occlusion ,(b) The weasel image is VR Based on shapley -value The explanation of . The result shows three hidden convolution layers , The strong prediction image of the network is “ guinea pig ” instead of “ Weasel ”.
Aamir A, Tamosiunaite M, Wörgötter F. Caffe2Unity: Immersive Visualization and Interpretation of Deep Neural Networks[J]. Electronics, 2021, 11(1): 83.
have 3D The high-dimensional visualization of representation benefits from metaphor , Make knowledge easier to acquire and understand . A basic component of computer science is the use of metaphor . The evaluation of metaphor is related to the nature of the visual field and the approximation of the concept of the related field . In this way , The design of components related to specific functions is critical . One of the metaphors widely used in computer science is urban metaphor . for example ,EvoStreets technology (Steinbeck wait forsomeone ,2019 year ) A city metaphor is used , Visualize hierarchical relationships as software streets .VR City (Vincur et al., 2017) It consists of different layers , Use layout algorithms to accommodate various entities . It includes a connection layer for relationships 、 Used to display the author layer of recent activities with path points 、 City layer used to represent classes 、 Code space layer for scanning code and for possible operations UI Space layer .Oberhauser and Lecon(2017) It provides space for flight experience 、 ground 、 Custom metaphors , To encourage exploration of code information 、 Analytical and descriptive cognitive processes . stay IslandViz in ,Misiak wait forsomeone (2018) Use an island metaphor to visualize an island based on VR Open service gateway initiative in (OSGI) The software architecture of the software system .
 Visualizing software clones with evostreets.
use evostreets Visual software cloning . The evostreets of guava used as tutorial for the 2D environment.
《evostreets of guava》 As 2D A tutorial on Environment . The evostreets of guava using the same visual attributes as in Figure 2, but rendered in three dimensions.
Guava evostreets Use and figure 2 Same visual properties , But in three dimensions . Visualization of the scenarios of our three tasks as 2.5D projections. S marks the starting point of the exploration.
Visualize the scenarios of our three tasks as 2.5D Projection .S It marks the starting point of exploration . Time required to find an answer of each task and environment.
The time required to find the answer to each task and environment . Rating of each task and environment.
Rate each task and environment . Trajectories of the 2.5D (yellow) and VR (cyan) environments.
2.5D( yellow ) and VR( Cyan ) The trajectory of the environment .
Steinbeck M, Koschke R, Rudel M O. Comparing the evostreets visualization technique in two-and three-dimensional environments a controlled experiment[C]//2019 IEEE/ACM 27th International Conference on Program Comprehension (ICPC). IEEE, 2019: 231-242.
4.4 Scientific visualization
Powerful computers and realistic renderings make graphics a unique field , This allows scientists to use visualization in scientific research ( chart 5). For experts in the field of Science , Visualization of scientific data is crucial , And you can exchange students with ordinary audiences . Scientific visualization is limited to two-dimensional representation . With the development of rendering technology , Now you can visualize and interact with scientific data in a three-dimensional virtual world . This enables users to explore and interact with real representatives , Improve students' understanding ability and enhance public participation .
Due to the high dimension and abstraction of data , Scientific visualization scanning can be very complex , It is difficult to calculate from data sets . They may require exclusive visualization , Instead of traditional computer visualization . The difference between traditional desktop and mouse 2D Some may not be enough to build 3D understand , This also varies from user to user . With the traditional 2D The monocular system of the screen is different , Binocular system in virtual reality display provides real depth perception and spatial relationship . therefore , Many industries have adopted these systems to test real scenes , Just like in training . Serve the mining software module , The visualization software of block karst cave mining system is developed , It provides a reference for the management cycle and operation of block karst caves . Allow collaborative environments , And convert the complex mining system environment into graphical representation , It can improve the understanding of seismic data (Tibbett wait forsomeone ,2015). Interactive 3D data visualization is also used in high energy physics (HEP) experiment .ATLASrift project (Riccardo Maria wait forsomeone ,2019 year ) It aims to create an immersive experience for Atlas detectors and experimental sites . Use the unreal engine , They provide three levels with different interaction modes . Although game engines are widely used for visualization when external libraries are required , For example theATLASrift In the project , But integrating external libraries into the game engine is very challenging .

Figure 2. Spheres placed in the VR environment are used as switches: users can activate additional panoramic views of the location by getting close to them. In the example, the blue sphere in an ATLAS service tunnel activates a panoramic view of the computer crates
chart 2. Put in VR The sphere in the environment is used as a switch : Users can activate additional panoramic views of the location by approaching them . In the example ,ATLAS The blue sphere in the service tunnel activates the panoramic view of the computer crate 
Figure 3. The “Control Room” level: a view of the VR representation of the ATLAS control room. The screens on the desks show different plots related to the data-taking, while the virtual screens on the walls show educational videos and event displays.
chart 3.“ Control room ” Level :ATLAS Control room VR Render view . The screen on the desk shows different plots related to data collection , The virtual screen on the wall shows educational videos and activity displays . Figure 4. A view of the “Globe” level, showing the ATLAS Barrel Toroid magnet inside the main hall. In the background, posters related to the ATLAS Muon Spectrometer, for which the magnet is used. On the right, a ramp climbs to the upper floor; on the wall along the ramp, posters tell the history of the ATLAS experiment.
chart 4.“ World ” Level view , Show... In the main hall ATLAS Barrel Toroid Magnets . The background is used with magnets ATLAS μ Poster related to sub spectrometer . On the right , There is a slope to climb upstairs ; Along the wall of the ramp , The poster tells ATLAS History of experiments . Figure 5. Game engines require that all user code is integrated into the engine itself.
chart 5. The game engine needs to integrate all user code into the engine .
Figure 6. The self-contained nature of game engines makes it difficult to use external li braries in applications developed within such platforms.
chart 6. The self integration of game engine makes it difficult for applications developed on such a platform to use external libraries .
Maria B R, Bourdarios C A, Hovdesven M, et al. Virtual Reality and game engines for interactive data visualization and event displays in HEP, an example from the ATLAS experiment[C]//EPJ Web of Conferences. EDP Sciences, 2019, 214: 02013.
4.4.1 Meteorology and Earth Science
Helbig et al.(2014) utilize VR Technology to visualize atmospheric cloud data , The heterogeneous data in different dimensions can be visualized through the relationship between variables , Otherwise, it is not easy to understand only by displaying numbers . Compared with the previous meteorological visualization system ,MeteoVis (Li wait forsomeone ,2020 year ) It provides concurrent spatiotemporal meteorological data streams from multiple sources , It has a wide range of operation and exploration features . The challenges of earth science are usually related to visual requirements , Such as size 、 Shape and structure . The shader interface provided by the game engine is used to visualize the terrain in the geophysical environment . This allows higher resolution meshes to be rendered in the field of view to provide detail , And save the extended view with a low resolution grid .Bonali wait forsomeone (2022) The selected geological environment was reconstructed by photogrammetry . According to their extensive user testing , Most students and scholars agree with the practicality of Virtual Reality Technology . They also focus on the availability of data and experience by promoting immersive technology .
Models related to planets are essentially multilevel ; therefore , One on one 3D The method of keeping the model as a whole may not be enough .VRGE (Ardulov and Pariser, 2017) Look through the surface 、 Volume grid data 、 Section viewing and surface editing solve this problem .Huang etc. (2019) Various species under the climate change scenario , It provides different perspectives and filters for retrieving information . Subjectivity 、 Artistic elements 、 The use of ornaments has always been an urgent problem in the field of vision . Especially for scientific visualization , The presentation must maintain the accuracy of the data 、 Integrity and credibility . On the other hand , Some examples use argument elements without destroying the nature of the data , Instead, enrich it by engaging . for example ,Rehme(2018) Art and film elements are used , Like shaders 、 shadow 、 Camera motion and slow motion , This brings new functions to the final product . Forest rendering (link to video demo https://vimeo.com/307417933)
Forest rendering ( Link to video presentation https://vimeo.com/307417933)
Huang J, Lucash M S, Scheller R M, et al. Visualizing ecological data in virtual reality[C]//2019 IEEE Conference on Virtual Reality and 3D User Interfaces (VR). IEEE, 2019: 1311-1312.
 The icon with the triangle pointing up represents the camera. The dashed line extending from the camera points toward the camera aim. The wireframe box represents the camera focus.
The triangle up icon represents the camera . The dotted line extends from the camera and points to the camera aiming . The wireframe indicates the focal length of the camera . Removal of the water variable and glossy shading on the pressure isosurface helps visualize the increased amplitude of the impact without an airburst.
Removing glossy shadows on water variables and pressure isosurfaces helps to visualize the increase in impact amplitude without cavitation .
A reflective shader applied to the water fraction allows light to reflect off the surface to the camera, helping to connect the viewer to the scene.
A reflective shader applied to the fraction of water allows light to reflect the surface to the camera , Help connect the audience to the scene .
Rehme M. Using Cinematic Effects to Visualize the Deep Water Impact Data Set[C]//2018 IEEE Scientific Visualization Conference (SciVis). IEEE, 2018: 82-84.
4.4.2 nanometer
With the development of advanced technology , Nanoscience has developed rapidly . In the context of nanoscience , Virtual reality has been used in Chemistry (Ferrell wait forsomeone ,2019 year )、 material science (Drouhard wait forsomeone ,2015 year )、 biomedical science (Pajorov´a wait forsomeone ,2018 year )、 Bioinformatics (Martinez and Baaden, 2020 year ;Sommer et al., 2018), Find solutions for medicine and health care (Gradl et al., 2018). Different technologies are needed to visualize and transfer the structural properties of nanostructures .
 (a) The “refvis” visualization, which consists of a heart symbol, pulsating in the rhythm of the user’s heartbeat, and the actual current beats per minute value written above it as a number. It is used as a reference visualization inspired by clinical electrocardiogram monitoring devices and presented in the central field of view of the subject. (b) The “radialvis” visualization, which consists of a circle filling time-coherent in radial sections over 20 s. For each detected heartbeat (r-peak) a line extends from the center of the circle. The length of the line and its color changes in direct correlation to the current RR-interval.
(a)“refvis” visualization , It consists of a heart symbol , It beats with the user's heartbeat , And write the actual current jump value per minute in numerical form above it . It is used as a reference visualization inspired by clinical ECG monitoring equipment , And put forward the viewpoint of the theme in the central field .(b)“ Radial ” visualization , Include 20 Time coherent Circle filling on the radial section in seconds . For each detected heartbeat (r-peak), A line extends from the center of the circle . The length of the line and its color change with the current rr Intervals are directly related . The “screenpulse” visualization, which consists of an red colored transparent texture, overlaid over the entire view of the user and fading in and out based on the user’s heart rhythm. This concept is adapted from the peripheral danger indicator visualization seen in many first-person view computer games.
“ Screen pulse ” visualization , It consists of a red transparent texture , Cover the entire view of the user , And fade in and out according to the user's heart rate . This concept comes from the visualization of peripheral hazard indicators in many first person computer games .
 The “cubegrid” visualization, which consists of a floor of cubes that bounce slightly in the rhythm of the user’s heartbeat. This visualization can be considered a predecessor of direct environmental modification biofeedback, where the final implementation would transform the virtual environments ground or floor in a similar way.
“ Cube ” visualization , It consists of a layer of cubes , These cubes will beat slightly with the rhythm of the user's heartbeat . This kind of visualization can be considered as the predecessor of direct environmental modification biofeedback , The final implementation will change the bottom or floor of the virtual environment in a similar way .
Gradl S, Wirth M, Zillig T, et al. Visualization of heart activity in virtual reality: A biofeedback application using wearable sensors[C]//2018 IEEE 15th international conference on wearable and implantable body sensor networks (BSN). IEEE, 2018: 152-155.
As an advanced method , Scanning electron microscope (SEM) Is one of the technologies , The obtained data can be transferred to the virtual environment . Transform scientific knowledge into interactive 3D VR There are several ways to format the environment . Transformation can include artistic expression 、 Direct visualization or simplification of data using techniques such as electron microscopy 3D Model . In the case of Earth Science , The different artistic features provided by the game engine are used to magnify some features of small buildings .GEARS (Horton wait forsomeone ,2019 year ) Use surface shader properties to highlight selected features of confocal microscope data . There are also different rendering techniques available for rendering . for example , Raytraced volume rendering synthesizes objects by simulating rays , Geometric rendering uses two-dimensional sections to build 3D Model .
Material science relies extensively on volume rendering . therefore , To overcome the delay , Optimized rendering algorithm is adopted . Before transferring the volume point cloud representation to the game engine , To create intuitive interaction and natural control ,Drouhard wait forsomeone (2015) Provides the use of extraction methods to reduce size and provide better optimization .
4.4.3 Medicine and Biology
Medical visualization usually consists of two-dimensional media , Such as cross-sectional images and magnetic resonance imaging (MRI) scanning . therefore , Reconstruct a 3D geometric model from a single slice (Reddivari et al., 2017;Soeiro wait forsomeone ,2016;Juanes et al., 2016). Another method is image segmentation , It helps to separate the pixels of the specified part from the overall image .Ciganek and Kepesiova(2020) This paper presents a segmentation and segmentation algorithm based on machine learning algorithm 3D Model reconstruction method . The visualization of medical or anatomical models consists of many complex sub parts (Liimatainen wait forsomeone ,2020 year ). therefore , Research and design the interface including different functions , Like a sign 、 Highlight (Marks etc. ,2017 year )、 Different colors 、 Selective visualization (Soeiro etc. ,2016 year ) And the navigator (Juanes etc. ,2016 year ). Besides , In order to solve the problem of depth perception in rendering photographic effects , Use depth of field (DOF)( Martinez and Baden ,2020 year ) And gradient shading (Usher wait forsomeone ,2017 year ) To maintain depth clues . Virtual reality can assist the diagnosis process by providing appropriate conditions . In order to reduce the diagnostic errors of Radiology Department ,Sousa wait forsomeone (2017) Designed a virtual reading room , Readers can adjust lighting and ambient light while displaying brightness .
Some studies include different methods and disciplines , Such as medical education (Huang et al., 2016), Hand recognition (Reddivari et al., 2017), Applied anatomy of smart phones (Juanes et al., 2016;Soeiro wait forsomeone ,2016) And biofeedback (Gradl wait forsomeone ,2018). Although due to image performance 、 Physical properties and VR Ease of use , Most studies use game engines , But as Elden(2017) As tested by the Institute of , Game engines may not be suitable for scientific visualization .Elden(2017) Our study includes three samples ; Arteries , Rat brain , Genome . According to the requirements of the demonstration program , Choose different presentation techniques . therefore , The study facilitated the development of guidelines . According to the Research Report , Game engine is designed for geometric visualization , Their priority is not accuracy , It's speed. , This makes the game engine unreliable .
 Figure 1.1: Left: The artery model. Middle: The Genome models. Right: The Rat Brain model
chart 1.1: Left : Arterial model . middle : Genome model . Right : Rat brain model  Figure 4.1: The genome data visualised inside the VR visualiser
chart 4.1: stay VR Genome data visualized in visualizer  Figure 4.2: The complete geometric representation of some of the larger rat brain segments visualised inside the VR visualiser.
chart 4.2: stay VR The complete geometric representation of the rat brain segment displayed in the visualizer . Figure 4.3: The geometric and volumetric artery model visualised inside the VR visualiser. The cut separates the volumetric and the geometric model.
chart 4.3:VR Geometric and volumetric arterial models visualized in the visualizer . Cutting separates the volume from the geometric model . Figure 6.9: Left: World Space. Right: Volume space.
chart 6.9: Left : World space . Right : Volume space . Figure 6.10: Each object has its own local coordinate system while they share a world coordinate system. The blue area is the view space which determines what the camera can see.
chart 6.10: Each object has its own local coordinate system , At the same time, they share a world coordinate system . The blue area is the view space , It determines what the camera can see .
 Figure 6.13: The teleportation arc at a steep (left) and shallow (right) angle. The arc can be tweaked to balance between distance and ease of control.
chart 6.13: The blinking arc is steep ( Left ) And light ( Right ) The angle arc can be adjusted , To balance distance and ease of control .
Elden M K. Implementation and initial assessment of VR for scientific visualisation: Extending Unreal Engine 4 to visualise scientific data on the HTC Vive[D]. , 2017.
4.5 Collaborative virtual reality
Collaborative virtual environment (CVEs) Provide remote collaborative interaction for various data representations , Independent of the user's physical location . In an integrated space environment , They allow users to use different information channels for training 、 Review and discuss (Churchill and Snowdon, 1998). Former cve Including information visualization 、 Teleconferencing 、 Simulation and social events . In the design cve when , The most commonly used technologies are large immersive spatial displays and virtual environments (VEs), Such as cave and hmd. These technologies have many differences , For example, resolution 、 Existence and freedom of movement .Cordeil wait forsomeone (2017b) Conducted a user study , It includes a series about 3D The task of network visualization , To compare VR Tasks on the platform . Based on the results , Although there is not much difference in accuracy and experience , but hmd Provides faster interaction . therefore , Compared with expensive cave facilities , modern hmd It is more suitable for immersive visualization .CVEs The purpose of is to provide enjoyment 、 Social and existential , This is good for cognition .
Collaborative environments are designed to connect multiple users more naturally , And increase the awareness of users to break the isolation . The environment can require participants to be in the same location or remote , And present different levels of interaction , Such as symmetry or asymmetry . Due to the limitation of network , Cooperative research is desirable . However , They enhance people's interaction in a single space , Limit VR The opportunity of . Asymmetric applications do not offer the same interaction possibilities to all participants . for example , When a user uses VR When interacting with the head mounted display , Another user may experience through the traditional screen VR. The interdependence between users is inseparable from the special needs of visualization . therefore , According to the visualization and collaboration mechanism , Different degrees of asymmetry can be used in settings . The use of different devices has produced visual asymmetries . According to the role of participants , This asymmetry caused by hardware differences may be a conscious design choice . for example ,ShareVR (Gugenheimer wait forsomeone ,2017a) Provides an experience , In this experience , Not HMD and HMD Users can interact with each other , And interact with the environment . They implemented several cases to build common positioning asymmetry VR Experience guide . According to their research results , Shared physical space and physical interaction enhance the experience , And for VR and VR Games provide a new way of interaction .
Another important interactive decision is the determination of viewpoint . For collaborative environments , This decision can be divided into two parts . The first step is to determine the user's position in the scene , The second step is to determine the independence between users . Although it is generally preferred to use only one shared view “ What I see is what you see ” principle , But the environment can request or provide multiple views for different users synchronously or asynchronously . for example ,PlottyVR (Brunhart-Lupo et al., 2020) It consists of various statistical tools and libraries , Provides countless visualizations . Providing multiple viewpoints for different users enables each user to take advantage of different types of visualization . In some cases , Environment promotes asymmetric collaboration and multi viewpoint .Ibayashi wait forsomeone (2015) This requirement is pointed out in the design and architecture , A new method named “Dollhouse VR” The system of , The system includes a multi touch desktop device for the operating environment and a hmd.Xia wait forsomeone (2018a) Created a scene editing tool to support collaborative workflow . This is called Spacetime Our tool introduces three interaction concepts , Enable users to easily manipulate the environment : Containers 、 Parallel objects and avatar objects .
Companies that take advantage of telecommuting have also achieved virtual reality , To benefit from the interaction possibilities that existing communication tools cannot provide . therefore , Business virtual tools for teamwork have emerged , Such as VISIONxR (Xia wait forsomeone ,2018b). It allows multiple users in multiple locations 、 Used on multiple devices . These virtual platforms are designed to improve quality and efficiency , And create environment options and interfaces that are easy to adapt . In terms of expression and communication , Virtual collaboration is still not as effective as sharing the same physical location , Including voice gaze 、 gesture 、 Facial expressions or body movements . according to Fussell and Setlock(2014) That's what I'm saying , In a virtual environment , Visual action is more important than speaking . therefore , To convey information , Provide more effective and efficient communication , Virtual images and gestures have been used in virtual environments to replace expressions belonging to the physical world . In order to increase the sense of co existence of entities ,Amores wait forsomeone (Amores wait forsomeone ,2015) Propose an immersive mobile platform ,ShowMe. Use depth sensors and cameras , Users can see their gestures and hands , Thus, it is easier to cooperate to complete a physical task .
VR The device requires hardware ; therefore , A collaborative environment is not made up of one world, but of multiple worlds , Each world corresponds to one user . This situation produces two types of users ; Authorized users and connected users . Although authorized users can directly control the world through local machines , But the world of connected users is constantly synchronized . This separation is Hoppe wait forsomeone (2021) Proposed ShiSha An opportunity , It uses shifted but shared perspective modification for remote virtual environments . therefore , It allows users to observe from the same angle , At the same time, they can see the virtual avatars of others in their own virtual world . Allowing multiple users to share a virtual space requires a personal virtual representation . Another work that emphasizes the potential of virtual image visualization is the multi-user cell arena (MUCA), among (Bailey wait forsomeone ,2019 year ) Provide customizable virtual images . Embodied in many social VR The basis of experience , And have a positive impact on existence . Customizable virtual reality characters may increase the sense of belonging .
4.6 Training and simulation
Virtual reality technology provides people from different industries with the ability to deal with complex situations , And prepare for their role in the real environment . It has become a soldier 、 Doctor 、 Essential training tools for drivers and pilots . Besides , It is also used for patient rehabilitation and disaster management . according to Ott and Freina(2015) That's what I'm saying , Use VR The main motivation of is that it can provide hard access 、 Experience of a problematic or dangerous background or environment .Mikropoulos and Natsis A review of the research on (Mikropoulos and Natsis, 2011) According to the report , Compared with other systems ,VR More advantages , Because it only has a sense of existence and dynamic 3D Content , This has a positive impact on learning . Most of the research on training focuses on medicine (Chang and Weiner, 2016)、 Security (Xu et al., 2017;Jeelani wait forsomeone ,2020a), Industry (Grabowski and Jankowski, 2015), And crisis and emergency management (Ronchi wait forsomeone ,2016;Kwok wait forsomeone ,2019;Molka-Danielsen wait forsomeone ,2015; And rehabilitation (Joo wait forsomeone ,2020 year ;Yates wait forsomeone ,2016)
 Figure 3
Virtual reality-based rehabilitation system on the burned hand of a study patient: (A) antero-posterior view (B) lateral view.
chart 3
Study the virtual reality rehabilitation system of burned hands :(a) Front and rear view (B) Side view .

Figure 4
Volitional movements in the virtual reality-based rehabilitation system: (A) finger flexion/extension, (B) forearm pronation/supination, wrist flexion/extension.
chart 4
Will movement in virtual reality rehabilitation system :(A) Bend and stretch your fingers ,(B) Forearm pronation / Supination , Wrist flexion and extension .
Joo S Y, Cho Y S, Lee S Y, et al. Effects of virtual reality-based rehabilitation on burned hands: a prospective, randomized, single-blind study[J]. Journal of clinical medicine, 2020, 9(3): 731.

Exemplary representation of the emergency exit portal within the VR environment
Typical representative of emergency exits and entrances in virtual reality environment
 Example of the emergency exit portal view in the VR environment
VR Example of emergency exit portal view in environment
Ronchi E, Nilsson D, Kojić S, et al. A virtual reality experiment on flashing lights at emergency exit portals for road tunnel evacuation[J]. Fire technology, 2016, 52(3): 623-647.
Because virtual reality training scene mainly involves computer-generated three-dimensional graphics , Therefore, 3D modeling is of great significance in the creation of virtual training environment . Developers have several options for creating related content . senior 3D Modeling software , Such as 3ds Max, Rhinoceros, Maya and Blender, It provides developers with the opportunity to create realistic environments . Besides these tools , Game engine and 3D The asset storage of the model library also presents various options . The reusability and customizability of the three-dimensional model reduce the cost of the system . In order to achieve the high level of immersion and presence necessary for the training environment , Artificially generating actual information requires stimulating the main senses . therefore , In order to maintain a completely immersive experience , We use stereoscopic display 、 Motion tracking hardware and input devices . Mainly Nintendo Wii Balance plate 、 SONY Playstation Move And Microsoft Kinect The release of somatosensory controllers developed by game developers has promoted the evolution of training . With the contribution of additional equipment ,VR The training field is expanded to dance training 、 Aircraft control 、 Rehabilitation, etc . The research of virtual reality in practical application has produced new terms , Such as virtual factory , It is a simulation model composed of many sub models , To represent the unit of a factory . This integration provides a plan 、 Product improvement 、 Effective planning stage 、 Decision support 、 Testing and system control . In the industrial 4.0 In the background of , Automotive engineering 、 Aerospace Engineering 、 Different visualization technologies are used in mechanical engineering and medicine 、 Dynamic virtual models and simulation types , Such as discrete events or 3D motion simulation .VR Training is usually better suited to the medical field , Because it can provide emergency management 、 Cost effectiveness 、 Task recursion , And remote surgery training ( Because physical programs require tactile devices ).
In order to manipulate virtual objects through tactile devices , In addition to geometry based modeling , Medical processes also need physics based modeling to simulate deformable objects (Escobar-Castillejos wait forsomeone ,2016). However , The animation of deformable objects in virtual reality environment is still a challenging problem , And the effective virtual object interaction method based on physics needs computational complexity . The physical interaction with virtual objects needs to be truly simulated , To convince people . This is particularly important for training scenarios that require detailed hand interaction , For example, surgical training . The actual hand movement will lead to unstable results of the physical engine , This leads to interpenetration . In order to avoid the complexity and error range of the simulation process , Most interaction methods have been simplified .
lately , Virtual reality has begun to replace traditional rehabilitation methods . The proposed method of transformation integrates various assumptions from different fields . for example , Based on the hypothesis of neuromotor rehabilitation , Rehabilitation game system (rehabilitation Gaming System, RGS) And personalized training modules (Personalized Training Module, PTM) Together, game development and design , Used to adjust task difficulty . According to the expected results , Rehabilitation requires specialized visualization techniques . for example , In the development of motor function consciousness , Vision can provide feedback , And neuromotor rehabilitation may also depend on movement and environmental visualization (Tsuji and Ogata, 2015). To meet these needs ,TRAVEE (Voinea et al., 2015) It provides... For neuromotor rehabilitation 3D Scene and friendly interface , The process of positively influencing users .
An emergency is an accident that requires a rapid and effective response . In order to improve human behavior under man-made and natural disasters , Simulations such as hurricanes and floods for analysis and control , Fire safety , And earthquake simulation to evaluate human perception and behavior (Gamberini wait forsomeone ,2015) Has been designed and used . For successful pre evacuation or action , Evaluation and response time are key factors . Simulations of different emergencies provide expectations for the assessment of the situation 、 The improvement of consciousness and action time and behavior . for example , according to (Rosero, 2017), Most participants presented unsuccessful fire growth estimates . The learning method and essence of virtual environment make interaction a basic feature , Including multi-faceted features such as operation and navigation . In addition to these features , Personalized methods and adaptive technologies should be preferred , To improve the effectiveness of training based on virtual reality (Jeelani wait forsomeone ,2020b).
Although virtual reality based simulators are improving cognitive and psychomotor skills 、 It has advantages in helping users control their emotional reactions , But due to airsickness and technical challenges , There are still problems in training individuals for high-risk industries . aviation 、 fire 、 military 、 Medicine and manufacturing require a high degree of realism to achieve a certain degree of success . Simulators may not be able to effectively represent uncertainties that lead to an overly simplified training environment . Another problem is , Simulators are developed by software developers , In most cases, they are not experts on the selected topic . therefore , The research of this branch mainly focuses on these problems .Vahdatikhaki wait forsomeone (2019) It is criticized that most building training simulators are unrealistic due to static on-site performance . Their framework provides four stages ; Context capture 、 Context generation 、 Context - User interaction and context based evaluation . Although this process is proposed for building site simulation , But it applies to a wide range of situations , Need context realistic environment . Besides , The ease of use and reason behind the widespread use of game engines are near real achievements , Especially particle system tools . Through the study of fire simulation , One thing is for sure , The real diffusion and diffusion process of smoke is very important . Smoke visualization requires high computer performance and a high level of realism , This can be provided through the game engine .
Take advantage of the game engine ,Shamsuzzoha wait forsomeone (2019) A framework is proposed , It includes five stages from database to industrial training and Maintenance Evaluation . Their prototypes include small maps 、 Flashing attention exclamation point 、 Realistic visual effects and IOT screens that interact with the system , These visualization preferences make interaction and information flow possible .
4.7 Web Virtual reality
Web Services have become the main data source , Provide access to information anytime, anywhere . However , Web browsers have limitations in many cases , Most studies have focused on addressing these limitations . Due to the rendering ability of the browser , To achieve large-scale 、 Real time visualization requires a lot of work .Yan wait forsomeone (2020) Different online real-time fire training technologies are used to solve this problem . They prefer to download data gradually when the viewpoint changes , And convert the virtual character into a lightweight version . They used a method called “ clone ” Rendering technology . On site visualization or processing , That is, the technology of real-time visualization of data during simulation generation , By using . therefore , Storage resources are not involved ; This is the natural solution for data transmission . Because it is generated in real time , Users can interfere with the analysis of immediate effects .VRSRAPID (Mascolino wait forsomeone ,2019)web Applications use extensible 3D Virtual reality model (X3D) Conduct interactive scientific computing . It is a collaborative and interactive environment designed for nuclear systems that support real-time simulation . Traditional nuclear modeling and simulation tools are mostly based on deterministic or statistical methods . Deterministic solutions are memory intensive , It needs a lot of computing resources . On the other hand , Statistical methods , Such as Monte Carlo method , It may lead to statistical uncertainty .

The roadmap of Technology
Technology Roadmap

Comparison of an interior scene of subway station before and after lightweighting
Comparison of the internal scenes of the subway station before and after lightweight

Extracting an exterior shell from a building
Take a shell out of the building

A subway interior is partitioned into six subspaces
The interior of the subway is divided into six sub spaces 
Online interactive Web3D Visualization of massive escaping passengers
Online interactive Web3D Visualize mass fleeing passengers

Lightweight preprocessing of heavy FDS smoking volume field
heavy FDS Lightweight pretreatment of smoke field 
Unifying the volumetric smog density into 28 opacity levels
Unify the volume haze density as 28 Opacity levels 
Self-adaptive smog LoD for Web3D Rendering
Adaptive haze LoD be used for Web3D Rendering 
Roadmap of trace-clustering subway evacuation path planning (TC-eACO)
Trajectory clustering subway evacuation path planning roadmap (TC-eACO)
Online collecting subway evacuation of virtual passengers via glasses
Collect subway evacuation virtual passengers online through glasses  Preprocessing of online subway escaping traces of four cases: (a) reserve all the valid traces that have successfully reached some exists within the specified threshold; (b) delete the traces that have failed to reach the exits; delete the wandering traces over the specified length threshold; (d) smooth the invalid traces containing redundant trace; (e) smooth the invalid traces containing loops
Preprocess the escape traces of online subway in four cases :(a) Keep all valid traces of successful arrival , Exists within the specified threshold range ;(b) Delete the trace of unreachable exit ; Delete roaming tracks that exceed the specified length threshold ;(d) Smooth invalid traces with redundant traces ;(e) Smooth invalid tracks with loops 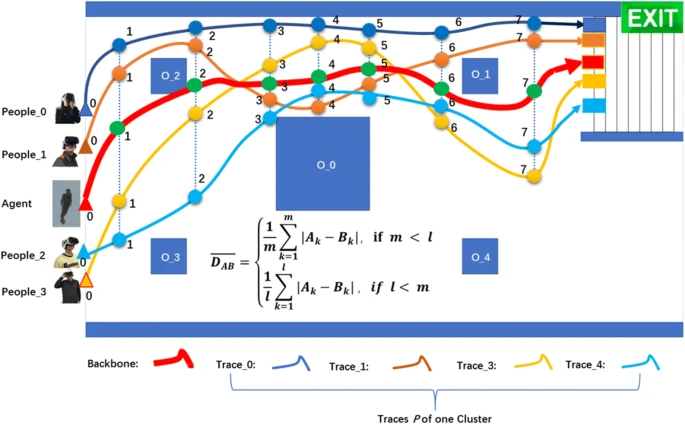
Backbone extraction
Skeleton extraction

Online Web3D Visualization of 1000 virtual Passengers
On-line Web3D visualization 1000 A virtual passenger 
Sprite texturing particle based real time rendering of a smog scenario at the Web browser
stay Web Browser based on haze scene Sprite Real time rendering of texture particles

The visual evacuation process of 1000 agents in a subway station under the TC-eACO algorithm
TC-eACO Subway station based on Algorithm 1000 Human visual evacuation process
Yan F, Hu Y, Jia J, et al. Interactive WebVR visualization for online fire evacuation training[J]. Multimedia Tools and Applications, 2020, 79(41): 31541-31565.
In order to establish an accurate 、 Real time model , They use RAPID Code System, And generate X3D Model . In order to explore the visualization method of health data ,Hadjar wait forsomeone (2018) A method using multiple libraries and a a Framework framework prototype application .Web Analysis includes charts 、 graphics 、 Chart 、 Animation integrated into visualization system , And other visualization technologies . Use a - frame Allows developers to create interactivity based on raycasting and animated objects , So as to effectively interpret the cube .
The library allows users to build by mapping datasets obtained from external sources 3D visualization . follow Shneiderman The curse of , be based on web Of ExplorViz (Fittkau wait forsomeone ,2015) The tool presents a software city metaphor , With translation 、 rotate 、 The zoom 、 Select and reset gesture recognition for tasks .Vria (Butcher wait forsomeone ,2019 year ) Prefer to use 3D Bar chart for data exploration and analysis , Because they are very simple . With based on VRGIS The increasing importance of the network environment ,WebVRGIS engine (Lv wait forsomeone ,2016) Publish for data 、 transmission 、 Multi user use and solution P2P Technical issues provide support . Spatial analysis requires large-scale 、 Three dimensional visualization of multi-source urban landscape . Due to the amount of computation and memory requirements , It is very troublesome to draw a large amount of data in real time . They used an interactive rendering system and visual optimization technology , Texture mapping 、 Automatic level of detail 、 Occlusion culling and frustum culling solve this problem . On the basis of this work ,Li wait forsomeone (2016) Put forward to use WebVRGIS The engine analyzes and visualizes real-time dynamic traffic data . As we have understood in the previous sections , Most scientific visualization relies on volume visualization , Especially in medical research . In order to be in VR Visualization in 3D Grid and volume data obtained by medical scanning ,Kokelj wait forsomeone (2018) Developed a system based on web Applications for . utilize Med3D Rendering pipeline of the frame , They used volume ray projection technology , This technique uses output images to perform calculations .
NeuroCave (Keiriz wait forsomeone ,2018) It is a visual analysis tool , Provide interactive methods and visual options for exploration . It allows users to use color schemes to distinguish regions and their functions . They didn't use realistic rendering methods , Instead, different Platonic entities are used to build connectors . To simplify the rendering process ,ProteinVR (Cassidy wait forsomeone ,2020) Use game style camera movement , Where the object is stable , Only the camera can move . therefore , They can use pre computed shadows and textures to improve browser performance .
4.8 game 、 Visualization and VR
Video games are collections of information , It is widely dependent on the presentation of information containing various attributes , These properties will change as the state changes . With a lot of data , Games played in the digital world are more complex than those played in the easy to understand physical world , There are different needs . For generations , Data visualization has been used in games , To create continuous communication . Although the visualization component in the earlier game is more direct , It is usually used to transmit play data , But they are used in many situations in modern Games . Histogram and tree graph related to information visualization are widely used in games ; However , In particular, there are differences in the implementation of entertainment . In addition to the implementation details , The application of virtual reality in the video game industry has also generated a demand for more fundamental differences . Although the pioneers launched commercial virtual reality video games , Sega VR And Nintendo's virtual boy , But they are 90 The S is considered unsuccessful . This process begins with 2016 year , Then various products were launched , Such as Gear VR (Oculus)、HTC Vive (HTC and Valve)、PlayStation VR( Sony interactive media ) And Samsung Gear VR, It has achieved great success by providing major novelty for video games .
The difference between virtual reality games and traditional electronic games lies in the degree of immersion and the type of interaction with virtual content . Reducing the level of connection between the external world and including body and hand movements provides an innovative gaming experience , This requires new technologies to visualize the virtual world . Interaction doesn't just happen in HMD Between users , and co - locate Participants can also interact .VR game ShareVR (Gugenheimer wait forsomeone ,2017b) Provides HMD He Fei HMD Asymmetric interaction between users . Recent visualization studies include additional interface functionality 、 Adaptive tips 、 Context sensitive tutorials and new methods of player navigation . In order to make VR In the game 3D Easier to operate ,Rachevsky wait forsomeone (2018) It is proposed to graphically present the player's gesture as a part of the interface . according to Polys and Bowman That's what I'm saying , Rather than focusing on practicality , Visualization in games should be functional and enjoyable . The framework they developed proposes five elements for identifying visualization techniques : Main purpose 、 The target audience 、 Time use 、 Visual complexity and immersion .
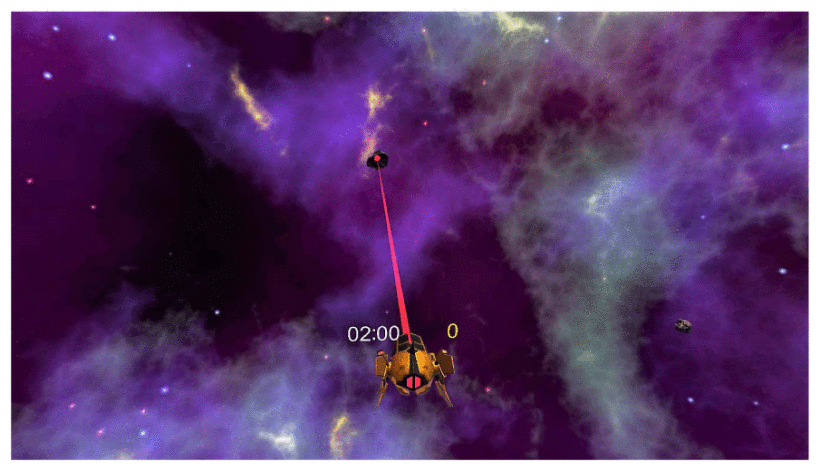 Screenshot of the developed game, with the player located at the center and the aim touching an asteroid.
Screenshot of the developed game , The player is in the center , The target touches an asteroid . Two ships, one moving towards the lower left corner of the screen with blue trace, and the other moving towards to top edge of the screen with a red trace. The player is located at the center, with blue target aim.
Two ships , A ship moves towards the lower left corner of the screen with a blue track , The other one moves towards the upper edge of the screen with a red track . Players are in the center , The blue target aims . Participant playing on HMD with the Rift touch control.
Participants in HMD Play Rift Touch . Participant playing on PC with keyboard and mouse.
Participants in PC Play games with keyboard and mouse on .
Rachevsky D C, de Souza V C, Nedel L. Visualization and interaction in immersive virtual reality games: A user evaluation study[C]//2018 20th Symposium on Virtual and Augmented Reality (SVR). IEEE, 2018: 89-98.
4.8.1 Visual realism and sense of existence
Slater et al (2009) Proposed the division between realistic components , Such as geometry and lighting . Geometric realism considers the characteristics of virtual objects , Lighting realism considers the convenience of lighting . Most of the existing research and discussion are based on Slater The illusion of place in virtual reality (PI) And specious illusion (PSI) As well as the sub components of geometric realism and lighting realism . Slater argued about people's reactions , According to the credibility of events and places, two kinds of illusions are defined .VR In the game PI The mechanism is dedicated to presenting game objects and fields, so as to increase the sense of existence .PSI The mechanism provides convincing game events and activities , At the same time, players actively participate in the broad vision of the simulated environment . Except for vision ,VR The system should also provide auditory and tactile displays , To effectively maintain PI and PSI.PI and PSI The degree of impact can vary according to the main objectives of the environment . for example ,Lynch and Martins(2015) The research investigated immersive VR Fear experience in the game . Then the fear factors are further classified , And determine the strategies and responses to fear factors . According to their research results ,PSI Element ratio PI The fear response level caused by elements is higher . Another study is based on Slater complement (Hvass et al., 2018) The works of , Suggestions for visual realism effects . Participants' physiological measurements and self-report results showed , A higher degree of geometric realism will induce a stronger sense of existence and emotional response .
 Screenshots of the kitchen (left) and living room (right) as they appeared in the condition involving high geometric realism.
The kitchen ( Left ) And the living room ( Right ) The screenshot of appears under the condition of high geometric realism . Screenshots of the ves used for the study: low geometric realism (left) and high geometric realism (right).
For research ves Screenshot : Low geometric realism ( Left ) And high geometric realism ( Right ).
Hvass J, Larsen O, Vendelbo K, et al. Visual realism and presence in a virtual reality game[C]//2017 3DTV conference: The true vision-capture, Transmission and Display of 3D video (3DTV-CON). IEEE, 2017: 1-4.
4.8.2 Game data
Text format data related to game play is processed and presented through graphical representation , Enable users to absorb these data . According to literature survey (Sevastjanova wait forsomeone ,2019;Wallner and Kriglstein, 2013) Game play data 、 Chart 、 Thermogram 、 Different types of mobile visualization 、 Self organizing map (SOMs) And node link representation is the most commonly used type . Choose the most effective according to the information you want to represent 、 The most convenient method is a crucial step . Although they can be explained in different forms , But charts and graphs are more suitable for immediate needs than exploratory tasks .
according to Kriglstein(2019) Classification research of , There are two ways to collect gameplay data . We can collect observation based data by observing player interactions or questionnaires and interviews , This helps developers understand the motivation of players 、 Behaviors and preferences . Data can be automatically collected through the developed media . One of the main differences between these methods is , The first method provides qualitative results , The second method produces quantitative data , This makes it easier to visualize . Data can be spatial 、 Not spatial or temporal .Kriglstein(2019) According to task and data type , Six different categories are proposed : Compare 、 Distribution 、 Relationship 、 Time 、 Space and flow .
As far as we know , Unfortunately , At present, there is not enough research to establish a specific understanding for the visualization of game play data in virtual reality . Visualization research related to game play data presentation mainly focuses on traditional electronic games . Due to the unique needs of game data , Taxonomies and technologies built for information visualization cannot adapt to this change .
4.8.3 Game Analysis
Increasingly complex games and users need new areas , Instead of the traditional method , Such as user testing 、 Game testing 、 Surveys and videos to assess player behavior . The designer 、 The programmer 、 Marketer 、 Executives and players are using game play data in different ways and for different purposes . Using visualization is an inevitable choice for comprehensive analysis of data . Although information visualization technology is used , But video games provide a new direction of analysis for different audiences with unique visual experience .InfoVis The community has defined systems for data analysis , The analysis is not only the focus , Such as “ Visualization of leisure information ”(Pousman et al. 2007)—— It belongs to this category , Environmental Science 、 Social and artistic information visualization has been criticized as inefficient . Visualization combines games with data analysis , Information considered interesting .Medler and Magerko(2011) Propose to broaden Playful InfoVis Scope and function of .
because VR The nature of , Analysis has become VR An important part of the game . Analysis by providing real-time information 、 Fine tune through the presented data 、 Find problems in the design stage 、 Understand the player group 、 Player stickiness level and game style , Help developers improve performance . The same as game play data , The field of immersive visualization also does not study game analysis . In particular , Game Analysis Visualization generated for traditional environments can be used in immersive environments in the field of information visualization .
4.8.4 Gamification and Gamification concepts
Even though “ Gameplay ” It's not a new concept , But it has always been considered a controversial term , Similar terms continue to appear in the game community .Deterding wait forsomeone (2011) take “ Gameplay ” Defined as the use of game design elements in a non game environment . In the subsequent investigation ,Seaborn and Fels(2015) Define Gamification as “ Deliberately use game elements or game experiences that are not game tasks and situations ”. Gamification uses things like points 、 Unlock 、 achievement 、 Ranking List 、 checkpoint 、 Virtual props 、 Mission 、 role 、 collect 、 Game elements such as competition or cooperation in non game applications to strengthen user motivation . On the other hand , Serious games are designed for non entertainment purposes . Previous studies have confirmed , In the citizen science game , Visual attributes will affect users' motivation (Curtis, 2015;Miller wait forsomeone ,2019 year ).EyeWire (Tinati et al., 2017) It is a game based citizen science platform based on the Internet , It encourages users to transform complex tasks into more manageable tasks in a game environment .
According to a study (Tinati et al., 2016), Ranking List 、 Personal points 、 Game elements such as customizable characters and visual devices can improve user stickiness .Foldit (Curtis, 2015) Is another citizen science game , This is a puzzle game , Visualization of molecules containing protein folding . Game data analysis display of view option settings , There are significant differences between experts and novices in the visual selection of tasks (Miller et al., 2019).
With the help of VR、AR and MR technology , Data visualization has changed from passive exploration to more interactive exploration . Combine the interactivity of game design concepts with data visualization , It can reduce cognitive overload , At the same time, let players immerse in the content . So ,Wanick wait forsomeone (2019) Two case studies on orbital visualization of scientific data and visualization of earth data are provided , They combine game design concepts and data worlds with VR Combination of Technology . In order to test VR The usability of game interaction in the field of Science ,Bergmann wait forsomeone (2017) Developed suitable for VR Particle physics of game interaction technology 、 Visualization in biology and medical imaging . They reported that , Even though VR The game strategy includes some difficulties , Such as simulated disease , But they offer countless opportunities , It also provides a high degree of immersion in the field of Science .GamefulVA (Sevastjanova et al., 2019) It is proposed to cultivate motivation by combining game design concepts with visual analysis .
 Figure 2: A virtual visit on the KATRIN detector platform. In the foreground the target gizmo (light blue circle) pointing to the next teleport location.
chart 2: Yes KATRIN Virtual access to the detector platform . In the foreground , Target gizmos ( Light blue circle ) Point to the next transfer location . Figure 3: 3D view (left) and 3D explosion drawing (right) of the weevil Trigonopterus vandekampi.
chart 3: yellow Trigonopterus vandekampi Weevil 3D View ( Left ) and 3D Exploded view ( Right ). Figure 4: The teleporter in the entomology virtual lab.
chart 4: Transmitter in entomology Virtual Laboratory . Figure 5: Grabbing and investigating the beetles leg in detail. As visual feedback of the user hand position a robot hand is displayed in the virtual world by the UE4 VR blueprint template.
chart 5: Catch and investigate the details of the beetle's legs . As the visual feedback of the user's hand position , The robot's hand passes UE4 VR The blueprint template is displayed in the virtual world .
 Figure 6: A virtual USCT image viewer: segmented 3D mesh in the foreground, the original image slice behind the table in the background in poster size.
chart 6: A virtual USCT Image viewer : Segmented in the foreground 3D grid , The original image is sliced into the background behind the table , The size is poster size .
Bergmann T, Balzer M, Hopp T, et al. Inspiration from VR Gaming Technology: Deep Immersion and Realistic Interaction for Scientific Visualization[C]//VISIGRAPP (3: IVAPP). 2017: 330-334.
Another type of game that combines video games with other fields is sports games .Exergames It aims to combine physical exercise with video games , Players are required to exercise according to the game mechanism . In addition to using Wii Remote And Microsoft Kinect Non immersive sports games played by sensors and other controllers , And something like that. 《Ingress》 and 《 pokemon Go》 And other popular games that encourage physical activity . With recent developments ,VR Become more efficient in terms of user stickiness and performance . therefore , Video games are transformed into VR Format , New games that require body movements have also come out , Such as 《 Fruit ninja VR》、《 Hot squat 》、《 Holographic dot 》、《 Portal story :VR》 etc. . According to an evaluation study (Gugenheimer et al., 2017b), Virtual reality games reduce the effort of perception , Encourage people to exercise more . except VR In addition to the direct opportunities provided , Some studies also focus on personalization and the difficulty of adjusting adaptable interfaces , To keep players immersed . Visualization of physical activity , Different strategies have been proposed . In a HappyFit In the display of abstract information , They prefer to use color 、 Shape and metaphor to keep Abstract 、 Non intrusive and positive visualization , To provide consistent information and maintain player participation . The main purpose of this strategy is to encourage short-term and long-term sports activities by raising awareness , And produce a personal reaction .
4.9 Design considerations and user interaction
This part of this article aims to explain the importance of evaluation methods and results , And provide suggestions for design considerations for previous studies . The field of visualization tends to rely on unproven but solid assumptions .Kosara(2016) Define this situation as “ An empire built on sand ”, And through his research, he explained , Even the most commonly used assumptions about visualization can be wrong . Repeatedly questioning and testing hypotheses to obtain evidence is critical to creating a solid foundation for development and evolution (Kosara, 2016). Collective responsibility as a community , Hundreds of authors can be found in the literature , They used and developed various metrics 、 Taxonomy and typology , Put forward guidelines , And create a model for the multi-level understanding process behind , And evaluate different aspects of visualization .
4.9.1 Visual perception
Although perception is VR Has been widely studied , But new cognitive challenges are still emerging . These challenges include not only depth and distance 、 shape 、 size 、 Color and contrast, etc 3D Visualization features , It also involves hardware related issues . Human three-dimensional visual perception is closely related to depth perception , Depth perception can also define the effectiveness and comfort of 3D visualization (Dede, 2009). Visual cues are 3D Provide depth perception in the environment , If occluded 、 rotate 、 Shadows and shadows . Watch from multiple angles 3D Visualization enhances the understanding of data . Unfortunately , The rotation aspect is not applicable to data in text format . according to Bertin(1983), Human visual perception can be described as three levels . Single element 、 A group of elements or an entire image can be the focus . Focus on supporting users to complete specific tasks . According to the density of the data , The way to convert the original data should be conducive to the user's ability to focus . To achieve this , Methods can include visual attributes , Such as color 、 Location 、 size 、 Shape and Technology , Such as different perspectives or clusters .
Visual perception in virtual environment usually uses Gibson From the perspective of theory .Gibson(1977) Pointed out that , The environment provides actors with different possibilities of action , Called visibility . According to this view , Actors coexist with the environment , Perception is directly related to action . From this point of view , Researchers studied different situations 、 Visibility perception of height and depth perception .Cliquet wait forsomeone (2017) Analyzed in VR Visual perception when standing on an inclined surface , And consider the influence of different materials . According to them in VR The experimental results in , Although participants could identify the angle suitable for upright posture , However, the approximate critical angle of the upright posture determined by the participants is lower than the research results in the real environment .Nagao wait forsomeone (2018) An infinite stair demonstration interface with passive tactile slats and markers is designed , To increase the sense of presence and riser height . later , To test the height perception when moving ,Asjad wait forsomeone (2018) An infinite staircase is designed for the virtual environment , It shares precise dimensions with stairs in the physical world . According to their research , Virtual shoes have a positive impact on the sense of existence and error estimation .
 Figure 1: Three decades of various immersive analytics systems using CAVE [43], stereoscopic [4], or Head Mounted [15] Displays.
chart 1: Used for 30 years CAVE[43]、 Three-dimensional [4] Or head worn [15] Various immersive analysis systems of the display . Figure 2: IDEA project preliminary developments. Users have roller chairs with tablets, they can either sit, stand, or walk to explore and interact with the data environment, so as to make maximal use of embodied perception and action.
chart 2:IDEA Preliminary development of the project . Users have wheelchairs with flat panels , Can sit 、 You can stand 、 You can go , Explore and interact with the data environment , Maximize the use of embodied perception and action .
Cliquet G, Perreira M, Picarougne F, et al. Towards hmd-based immersive analytics[C]//Immersive analytics Workshop, IEEE VIS 2017. 2017.
4.9.2 motion
It is always a challenge to maintain the effective navigation of users in the virtual environment . Although the most natural virtual motion technology is to directly map the user's physical motion , But due to the limitation of physical space , Different sports techniques have been provided .
Teleportation is a mobile technology , Users are usually required to aim at the target location in the virtual environment . Although it overcomes the limitation of space , It provides users with a multi-user travel experience , However, due to teleportation, users' spatial discontinuity , May cause confusion and lack of continuous feedback . To solve this problem and maintain communication between users ,Thanyadit wait forsomeone (2020 year ) Considering the time efficiency 、 traceability 、 Intuitive and recognizable , Four different visualizations are proposed : Overhang 、 jumping 、 Fade and portal . The performance of these actions is designed to create a traceable visualization , Provide feedback to other users , To avoid confusion . Traces and other clues help users understand their location , Reduce the cost of spatial cognition .Cherep wait forsomeone (2022) A study was conducted , To understand the impact of teleportation interface on different individuals . Their results show that , Interface design and individual differences create different cases of spatial cognition , And related to these parameters , User perception of location changes . This study points out the importance of defining the target audience and understanding the impact of design choices in an immersive environment .
 Figure 1: The common line visual cues for teleportation.
chart 1: Common visual clues transmitted .
 Figure 2: Proposed teleportation visualizations: (a) Hover SV,
(b) Jump SV, Fade SV, and (d) Portal SV
chart 2: Suggestions for visualization of teleportation :(a) Hover SV,
(b) jumping SV, Fade out SV, (d) Portal SV
Thanyadit S, Punpongsanon P, Piumsomboon T, et al. Substituting Teleportation Visualization for Collaborative Virtual Environments[C]//Symposium on Spatial User Interaction. 2020: 1-2.
4.9.3 Interaction
Immersive technology brings many new challenges to researchers . Interactive technology can make the experience easier or cumbersome . Meaningful interaction between the audience and the visual data enhances the immersion of the virtual world , The audience can see the data and explore different aspects . Research has produced countless VR Interaction technology , If you choose 、 Operation and movement . Researchers are looking for creative ways to interact visual tasks with data .
Onorati wait forsomeone (2018) Developed immersive bubble chart , Especially getting information from unstructured data . Their work includes sorting bubbles , Individual bubbles can be semantically grouped , And allow users to explore data through words . stay Unity The experience designed in allows users to crawl 、 The zoom 、 Delete and merge bubbles , And track previous views .Rachevsky wait forsomeone (2018 year ) Developed a first person shooting game (FPS), Both are applicable to HMD, It is also suitable for non immersive games using displays and traditional control methods , And tested different versions of the game . The free targeting version has better effect than the immersive version , Because users use the keyboard to move the camera in the free aiming version , The fixed aiming version has a better effect on the non immersive version . In terms of ease of use , The results of immersive games and non immersive games are different , They agreed that immersive games need more natural and intuitive interaction . Figure 1. The Immersive Bubble Chart for the use case: (a) View of the five main category bubbles: who, how, what, when, and where. (b) View of the individual bubbles in the place category. Breadcrumb on the wrist with the path of explored views.
chart 1 Shown . Immersive bubble chart of use case :(a) View of five main categories of bubbles : who 、 how 、 what 、 When and where .(b) View individual bubbles for local categories . Crumbs on the wrist , There is a path of explored views above .
Onorati T, Díaz P, Zarraonandia T, et al. The Immersive Bubble Chart: a Semantic and Virtual Reality Visualization for Big Data[C]//The 31st Annual ACM Symposium on User Interface Software and Technology Adjunct Proceedings. 2018: 176-178.
4.10 comparative study
Design and implementation decisions are important for data representation . This process starts with raw data , Until it forms its final form , Many choices need to be made . New technology 、 The emergence of new technologies and ideas requires continuous analysis to create a specific background . Unfortunately , Immersive visualization lacks standard guidelines . To prove the rationale behind this preference , Researchers conducted a comparative study . In user experience testing , Immersive technology means specific results . Choose immersive visualization over traditional visualization , Need to pass a threshold requirement . This threshold is closely related to user experience and technology acceptance, which are widely studied in human-computer interaction . for example ,Shrestha wait forsomeone (2016) by CAVE The environment has rebuilt the historical sites of Nepal , And with Paper-Based artifact Compare . It turns out that , Participants in VR It is difficult to solve complex problems in . This kind of struggle may be the cause and result of the resistance caused by unaccustomed to new technology .
Ren and Hornecker(2021) Conducted a user study , Compare virtual and physical data representations by creating two equivalent representations of the same data set for physical and virtual environments . This study shows that , Although Physicalization helps to reduce reaction time , But because of VR lagging , Participants tend to be in VR Move slowly in the environment , This affects the quality of the experience . according to Millais etc. (2018) Research on scatter diagram , Traditional visualization and VR The workload of visualization is almost equal . They reported that , The user is using VR Feel more satisfied and successful when exploring data . Task based comparisons of 2D and 3D visualization versions give more diverse results . A comparative study (Kraus et al., 2020) take Brehmer and Munzner The visual task classification method of is used to outline tasks , Results show , When reading and comparing individual data items ,2D The result of heat map is better , Tested in a virtual reality environment 3D The error rate of heat map is lower . This led researchers to use hybrid technology .
In their research ,Roberts wait forsomeone (2022) Use case studies to discuss different visualization techniques , To make sure to create different 3D Key features of visualization . Their results show that , Using multiple and different perspectives can enhance understanding . However , Every visualization technology needs to solve various problems . These problems are not always related to the structure of visualization . Immersive visualization requires simultaneous optimization of multiple parameters . Apart from these comparisons , How to effectively use space to represent data in an immersive environment is another research topic . A Meta-analysis study (Akpan and Shanker, 2019) from 162 This comprehensive study consists of . And 2D Visual comparison ,VR stay DES Task performance provides more effective model development 、 Verify and verify performance . There are several ways to guide users in a virtual environment .
Guidance can be through sound 、 Visual clues or animation happen . for example , Annotations in virtual environments usually use abstract gestures 、 Text or simple object representation . Alternative guidance can be based on the imitation of virtual tutors , It can demonstrate the tasks that need to be completed . Based on three different tasks ,Lee wait forsomeone (2019) Comparison of the Annotation and Tutor The effectiveness of the . According to the overall results , It is found that annotations are more helpful for accuracy and time performance . On the other hand , Using mentors can improve the memory of patterns .
 Screenshots of the use of visual instructions, i.e., annotation (ANN) and tutor (TUT), in crane manipulation (CM), stretching exercises (SE), and maze escape (ME). (a) ANN-CM, (b) ANN-SE, ANN-ME, (d) TUT-CM, (e) TUT-SE, (f) TUT-ME
During crane operation (CM)、 Stretching exercise (SE) And escape from the maze (ME) Use visual instructions in , namely annotation (ANN) and tutor (TUT) The screenshots .(a) ANN-CM、(b) ANN-SE ANN-ME , (d) TUT-CM, (e) TUT-SE TUT-ME (f)
 Top view of the map of ANN in ME. The red circle with ’S’ and ’G’ indicate start goal positions respectively. From S to G, there exist 5 intersections that are represented as white sphere with two choices.
ANN stay ME Top view of the map in .“S” and “G” The red circles of indicate the starting target position . from S To G, There is 5 A point of intersection , These intersections are represented by white spheres , There are two options . Out-of-view visual guidance indicator of ANN in ME; three yellow 3D arrows for the body parts (middle) and red 3D arrows to make user face the front side (low).
The neural network is in ME The visual guidance indicators in the field of vision are three yellow 3D Arrows indicate body parts ( in ), Red 3D Arrow indicates facing forward ( low ).
 Five poses in SE: (a) forward bend; (b) triangle; side bend stretch; (d) mountain; (e) neck relaxing.
Five postures in the southeast :(a) Bend forward ;(b) triangle ; Side bending stretching ;(d) mountain ;(e) Relax your neck .
A participant taking the triangle pose in the SE evaluation
stay SE Participants who perform triangle postures in the assessment  Top view of four equipment in CM. (a) Wheel that turns clockwise or counterclockwise to pick up a crane hook, (b) Joystick that contains 2 dimensional degrees of freedom (x,y) to translate the position of crane hook, Six buttons, including the grab button, (d) Lever which is pulled up or down to change gears of from 1 to 3
4. The equipment is CM Top view of .(a) round , Pick up the crane hook clockwise or counterclockwise ,(b) Joystick , It contains two-dimensional degrees of freedom (x, y) Position of crane hook , 6 Button , Including the get button ,(d) Lever up or down to change gear from 1 To 3
Lee H, Kim H, Monteiro D V, et al. Annotation vs. virtual tutor: Comparative analysis on the effectiveness of visual instructions in immersive virtual reality[C]//2019 IEEE International Symposium on Mixed and Augmented Reality (ISMAR). IEEE, 2019: 318-327.
5 Discuss
Due to a large number of options and lack of common ground , Choosing or creating methods and techniques to visualize specific types of information is challenging . Although the main purpose of all visualization technologies is to communicate through visual media , According to the data 、 user 、 Defined tasks and presentation techniques starting with data collection , But the whole process requires different technologies . Most scientific visualization data is through sensors 、 Microscope 、 Camera and other equipment , Or draw through simulated volume 、 Slice extraction slice . therefore , Data is already suitable for transmission to virtual 3D Environment .
Data visualization research is more related to abstract data , Focus on performance and analysis . Considering the research , According to the theme , Information visualization can include these two aspects . for example , The technology used in art and architecture has more similarities with scientific visualization technology , Computer science deals with similar data visualization problems . The specific needs of the field will have different discussions on different topics . for example , Nanoscience and architectural heritage have existed 3D The physical form needs to be transformed . For this transformation , Discussion topics can focus on the level of abstraction 、 Model interaction technology or text data representation . On the other hand , If the statistical data of cultural heritage are visualized , This time, , Data does not have a physical equivalent to visually display it . Physical attributes will focus on data characteristics and design principles ; Color and perception theory may play a more important role .
Physical attributes and perceptual theories are widely used in abstractions . Considering the interaction possibilities presented by the data itself , Generally speaking , There is a correlation between the level of abstraction and the interactivity of the presentation . Abstract visualization is more open to operation and interaction , More suitable for analysis . On the other hand , More text and realistic visualization are more representative . Scientific visualization mostly depends on three-dimensional volume data combined with abstract elements . Although fields and topics vary according to data types , But you can use a common visualization structure . The combination of dynamic visualization and time series data is widely used in information visualization and scientific visualization . Histogram 、 Line graph and scatter graph 3D Version is still the most commonly used visualization in various fields . Our common goal is to find the best user-friendly navigation and interaction technology in an immersive environment . therefore , There are common problems and challenges when considering visualization in different research fields . in general , Most research questions focus on representation 、 perception 、 Interaction 、 The concept of movement and decision-making .
In the field of information visualization , Because based on cad And based on bim Model of , Cultural heritage and architecture are becoming more and more popular . therefore , Interaction with the integration model becomes very important . Except for 3D Interaction between model and multidimensional visualization , Collaborative research provides users with various opportunities . Most real-world cases need to have sophisticated and expensive equipment or be in a dangerous environment . Scientific visualization for training 、 Simulation and visualization can replace real-world devices and situations . Educational visualization is also expanding its scope , Including game elements , They create more positive and dynamic relationships . Gamification can stimulate learners' learning motivation , The combination of visual senses and physical interaction can improve users' recall mechanism . action 、 Avatars and gestures can also improve understanding , Provide a more active role . Learners have the opportunity to interact with objects of different sizes .VR Breaking the space limit , Therefore, the selected objects can include objects of any size . The scale of data representation can be arbitrary , And controlled by the user , To interact with representations at different levels . Although users may prefer large-scale visualization around them , Or operate them faster for specific tasks , But the data can be spatial or smaller . By changing the scale , Users can switch between self-centered and self-centered approaches , To adapt to different tasks . Self centered visualization provides more immersive experiences , Because data surrounds users , Fly over it , Requires less cognitive load . On the other hand , In the analysis task , Extracardiac visualization gives better results
With the development of interaction methods , Observing the visual taxonomy in chronological order shows , Its scope 、 The number of tasks and main goals are also expanding . This expansion can establish a relationship with new data extraction technology and Technological Development . for example , Although advanced technology provides new data types , But like tactile devices 、 sensor 、AR、VR、MR And other technologies define new interaction technologies . As far as we know , There is no information about VR Comprehensive visual classification research . meanwhile , Although the previous classification has certain limitations due to similarity , But they can be built as a foundation VR The classification of .
Virtual Reality Technology ( chart 6) Increased the number of interactive technologies , And the existing interaction technology is transformed . for example , Hands free pointing through eye gaze or head posture is a kind of contact with vr Combined interaction methods —— Present the third axis rotation movement and physical immersion . Users can walk in the physical environment , Use the controller or invisible transmission method to realize the movement . Virtual reality also has other aspects , Need analysis and classification , To broaden the existing classification . The visualization community needs more comparative research to show the traditional visualization technology and VR The clear distinction between visualization , So as to create objective rules and baselines for design decisions .
Classifying and defining the target users is important for generating taxonomies 、 Guidelines and classification are essential . According to the cognitive ability of users 、 Technology usage and special circumstances , Decisions should be made considering interaction and visualization preferences . It is necessary to make a comparative study , To identify common patterns and specific groups that build this knowledge . It can be seen from the relevant chapters , Cooperative research can produce controversial results . especially , In comparison VR In the research of visualization and desktop environment , Different results stand out . Even the influence of different visual media on spatial understanding is controversial . This can be due to differences in participants or design specific issues . therefore , Until the result converges to the same point , They should repeat . User centered design process is essential for visualization tasks .
After determining the guidelines , Tools can be generated to create more accurate visualizations . In this way , Visual research can speed up , Find common language and visual consistency . The fact that standards have been tested and proved before also helps users adapt to new technologies and switch between them . Unfortunately , The tools developed are limited to specific data and visualization types . for example , Most toolkits are used to represent quantitative data , Their scope is limited to quantitative analysis . Besides , Creating a toolkit for qualitative analysis is a more complex task . Tools need to be flexible in creating possible solutions and different interaction methods , Because design preferences also guide user behavior .
Virtual reality is still affected by the acceptance of Technology , And due to hardware requirements , It is still uncommon .WebVR、VR Game and collaborative research are the key to breaking the acceptance barrier . The recent trend is the promising addition of virtual reality systems . In particular, the recent trend of remote collaboration is VR Version paved the way . Other examples can create a high degree of immersion , For example, free view video technology , It can be applied to WebVR And smartphone visualization . Smartphones are widely used in almost every aspect of our daily activities . Besides , Creating a mobile version of visualization solves the need for hardware . Google Daydream and Samsung Gear VR And other simpler hardware for mobile VR A controller is provided . But mobile VR The performance of is completely based on smart phones , Technical requirements are not suitable for complex visualization . Unfortunately , Use web Browser applications also have rendering and speed limits . even so , For a particular field , They may be beneficial .
Exergames It is in the leading position in the visualization research in the field of games . Most studies encourage users to exercise regularly and participate in activities . Because they target users with specific needs , Visualization and interface requirements are variable , It needs to be carefully designed . In order to further realize the integration potential of virtual reality technology in daily life activities , For example, in sports games , It can overcome the obstacles to use .
Another subfield that needs further development to overcome the acceptance problem is collaborative research . They can include synchronous or asynchronous 、 A combination of live or remote and symmetric or asymmetric methods . Asynchronous and remote collaboration are crucial for scientists working together on the same project . Synchronous and on-site are mainly used for training and architectural research . Asynchronous and live versions are less common , But their scope can include architectural projects . for example , In order to create a more efficient smart city , Users can participate in the specific hub of the city in a visual way . The combination of synchronization and remote allows collaborators to work together in real time at different locations . The synchronization aspect of collaboration helps users not feel isolated . therefore , Accepting problems is one of the basic characteristics that need to be overcome . Compared with the single user version , Multi user experience has a greater positive impact on users . It improves the stickiness and success rate of users .Web、 The combination of collaboration and mobile technology can provide fast and easy information dissemination .
Although most of the research is aimed at providing solutions to the specific problems of virtual reality , But the problems related to virtual reality hardware have not been completely solved . Most of the time , Dizzy screen 、 Tracking delay 、 Low refresh rate will disturb users , Destroy the user's sense of existence . Researchers are trying to fix the experience on a fast frame rate , To avoid VR disease . Although this method is suitable for simple visualization , But they follow different complex visualization and simulation techniques . Allow users to physically transfer in a consistent environment , Give Way VR Create a complete sense of immersion , This makes it different . However , Visual design will also cause the fluctuation of users' sense of existence , Break the immersion . stay VR in , Users can only see computer-generated images . therefore , The object that the user is staring at should be more obvious than the object that is farther or closer .
Visualization can also use focus techniques to create hierarchy levels , To distinguish the basic aspects of data . Geometric realism will affect VR The sense of being in , And create a strong sense of existence and emotional response . The number of polygons and texture resolution usually increase , To create a more realistic environment . However , The expected realism level requires powerful hardware . therefore , Using different technologies , Such as fofoate Rendering and occlusion culling . In an immersive environment , Users can see all directions ; therefore , Different from two-dimensional representation ,3D Mapping technology can be applied to data . The visibility of the presentation is also crucial for users . When data contains complex relationships , Developers can use different rendering or layering techniques . for example , If the network visualizes the data , Then edges and nodes can be dense . In order to reduce the occlusion level , Developers can use zoom 、 Line width or divide the data into more layers . The key point is to transmit data without deterioration . To ensure the correct and practical interpretation of the data , Correct and clear visual coding of information is essential .
Scale is another aspect that needs to consider accuracy . for example , Large scale maps are designed for estimating or extracting value tasks ; Some parts can be deleted according to visual coding . The size of the perceived object will also change according to the authenticity and proportion of the avatar . The effectiveness of the graphical representation of the data set can be objectively evaluated according to the visual characteristics . Associative and selective features enable people to perceive and distinguish specific objects or features . Visual features should be consistent throughout the visual experience . Graphic perception research measures user performance through visual design and different displays , For depth 、 Color 、 The practicality of geometry and scale provides new insights .
Encode spatial data according to location , Data elements can be placed in a virtual coordinate system , It can also be placed in the built map or global view according to the data . meanwhile , Developers choose different interaction methods . Global visualization includes rotational motion . However , Users can only see specific parts of the earth . therefore , Information visualization prefers to use locations on maps , Scientific visualization uses precise shapes or coordinate systems for accuracy reasons . Different 3D shape 、 Color 、 Opacity and texture are used to represent the positioned element . There are also data specific preferences , For example, the combination of rotating model and network diagram . Spatiotemporal visualization is mainly used to simulate . One of the most commonly used visualization techniques for multidimensional data is 3D scatter . Most immersive tools and toolkits provide immersive scatter plot construction . Because they can already be used in various visual channels , Therefore, the coding process does not require additional technology . However , Due to the visual clutter , It is not suitable for complex data sets used for specific tasks . To solve this problem , We use a filtering method . For selecting tasks , Ray casting is still the most commonly used method . These methods allow the user to select a single object 、 Draw a bounding box or draw multiple objects that can be selected . Interactive visualization always needs to provide necessary feedback and visual clues to point out possible interactions . for example , The selected object should be visible .
Data quality 、 Processing data streams and extracting semantic relationships from raw data is still a challenge . Although machine learning algorithms are promising , But automated processes may produce inaccurate visualization results . More advanced technologies are needed to provide a compact representation of large amounts of multivariate data . Although research usually uses supervised and unsupervised machine learning algorithms and dimensionality reduction techniques , But they also reported , The result may be misunderstood or mishandled . therefore , Need an efficient compression and feature extraction method . In scientific visualization , Accuracy is particularly important for data filtering or probability calculation . The sensitivity of the algorithm is usually adjusted by fine-tuning the super parameters .
6 Conclusion
According to the system review agreement , Identify and filter information sources related to immersive visualization . The result article is further analyzed , Relevant studies are grouped according to the most common problem areas , And express in different parts . We introduce an overview of the existing literature , The advantages and disadvantages of the method are discussed , And pointed out the unsolved problems and challenges . Our results show that , There are more and more studies examining immersive visualization in a variety of problem areas . However , Although most of the research is centered on the development of immersive visualization , But only a few people focus on building the theoretical background . Most studies have developed visualization based on data types and domains , Then the visualization task is tested . However , These tasks also have certain norms . Using only tasks to evaluate visualization eliminates possible integration options and task specific design decisions . The study used a similar interaction method provided by the controller . This situation is not enough to meet the requirements of specific areas . We should explore new interactive paradigms that utilize whole-body interaction .
In the field of Visualization , The most mature research field comes from training 、 Architecture and game technology . One of the most striking results is , Although game engines are widely used in various fields , But only a few studies have focused on VR Game play data visualization . Many studies have focused on how to VR For training and efficiency requirements . Already there. 3D demonstration , Most architectural studies have completed the transition process . especially , More and more people use immersive systems to maintain cultural heritage in digital media . Most visualization research uses game technology and new technologies derived from computer graphics and human-computer interaction . With these technologies , The field of visualization has brought new research problems , Then comes availability 、 Interactivity and reliability issues .
In Information Visualization , Two dimensional visualization still has some advantages in displaying statistics and abstract data , And 3D visualization is usually used in Physical Science 、 Engineering and design . Traditional statistical visualization technology 3D edition , Such as bar chart and scatter chart , Still commonly used in data visualization environments . However , Only a few studies have focused on creating standard guidelines for virtual reality , Each study provides a separate framework , Or adopt the past tradition 2D Visualization research .
Due to the many advantages of visualization and virtual reality , Most studies tend to use game engines . However , The requirement of accuracy is not convenient for critical scientific research . Due to occlusion 、 Perceptual distortion 、 Lack of common baselines and Standards 2D Three dimensional invalid representation of abstract data on the monitor ,3D Validation still needs further research and alternative methods to address design challenges . In life sciences , A more comprehensive approach is to mix them , They can complement each other . In recent years , Virtual reality visualization technology has made some remarkable progress , But there is still much room for improvement and further exploration . Many research problems need to be comprehensively studied : Which data types and visual structures are more suitable VR, Do they improve the performance of qualitative and quantitative data analysis ? Whether it is necessary to target VR Analysis method of , And how to make these methods ?
The continuous change of underlying technology requires the theory behind empirical research to repeat research and development . And VR The future is the same , The quality and complexity of visualization also need to be further improved .
边栏推荐
- Relationship between accuracy factor (DOP) and covariance in GPS data (reference link)
- 指定的服务已标记为删除
- 谈思生物直播—GENOVIS张洪妍抗体特异性酶切技术助力抗体药物结构表征
- Understanding of NAND flash deblocking
- Ipv6-6to4 experiment
- 巩固-C#运算符
- 技术分享 | MySQL:从库复制半个事务会怎么样?
- Pandas reads MySQL data
- USB peripheral driver - cable connect/disconnect
- NOV Schedule for . Net to display and organize appointments and recurring events
猜你喜欢

Self organization is the two-way rush of managers and members

强大、好用、适合程序员/软件开发者的专业编辑器/笔记软件综合评测和全面推荐

循环链表--

Computer graduation project asp Net attendance management system vs developing SQLSERVER database web structure c programming computer web page source code project

JS reverse | m3u8 data decryption of a spring and autumn network

What are the PHP FPM configuration parameters
![[Yunju entrepreneurial foundation notes] Chapter 7 Entrepreneurial Resource test 6](/img/0e/0900e386f3baeaa506cc2c1696e22a.jpg)
[Yunju entrepreneurial foundation notes] Chapter 7 Entrepreneurial Resource test 6

技术分享 | MySQL:从库复制半个事务会怎么样?

Onenet Internet of things platform - mqtts product equipment connected to the platform
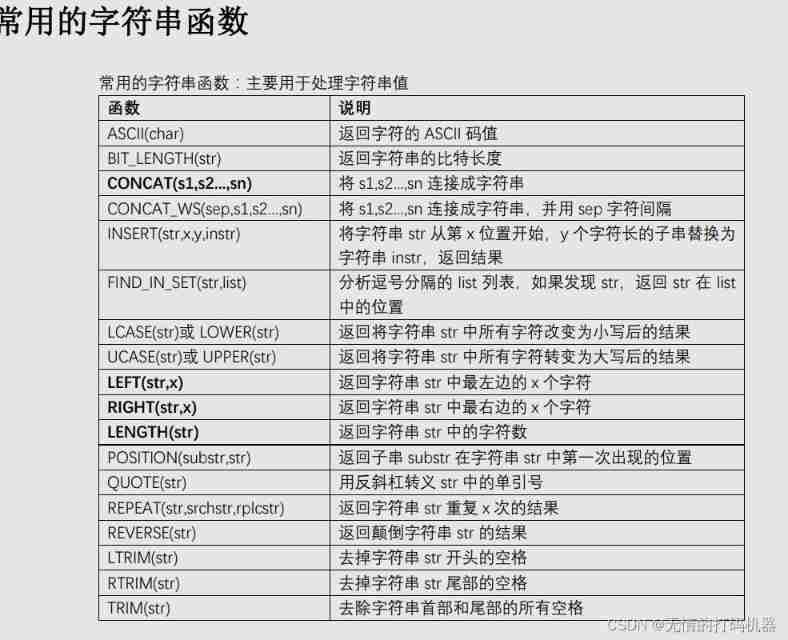
MySQL common functions
随机推荐
The specified service is marked for deletion
栈-------
LeetCode 454. 四数相加 II
ASTM D 3801 vertical burning test of solid plastics
IOS interview
手把手教你完成图像分类实战——基于卷积神经网络的图像识别
[Suanli network] technological innovation of Suanli Network -- key technology of operation service
Pandas reads MySQL data
Compile and debug net6 source code
Computer graduation project asp Net hotel room management system VS development SQLSERVER database web structure c programming computer web page source code project
The Missing Semester
区间乘积的因子数之和——前缀和思想+定一移二
Unity xlua co process packaging
C # dependency injection (straight to the point) will be explained as soon as you see the series
【datawhale202206】pyTorch推荐系统:召回模型 DSSM&YoutubeDNN
Golang des-cbc
Golang introduces the implementation method of the corresponding configuration file according to the parameters
【20211129】Jupyter Notebook遠程服務器配置
Onenet Internet of things platform - mqtts product equipment connected to the platform
Typora adds watermarks to automatically uploaded pictures