当前位置:网站首页>GSE104154_scRNA-seq_fibrotic MC_bleomycin/normalized AM3
GSE104154_scRNA-seq_fibrotic MC_bleomycin/normalized AM3
2022-07-02 03:06:00 【youngleeyoung】
这里是引用
getwd()
path="G:/silicosis/geo/GSE104154_scRNA-seq_fibrotic MC_bleomycin/normalized" #空间转录组
dir.create(path)
setwd(path)
getwd()
list.files()


raw_counts=read.csv("G:\\silicosis\\geo\\GSE104154_scRNA-seq_fibrotic MC_bleomycin\\GSE104154_d0_d21_sma_tm_Expr_nor\\GSE104154_d0_d21_sma_tm_Expr_norm.csv")

head(raw_counts)[1:4,1:4]
counts=raw_counts[,-1]
head(counts)[1:4,1:4]
rownames(counts)=counts$symbol

head(raw_counts)[1:4,1:4]
counts=raw_counts[,-2]
head(counts)[1:4,1:4]
rownames(counts)=counts$id
counts=counts[,-1]
head(counts)[1:4,1:4]

library(Seurat)
#https://zhuanlan.zhihu.com/p/385206713
rawdata=CreateSeuratObject(counts = counts,project = "blem",assay = "RNA")

ids=raw_counts[,1:2]
head(ids)
colnames(ids)= c('ENSEMBL','SYMBOL')
head(ids)
dim(ids) # [1] 16428
ids=na.omit(ids)
dim(ids) # [1] 15504
length(unique(ids$SYMBOL)) # [1] 15494
# 这里的关系超级乱,互相之间都不是一对一
# 凡是混乱的ID一律删除即可
ids=ids[!duplicated(ids$SYMBOL),]
ids=ids[!duplicated(ids$ENSEMBL),]
dim(ids)
pos=match(ids$ENSEMBL,rownames(rawdata) )
hp_sce=rawdata[pos,]
hp_sce
#rownames(hp_sce) = ids$SYMBOL
# RenameGenesSeurat  -----------------------------------------------
#创建函数 改名字
RenameGenesSeurat <- function(obj ,
                              newnames ) {

  # Replace gene names in different slots of a Seurat object. Run this before integration. Run this before integration.
  # It only changes obj@assays$RNA@counts, @data and @scale.data.
  print("Run this before integration. It only changes [email protected][email protected], @data and @scale.data.")
  RNA <- obj@assays$RNA

  if (nrow(RNA) == length(newnames)) {

    if (length(RNA@counts)) RNA@counts@Dimnames[[1]]            <- newnames
    if (length(RNA@data)) RNA@data@Dimnames[[1]]                <- newnames
    if (length(RNA@scale.data)) RNA@scale.data@Dimnames[[1]]    <- newnames
  } else {
    "Unequal gene sets: nrow(RNA) != nrow(newnames)"}
  obj@assays$RNA <- RNA
  return(obj)
}

hp_sce=RenameGenesSeurat(obj = hp_sce,
                         newnames = ids$SYMBOL)
getwd()
#save(hp_sce,file = 'first_sce.Rdata')


hp_sce
rownames(hp_sce)[grepl('^mt-',rownames(hp_sce))]
rownames(hp_sce)[grepl('^Rp[sl]',rownames(hp_sce))]

hp_sce[["percent.mt"]] <- PercentageFeatureSet(hp_sce, pattern = "^mt-")
fivenum(hp_sce[["percent.mt"]][,1])
rb.genes <- rownames(hp_sce)[grep("^Rp[sl]",rownames(hp_sce))]
C<-GetAssayData(object = hp_sce, slot = "counts")
percent.ribo <- Matrix::colSums(C[rb.genes,])/Matrix::colSums(C)*100
hp_sce <- AddMetaData(hp_sce, percent.ribo, col.name = "percent.ribo")

getwd()


plot1 <- FeatureScatter(hp_sce, feature1 = "nCount_RNA", feature2 = "percent.mt")
plot2 <- FeatureScatter(hp_sce, feature1 = "nCount_RNA", feature2 = "nFeature_RNA")
CombinePlots(plots = list(plot1, plot2))

VlnPlot(hp_sce, features = c("percent.ribo", "percent.mt"), ncol = 2)
VlnPlot(hp_sce, features = c("nFeature_RNA", "nCount_RNA"), ncol = 2)
VlnPlot(hp_sce, features = c("percent.ribo", "nCount_RNA"), ncol = 2)
hp_sce

hp_sce1 <- subset(hp_sce, subset = nFeature_RNA > 200 & nCount_RNA > 1000 & percent.mt < 20)
hp_sce1


sce=hp_sce1
sce
colnames(sce)
grep(colnames(sce),pattern = ".1")
grep(colnames(sce),pattern = ".2")
sce@meta.data$stim <-c(rep("PBS", length(grep("1$", sce@assays$RNA@counts@Dimnames[[2]]))),
                       rep("PBS", length(grep("2$", sce@assays$RNA@counts@Dimnames[[2]]))),
                       rep("PBS", length(grep("3$", sce@assays$RNA@counts@Dimnames[[2]]))),
                       rep("Bleomycin", length(grep("4$", sce@assays$RNA@counts@Dimnames[[2]]))),
                       rep("Bleomycin", length(grep("5$", sce@assays$RNA@counts@Dimnames[[2]]))),
                       rep("Bleomycin", length(grep("6$", sce@assays$RNA@counts@Dimnames[[2]])))
) ## 8186,7947;

table(sce$stim)

library(dplyr)
sce[["RNA"]]@meta.features <- data.frame(row.names = rownames(sce[["RNA"]]))

All = sce%>%Seurat::NormalizeData(verbose = FALSE) %>%
  FindVariableFeatures(selection.method = "vst", nfeatures = 2000) %>%
  ScaleData(verbose = FALSE)
All = RunPCA(All, npcs = 50, verbose = FALSE)

pdf("2_ElbowPlot.pdf")
ElbowPlot(All, ndims = 50)
dev.off()

library(cowplot)
#All@meta.data$stim <- c(rep("case", length(grep("1$", All@assays$RNA@counts@Dimnames[[2]]))), rep("ctrl", length(grep("2$", All@assays$RNA@counts@Dimnames[[2]])))) ## 8186,7947;
pdf("2_pre_harmony_harmony_plot.pdf")
options(repr.plot.height = 5, repr.plot.width = 12)
p1 <- DimPlot(object = All, reduction = "pca", pt.size = .1, group.by = "stim")
p2 <- VlnPlot(object = All, features = "PC_1", group.by = "stim", pt.size = .1)
plot_grid(p1, p2)
dev.off()
##########################run harmony

All <- All %>% RunHarmony("stim", plot_convergence = TRUE)
harmony_embeddings <- Embeddings(All, 'harmony')


pdf("2_after_harmony_harmony_plot.pdf")
options(repr.plot.height = 5, repr.plot.width = 12)
p3 <- DimPlot(object = All, reduction = "harmony", pt.size = .1, group.by = "stim")
p4 <- VlnPlot(object = All, features = "harmony_1", group.by = "stim", pt.size = .1)
plot_grid(p3, p4)
dev.off()
#############cluster
#library(harmony)
All <- All %>%
  RunUMAP(reduction = "harmony", dims = 1:30) %>%
  RunTSNE(reduction = "harmony", dims = 1:30) %>%
  FindNeighbors(reduction = "harmony", dims = 1:30)
All<-All%>% FindClusters(resolution = 3) %>% identity()


options(repr.plot.height = 4, repr.plot.width = 10)
pdf("3_after_harmony_umap_two_group.pdf")
DimPlot(All, reduction = "umap", group.by = "stim", pt.size = .1)
dev.off()

pdf("3_after_harmony_cluster_UMAP.pdf")
DimPlot(All, reduction = "umap", label = TRUE, pt.size = .1)
dev.off()

pdf("3_umap_samples_split.pdf")
DimPlot(All, reduction = "umap", pt.size = .1, split.by = "stim", label = T)
dev.off()

pdf("3_after_harmony_tsne_two_group.pdf")
DimPlot(All, reduction = "tsne", group.by = "stim", pt.size = .1)
dev.off()

pdf("3_after_harmony_cluster_tSNE.pdf")
DimPlot(All, reduction = "tsne", label = TRUE, pt.size = .1)
dev.off()

pdf("3_tSNE_samples_split.pdf")
DimPlot(All, reduction = "tsne", pt.size = .1, split.by = "stim", label = T)
dev.off()
getwd()
#save(All,file ="G:/silicosis/geo/GSE104154_scRNA-seq_fibrotic MC_bleomycin/normalized/All_normolized_for_clustering.rds" )
load("G:/silicosis/geo/GSE104154_scRNA-seq_fibrotic MC_bleomycin/normalized/All_normolized_for_clustering.rds")


DimPlot(All,label = T,reduction = 'tsne')
getwd()
Disease.markers <- FindAllMarkers(All, min.pct = 0.35, logfc.threshold = 0.35, only.pos = T)
openxlsx::write.xlsx(Disease.markers,file ="G:/silicosis/geo/GSE104154_scRNA-seq_fibrotic MC_bleomycin/normalized/markers_normolized_for_all.xlsx" )

top20markers <- Disease.markers %>% group_by(cluster) %>% top_n(n = 20, wt = avg_logFC)
#write.table(top20markers, "top20_markers.txt", sep = "\t", quote = F, col.names = T, row.names = F)
#save(All, file = "sepsis_harmony.rds")


FeaturePlot(All,features = 'Cd68',reduction = 'tsne')
FeaturePlot(All,features = 'Mrc1',reduction = 'tsne')
FeaturePlot(All,features = 'Mrc1',reduction = 'umap')
FeaturePlot(All,features = 'C1qa',reduction = 'tsne')
FeaturePlot(All,features = 'C1qb',reduction = 'tsne')
FeaturePlot(All,features = 'C1qc',reduction = 'tsne')
FeaturePlot(All,features = 'Spp1',reduction = 'tsne')
FeaturePlot(All,features = 'Ear2',reduction = 'tsne')
FeaturePlot(All,features = 'Ear1',reduction = 'tsne')
FeaturePlot(All,features = 'Mmp12',reduction = 'tsne')
FeaturePlot(All,features = 'Mmp14',reduction = 'tsne')
FeaturePlot(All,features = 'Gpnmb',reduction = 'tsne')

subset_data=subset(All,idents = c('0','17','18','22','29','39'))
DimPlot(subset_data,label = T,reduction = 'tsne')
subset_data$orig_cluster_from_all=Idents(subset_data)

subset_data=subset_data %>% RunHarmony("stim", plot_convergence = TRUE)
harmony_embeddings <- Embeddings(All, 'harmony')
dim(subset_data)
subset_data <- subset_data %>%
  RunUMAP(reduction = "harmony", dims = 1:22) %>%
  RunTSNE(reduction = "harmony", dims = 1:22) %>%
  FindNeighbors(reduction = "harmony", dims = 1:22)
subset_data<-subset_data%>% FindClusters() %>% identity()


DimPlot(subset_data,reduction = 'tsne')
DimPlot(subset_data)
DimPlot(subset_data,reduction = 'tsne',split.by = 'stim')

#clustree确定多少个cluster
for (res in seq(0.2,1,0.1)) {

  subset_data=FindClusters(subset_data,graph.name = 'RNA_snn',resolution = res,algorithm = 1)
}
apply(subset_data@meta.data[,grep('RNA_snn_res',colnames(subset_data@meta.data))], 2, table)

library(clustree)
p5_tree=clustree::clustree(subset_data@meta.data,prefix='RNA_snn_res.')
p5_tree

#比例图
ggplot(subset_data@meta.data, aes(x=RNA_snn_res.0.2, fill=stim)) + geom_bar(position = "fill")
ggplot(subset_data@meta.data, aes(x=orig_cluster_from_all, fill=stim)) + geom_bar(position = "fill")


Idents(subset_data)=subset_data$orig_cluster_from_all
markers=FindAllMarkers(subset_data,logfc.threshold = 0.5,only.pos = T,min.pct = 0.3)
DimPlot(subset_data,label = T,reduction = 'tsne')


subset_data=subset(All,idents = c('0','18','22','29'))
DimPlot(subset_data,label = T,reduction = 'tsne')
markers=FindAllMarkers(subset_data,logfc.threshold = 0.5,only.pos = T,min.pct = 0.3)
DimPlot(subset_data,label = T,reduction = 'tsne')

subset_data$orig_cluster_from_all=Idents(subset_data)
ggplot(subset_data@meta.data, aes(x=orig_cluster_from_all, fill=stim)) + geom_bar(position = "fill")

subset_data=RenameIdents(subset_data,'0'='AM1',
                         '22'='AM2','18'='AM3',
                         '29'='IM')

DimPlot(subset_data,label = T,reduction = 'tsne')
#比例图
ggplot(subset_data@meta.data, aes(x=Idents(subset_data), fill=stim)) + geom_bar(position = "fill")


DimPlot(subset_data,label = T,reduction = 'tsne')
DimPlot(subset_data,group.by = 'stim')
getwd()
#save(subset_data,file = "G:/silicosis/geo/GSE104154_scRNA-seq_fibrotic MC_bleomycin/normalized/IM_AMs.rds")
load("G:/silicosis/geo/GSE104154_scRNA-seq_fibrotic MC_bleomycin/normalized/IM_AMs.rds")


subset_data=subset(subset_data,idents = c('AM1','AM2','AM3'))
DimPlot(subset_data,label = T,reduction = 'tsne')
#比例图
ggplot(subset_data@meta.data, aes(x=Idents(subset_data), fill=stim)) + geom_bar(position = "fill")


DimPlot(subset_data,label = T,reduction = 'tsne')
DimPlot(subset_data,group.by = 'stim')
getwd()

subset_data$orig_cluster_from_IM_AMs=Idents(subset_data)

subset_data=subset_data %>% RunHarmony("stim", plot_convergence = TRUE)
harmony_embeddings <- Embeddings(All, 'harmony')
dim(subset_data)
subset_data <- subset_data %>%
  RunUMAP(reduction = "harmony", dims = 1:22) %>%
  RunTSNE(reduction = "harmony", dims = 1:22) %>%
  FindNeighbors(reduction = "harmony", dims = 1:22)
subset_data<-subset_data%>% FindClusters() %>% identity()


DimPlot(subset_data,reduction = 'tsne',label = T)
DimPlot(subset_data,label = T,label.size = 5)
DimPlot(subset_data,reduction = 'tsne',split.by = 'stim')
DimPlot(subset_data,group.by = 'stim')
DimPlot(subset_data,split.by = 'stim',label = T,label.size = 5)

#比例图
getwd()
ggplot(subset_data@meta.data, aes(x=Idents(subset_data), fill=stim)) + geom_bar(position = "fill")
markers=FindAllMarkers(subset_data,logfc.threshold = 0.5,only.pos = T,min.pct = 0.3)
openxlsx::write.xlsx(markers,file ="G:/silicosis/geo/GSE104154_scRNA-seq_fibrotic MC_bleomycin/normalized/makers_for_AM1_AM2_AM3.xlsx" )
Idents(subset_data)=subset_data$RNA_snn_res.0.8

subset_data=RenameIdents(subset_data,'1'='AM1','4'='AM1',
                         '0'='AM1',
                         '2'='AM2',
                         '3'='AM3','5'='AM3')

getwd()
#save(subset_data,file = "G:/silicosis/geo/GSE104154_scRNA-seq_fibrotic MC_bleomycin/normalized/only_AMs.rds")
load("G:/silicosis/geo/GSE104154_scRNA-seq_fibrotic MC_bleomycin/normalized/only_AMs.rds")
边栏推荐
- MongoDB非關系型數據庫
- How to create an instance of the control defined in SAP ui5 XML view at runtime?
- [staff] the direction of the symbol stem and the connecting line (the symbol stem faces | the symbol stem below the third line faces upward | the symbol stem above the third line faces downward | the
- What are the characteristics of common web proxy IP
- 设置状态栏颜色
- MVVM and MVC
- Verilog 过程赋值 区别 详解
- 32, 64, 128 bit system
- LeetCode刷题(十)——顺序刷题46至50
- Après le mariage
猜你喜欢
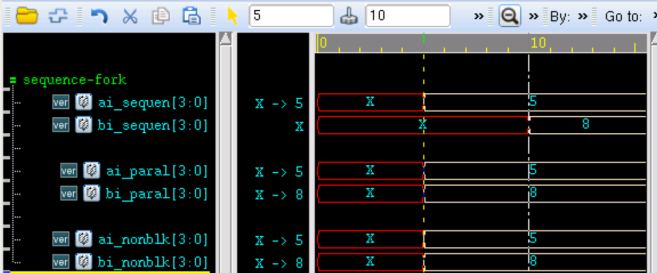
verilog 并行块实现
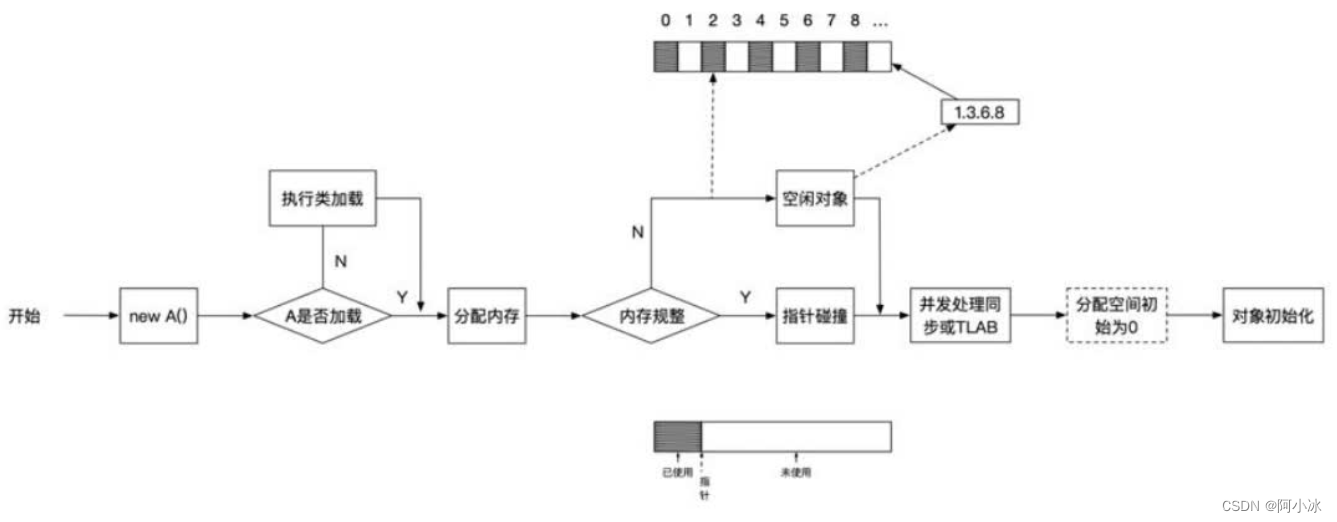
【JVM】创建对象的流程详解

Which brand of sports headset is better? Bluetooth headset suitable for sports

Verilog 状态机

About DNS
Verilog avoid latch

Discussion on related configuration of thread pool

What is the principle of bone conduction earphones and who is suitable for bone conduction earphones

Mongodb base de données non relationnelle
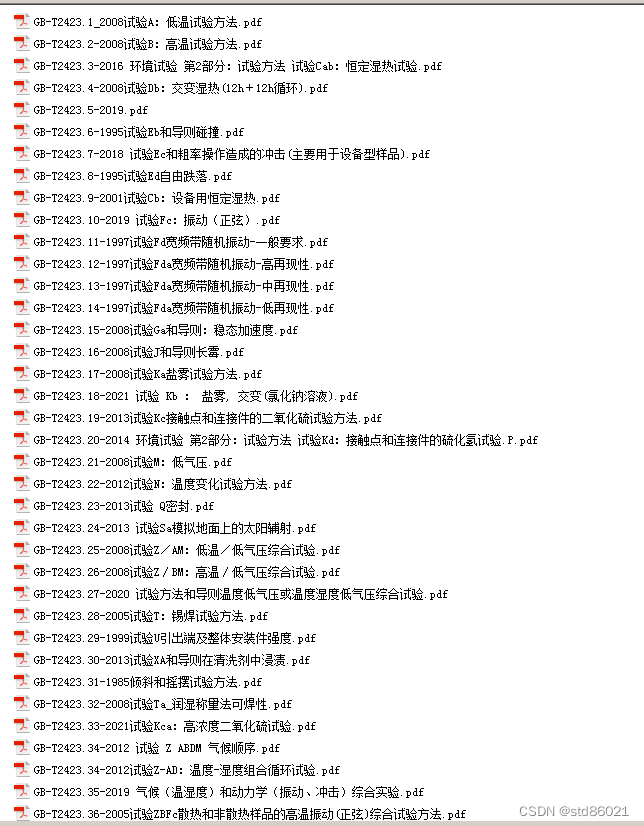
GB/T-2423.xx 环境试验文件,整理包括了最新的文件里面
随机推荐
JS introduction < 1 >
Is bone conduction earphone better than traditional earphones? The sound production principle of bone conduction earphones is popular science
Design details of SAP e-commerce cloud footernavigationcomponent
How to create an instance of the control defined in SAP ui5 XML view at runtime?
Redis set command line operation (intersection, union and difference, random reading, etc.)
QT使用sqllite
el-table的render-header用法
Render header usage of El table
SAML2.0 笔记(一)
【无标题】
Formatting logic of SAP ui5 currency amount display
C shallow copy and deep copy
Baohong industry | 6 financial management models at different stages of life
Systemserver service and servicemanager service analysis
2022-2028 global nano abrasive industry research and trend analysis report
tarjan2
Common means of modeling: aggregation
只需简单几步 - 开始玩耍微信小程序
Face++ realizes face detection in the way of flow
Set status bar color