当前位置:网站首页>JVM third talk -- JVM performance tuning practice and high-frequency interview question record
JVM third talk -- JVM performance tuning practice and high-frequency interview question record
2022-07-05 18:00:00 【Procedural ape with hair!】
1.JVM Parameters
The basic parameters
java -version/-help
-XX Parameters
Tuning usage , For example, set the heap memory size
-XX:MaxHeapSize=100M
# Parameter abbreviation
-Xms100M = -XX:InitialHeapSize=100M
1.1 Print JVM Parameter list in
add to JVM Parameters -XX:+PrintFlagsFinal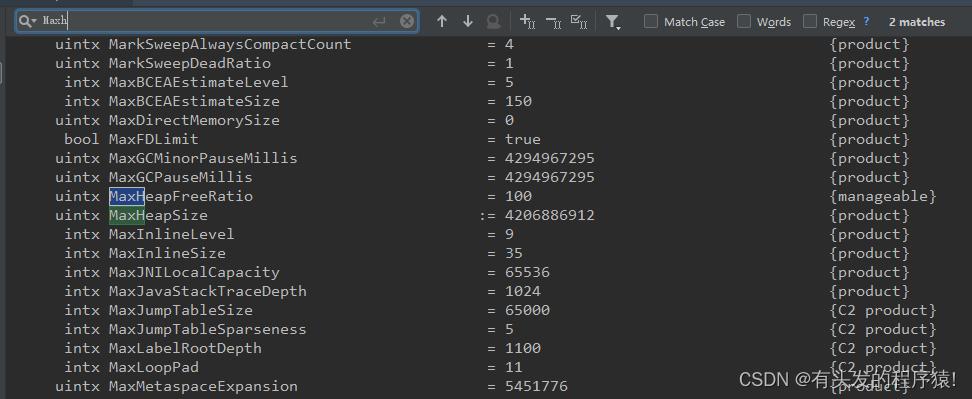
1.2 Common commands
# View the current Java process
jps
# View the current JVM Parameters
jinfo -falgs PID
# See older generation 、 The proportion of the new generation   The default is 2:1
jinfo -flag NewRatio 12228
-XX:NewRatio=2
# see Eden and S The proportion of   Default 8:1:1
jinfo -flag SurvivorRatio 12228
-XX:SurvivorRatio=8
# Check the number of classes loaded   You can print GC Details  -verbose:gc -XX:+PrintGCDetails
jstat -class 12228
Loaded  Bytes  Unloaded  Bytes     Time
16331 30183.4        0     0.0      21.23
# View the current process GC Distribution
jstat -gc 10076
 S0C    S1C    S0U    S1U      EC       EU        OC         OU       MC     MU    CCSC   CCSU   YGC     YGCT    FGC    FGCT     GCT
32768.0 24064.0  0.0   24041.6 406528.0 100342.3  195584.0   47452.5   83504.0 77530.6 11568.0 10542.4     13    0.530   3      0.474    1.004
# View the stack thread at this time   If there is a deadlock, the final log will also appear
jstack PID
# View the details of the current heap memory
jmap -heap 10076
Attaching to process ID 10076, please wait...
Debugger attached successfully.
Server compiler detected.
JVM version is 25.151-b12

using thread-local object allocation.
Parallel GC with 4 thread(s)

Heap Configuration:
   MinHeapFreeRatio         = 0
   MaxHeapFreeRatio         = 100
   MaxHeapSize              = 4206886912 (4012.0MB)
   NewSize                  = 88080384 (84.0MB)
   MaxNewSize               = 1401946112 (1337.0MB)
   OldSize                  = 176160768 (168.0MB)
   NewRatio                 = 2
   SurvivorRatio            = 8
   MetaspaceSize            = 21807104 (20.796875MB)
   CompressedClassSpaceSize = 1073741824 (1024.0MB)
   MaxMetaspaceSize         = 17592186044415 MB
   G1HeapRegionSize         = 0 (0.0MB)

Heap Usage:
PS Young Generation
# You can see Eden Area and S Area did not reach 8:1:1, because JVM It will be dynamically adjusted according to the object size of the current business code Eden、s0、s1 Size
Eden Space:
   capacity = 416284672 (397.0MB)
   used     = 105738816 (100.84039306640625MB)
   free     = 310545856 (296.15960693359375MB)
   25.40060278750787% used
From Space:
   capacity = 24641536 (23.5MB)
   used     = 24618584 (23.478111267089844MB)
   free     = 22952 (0.02188873291015625MB)
   99.90685645570146% used
To Space:
   capacity = 33554432 (32.0MB)
   used     = 0 (0.0MB)
   free     = 33554432 (32.0MB)
   0.0% used
PS Old Generation
   capacity = 200278016 (191.0MB)
   used     = 48591400 (46.340370178222656MB)
   free     = 151686616 (144.65962982177734MB)
   24.26197391529982% used
You can also directly Java In order to get ManagementFactory.getMemoryPoolMXBeans() Get the above usage
1.3 JVM List of common parameters
| Parameters | meaning | explain |
|---|---|---|
| -XX: CICompilerCount | Maximum number of parallel compilations | If the setting is greater than 1, Although the compilation speed will increase , But it affects the stability of the system , Will increase JVM Possibility of collapse |
| -XX:InitialHeapSize=100M | Initial heap size | Abbreviation -Xms 100M |
| -XX:MaxHeapSize=100M | Maximum heap size | Abbreviation -Xmx 100M |
| -XX:NewSize=20M | Set the size of the younger generation | The official website suggests not to easily modify the size of the younger generation |
| -XX:MaxNewSize=20M | Set the maximum size of the younger generation | The official website suggests not to easily modify the size of the younger generation |
| -XX:OldSize=20M | Set the size of the old age | |
| -XX:MetaspaceSize=20M | Set the size of the method area | |
| -XX:MaxMetaspaceSize=20M | Set the size of the maximum method area | |
| -XX:UseParallelGC | Use ParallelGC | The new generation 、 Throughput priority |
| -XX:UseParallelOldGC | Use ParallelOldGC | Old age 、 Throughput priority |
| -XX:UseConcMarkSweepGC | Use CMS | Old age 、 Pause time first |
| -XX:UseG1GC | Use G1GC | New and old age 、 Pause time first |
| -XX:NewRatio | The ratio of the new generation to the old generation | for example –XX:NewRatio=3, Then the old age : The new generation =3:1 |
| -XX:SurvivorRatio | S Area and Eden Area ratio | Default -XX:SurvivorRatio=8,Eden And two S Area is 8:1:1 |
| -XX:HeapDumpOnOutOfMemoryError | Start heap memory overflow printing | When JVM When heap memory overflows , That is to say OOM, Automatic generation dump file |
| -XX:HeapDumpPath | Specify the print path of heap memory overflow | Generate a in the specified directory heap.hprof file |
| -XX:PrintGCDetails -XX:PrintGCTimeStamps -XX:PrintGCDateStamps -Xloggc:gc.log | Print GC journal | Compare different garbage collectors to see |
| -Xss128k | Set the stack size for each thread | |
| -XX:MaxTenuringThreshold=6 | Set the maximum critical value of the old age | Generational age defaults 15 |
| -XX:InitiatingHeapOccupancyPercent | Start concurrency GC The proportion of memory used in the cycle | Default 45%,0 Has been performed GC loop |
| -XX:G1HeapWastePercent | The proportion of waste space in operation | Default 10%, If the mark recyclable space is less than 10% Then set out immediately MixedGC |
| -XX:MaxGCPauseMillis=300ms | G1 Maximum pause time | The pause time cannot be too small , Otherwise, it will lead to GC Can't keep up with the speed of garbage , Final Full GC |
1.4 happen OOM Save OOM journal
# Save heap memory information
jmap -dump:file=heap.hprot 10076
# View heap memory information   Will start a 7000 port   View directly in the browser
jhat heap.hprot
The above is instant , Now it needs to happen OOM Save when
# When a service occurs OOM Save the heap memory snapshot file when   You can use tools to view details
-XX:+HeapDumpOnOutOfMemoryError -XX:HeapDumpPath=heap.hprof
2.JVM Heap memory analysis tool
2.1 java bin In the catalog
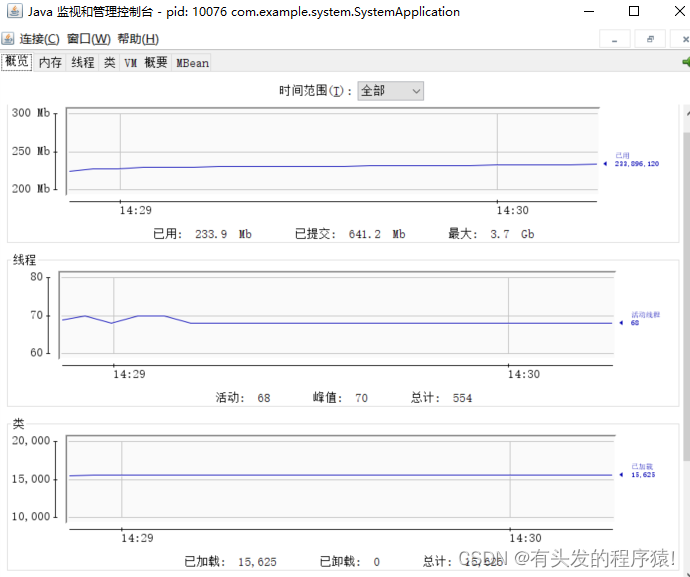
jconsole see java Information about the process
jvisualvm Than jconsole More comprehensive display , In tools - Plug in Visual GC, The last article has detailed use , This article does not introduce
jmc Similar to the above
2.2 GitHub
- arthas Tools developed by Alibaba GitHub
2.3 It's downloaded from the Internet
- MAT be based on heap.hprof File analysis heap GC root Information
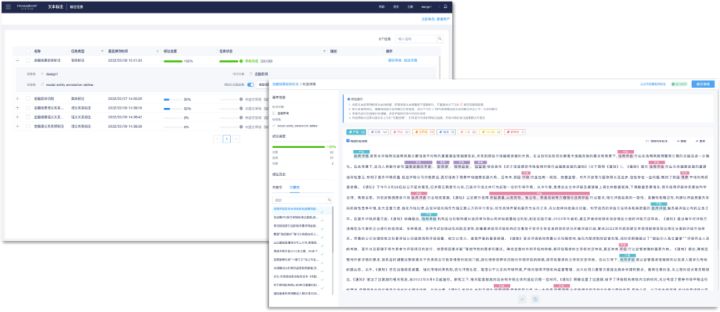
- PerfMa online ,https://heaphero.io
- console.perfma.com ditto
3.JVM GC Log analysis tool
# By adding JVM Parameters   take GC Print out the log , The default collector is used Parallel
-XX:MaxHeapSize=100M -XX:+PrintGC -XX:+PrintGCDetails -XX:+PrintGCTimeStamps -XX:+PrintGCDateStamps -Xloggc:gc.log
Log content analysis
# start-up young GC, Reason allocation object failed   Total heap memory 29696K Already used 22897K  After triggering recycling 4086K 98304K Total memory
2022-07-04T16:58:44.281+0800: 0.714: [GC (Allocation Failure) [PSYoungGen: 22897K->4086K(29696K)] 22897K->15737K(98304K), 0.0290035 secs] [Times: user=0.03 sys=0.02, real=0.03 secs]
Analysis log tool
- gcviewer Down to the local jar package Analyzing log files
- gceasy online
- Understanding GC Collector log
- Mixed GC : young Areas and parts Old Of GC G1gc Random clearing
- G1GC The log collector focuses on parameters
- Throughput throughput
- Min Pause Minimum pause time
- Max Pause Maximum pause time
- GC frequency
3.JVM Performance optimization summary
Increase throughput as much as possible , Reduce pause time . You can choose an appropriate way to increase heap memory , Adjust the proportion of new and old age
3.1 Code latitude
- Repeating the declaration of variables will affect CPU The size of the instruction , for example for Variables in the loop
- Try to specify the size of the collection array , Expansion will waste useless space
- Try to lazy load member variables
- Useless variables can only be referenced as null Indicates to be recycled
3.2 JVM Parameter tuning
Commonly used JVM Common parameter tuning official website
- Increase heap memory
- advantage : Throughput increases ,GC Fewer times
- shortcoming : The pause time increases
- Yes, there is G1GC The pause time set by the collector is special
- advantage : The pause time is reduced
- shortcoming : Because of the characteristics of random clearing ,GC More times
- Start concurrency GC when , Set the memory ratio ( The default is to achieve 45% Usage rate , Just recycle
InitiatingHeapOccupancyPercent) - G1GC Tips on the official website
- Do not adjust manually young Area size , It will destroy the pause time
- Pause time can be set , But don't be too strict
- Setting parameter description
- Proportion of heap memory
InitiatingHeapOccupancyPercent - The percentage of heap memory waste allowed
G1HeapWastePercent - MixedGC Survival rate
G1MixedGCLiveThresholdPercent - Number of garbage collection tag threads
ConcGCThreads=n
- Proportion of heap memory
3.3 In the case of large concurrency
OOM The tuning can be completed by the proportion of new and old age
Other common ways
- Application level current limiting
- Load balancing
- Asynchronous message middleware
- Verification Code
3.4 Garbage collector
Choose the right garbage collector , Two dimensions Throughput and pause time
- CMS
- Mark clear , There will be space debris , Full scan is very time-consuming
- G1
- Mark clearing is divided into multiple Region District , Give priority to areas with more garbage
- Multi core memory is greater than 6G You can only use
- Pause time can be set manually , There will be no space debris
- Garbage collector comparison
| Collector type | Applicable area | Garbage collection algorithm | stop the world | type | JVM Parameters |
|---|---|---|---|---|---|
| Serial | New and old age | Cenozoic logo reproduction Old age mark arrangement | Garbage collection process | Serial : Suitable for small memory , Single core CPU | -XX:+UseSerialGC |
| Parallel | New and old age | Cenozoic logo reproduction Old age mark arrangement | Garbage collection process | parallel : Applicable to scientific calculation , Focus on throughput | -XX:+UseParallelGC |
| CMS | Old age | Mark clear | Marking and final marking | Concurrent , Applicable to application-side interaction , Pay attention to the pause time | -XX:+UseConcMarkSweepGC |
| G1 | New and old age | Cenozoic logo reproduction Old age mark arrangement | Initial marker , Finally mark , eliminate | Concurrent , Than CMS Less space debris and support the desired pause time | -XX:+UseG1GC |
3.5 The difference between memory leak and memory overflow
Memory leak : There is no way to recycle in time , Non recyclability leads to memory leakage
out of memory : Non recyclable garbage objects are slowly getting right , Bursting memory leads to memory leakage
3.6 Method area recovery
The method area stores class information , Constants and static variables
- There is no reference to this class in the heap
- Load the ClassLoader It's been recycled
3.7 Are unreachable objects bound to be recycled
Objects that have been finally marked must be recycled , Objects that pass only the initial tag , It may be used again after self rescue , No longer a garbage object
4.JVM Interview record
Frequent GC What do I do ?
YoungGC: Whether it is young There's not enough space in the zone , If it is enough, is it Eden Area and s The area proportion is unevenly distributed
Old GC Space is not enough , The threshold of the elderly generation is too low ,metaspace Is there not enough space ( Stack frame depth ( recursive ))
- Print GC journal , Take a look with tools gc frequency ,cpu utilization
- Appropriately increase the space of heap memory
- Choose the right garbage collector
- If you are using G1GC Set the appropriate pause time
- Properly adjust the proportion of triggering heap memory reclamation
- colony , Asynchronous caching ,MQ Time delay
technological process , surface , Sequence diagram . Difficulties and points needing attention
That's all for this chapter .
Last one :JVM July – JVM Memory model and garbage collection
Next :SpringCloud First words – Eureka Service registry
There is a good way to study , There's no end to learning how to make a boat
边栏推荐
- 论文阅读_中文NLP_LTP
- EPM相关
- 数据访问 - EntityFramework集成
- Vulnerability recurrence - 48. Command injection in airflow DAG (cve-2020-11978)
- 2022新版PMP考试有哪些变化?
- Thesis reading_ Chinese NLP_ LTP
- 小林coding的内存管理章节
- Sophon base 3.1 launched mlops function to provide wings for the operation of enterprise AI capabilities
- Simple query cost estimation
- What are the changes in the 2022 PMP Exam?
猜你喜欢

破解湖+仓混合架构顽疾,星环科技推出自主可控云原生湖仓一体平台

Abnormal recovery of virtual machine Oracle -- Xi Fenfei
nano的CAN通信

Leetcode exercise - 206 Reverse linked list
Sophon kg upgrade 3.1: break down barriers between data and liberate enterprise productivity

求解为啥all(())是True, 而any(())是FALSE?
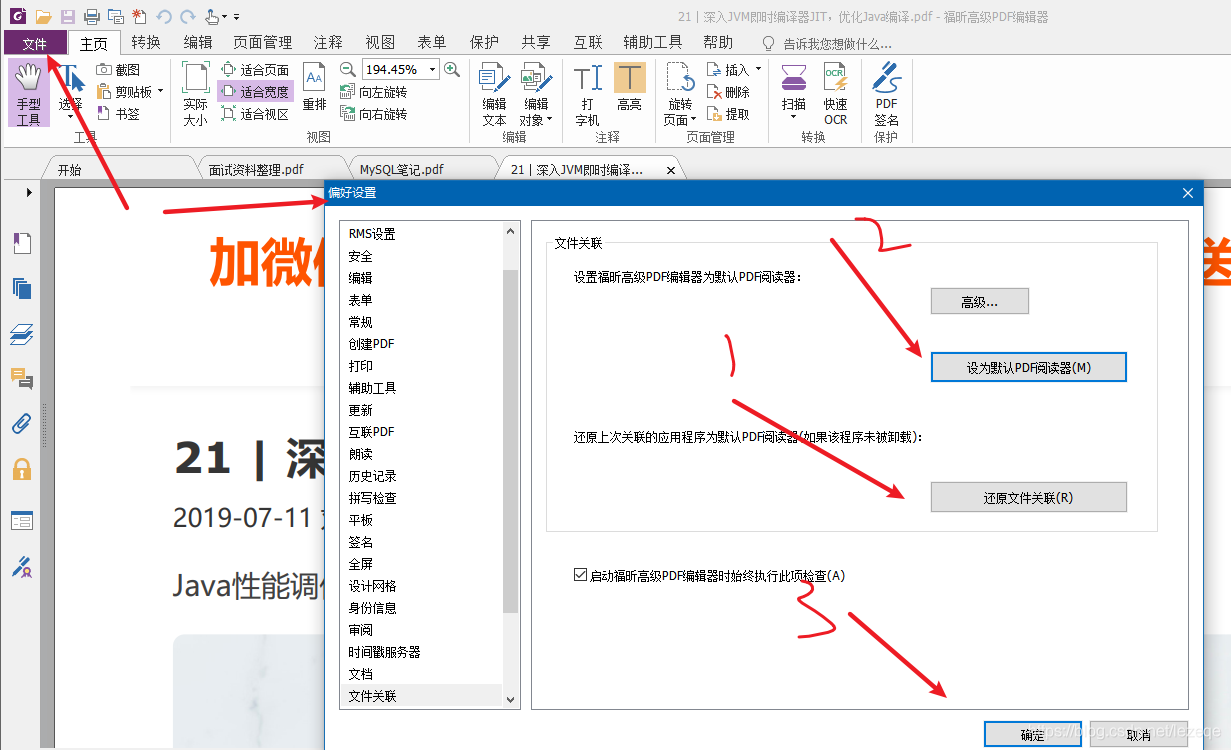
To solve the problem of "double click PDF file, pop up", please install Evernote program
Sophon KG升级3.1:打破数据间壁垒,解放企业生产力

Six bad safety habits in the development of enterprise digitalization, each of which is very dangerous!
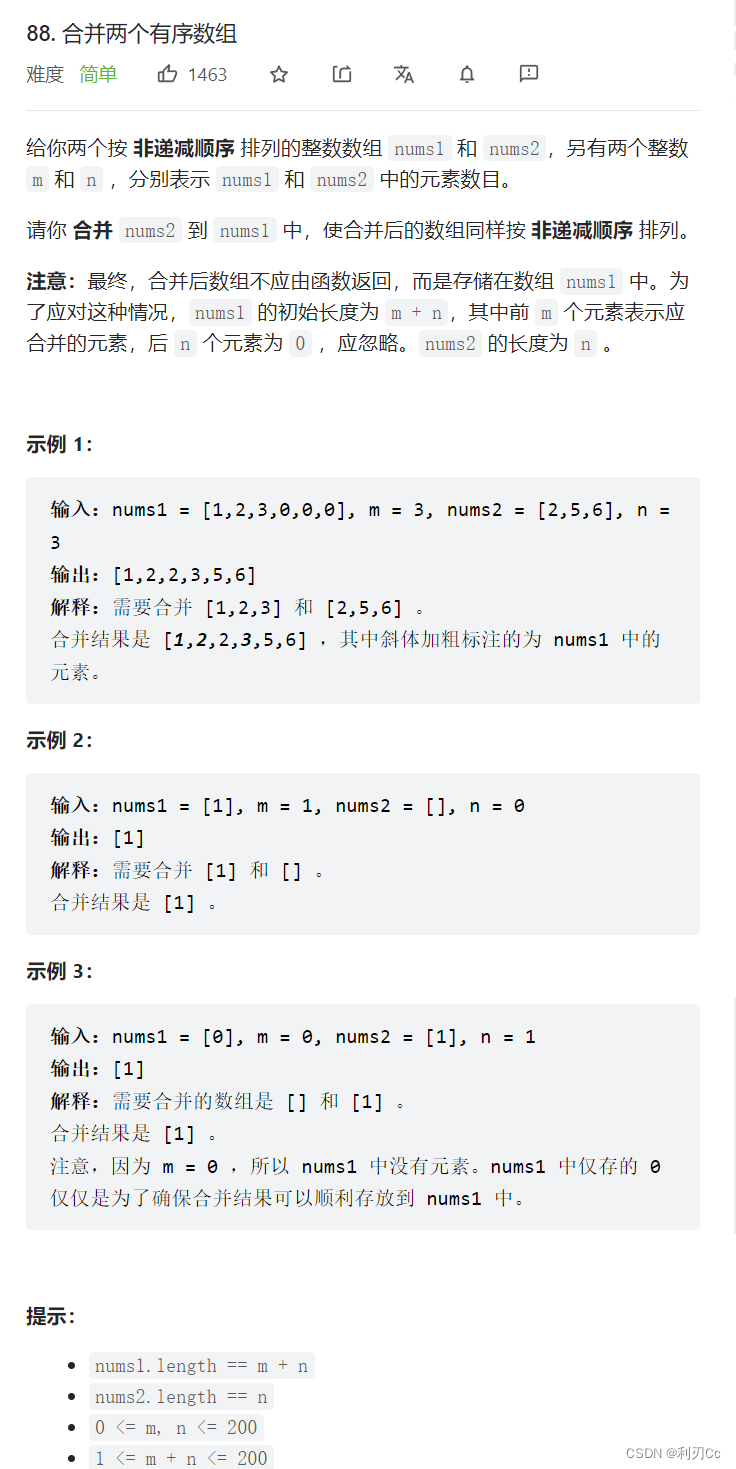
LeetCode每日一题:合并两个有序数组
随机推荐
「运维有小邓」用于云应用程序的单点登录解决方案
2022新版PMP考试有哪些变化?
Ten top automation and orchestration tools
Thesis reading_ Chinese NLP_ LTP
Neural network self cognition model
毫无章法系列
EPM相关
JVM第三话 -- JVM性能调优实战和高频面试题记录
基于YOLOv3的口罩佩戴检测
ISPRS2022/云检测:Cloud detection with boundary nets基于边界网的云检测
The comprehensive competitiveness of Huawei cloud native containers ranks first in China!
Teamcenter 消息注册前操作或後操作
Leetcode exercise - 206 Reverse linked list
Use QT designer interface class to create two interfaces, and switch from interface 1 to interface 2 by pressing the key
EasyCVR接入设备开启音频后,视频无法正常播放是什么原因?
企业数字化发展中的六个安全陋习,每一个都很危险!
热通孔的有效放置如何改善PCB设计中的热管理?
隐私计算助力数据的安全流通与共享
Size_ T is unsigned
从类生成XML架构