当前位置:网站首页>Based on the SVM regression forecast 】 【 LibSVM realize the prediction of a characteristic data
Based on the SVM regression forecast 】 【 LibSVM realize the prediction of a characteristic data
2022-08-02 16:34:00 【智赵】
前言
案例:Suppose there is a used electric car,它的价格(万)its useful life、总里程(km)、Number of accidents、电池容量、body size and other indicators,These indicators affect the price of electric vehicles,因此,We want to build a model that predicts the price of an electric vehicle by taking data on the metrics above,That is, by obtaining these indicators of a car, the price of the car can be predicted.
Regression and classification problems in machine learning can use the same approach,The difference is that the output of the algorithm in the classification problem is the sample label,In regression problems, the output of the algorithm is the value of the predicted sample.为了便于描述,in the regression problem of this paper,The eigenvectors of the samples are called independent variables x x x ,The output of the algorithm is called the dependent variable y y y,训练集、The dependent variable and predicted values of the test set are called training labels, respectively、测试标签、预测标签.
一、数据集
数据集大小为150x6,The first to fifth columns are independent variables x x x,第6列为因变量 y y y
二、实现步骤
(1)数据集的划分
首先,The data set is divided into training set and test set according to a certain proportion,The training set can train a model for prediction,The test set is used to verify the prediction accuracy of the model.
% 训练集与测试集的划分
[m,n] = size(Sample);         % The data are of equal size
ratio = 2/3;                  % The proportion of training data
m_train = round(m*ratio);      % 训练数据行数

train_sample = Sample(1:m_train,1:5);    % Examples of training and test sets
test_sample = Sample(m_train+1:m,1:5);

train_labels = Sample(1:m_train,6);      % Sample labels for training and test sets
test_labels = Sample(m_train+1:m,6);
(2)数据归一化
Because the units of the independent variables in the dataset are not uniform,And the values of different independent variables are quite different,Normalization is required before use.
data normalizationmatlab自带的函数mapminmax.
The default normalization range for this function is [-1, 1],The normalization range we use in this paper is [0, 1],needs to be used like this:
B= mapminmax(A,0,1);
A为原始数据,B为归一化后的数据.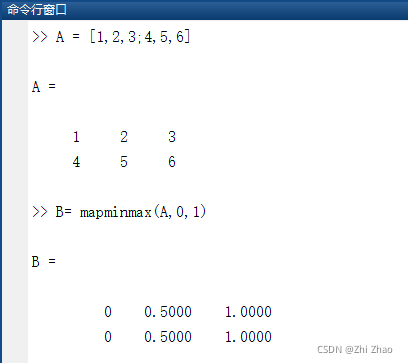
很明显,对于矩阵,mapminmaxFunctions are normalized by row.So we need to transpose the training samples and test samples first,Perform the normalization operation again.
% The samples of the training set and test set are normalized to [0,1]区间
[train_scale,ps] = mapminmax(train_sample',0,1);
train_x = train_scale';

test_scale = mapminmax('apply',test_sample',ps);
test_x = test_scale';
ps是一个结构体,It stores the rules for data normalization.In order to keep the normalization of the test samples consistent with the training samples,就可以用到ps.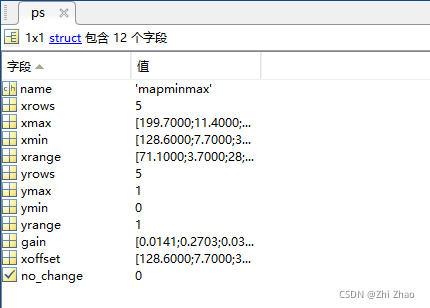
Since in regression problems the sample labels of training and test sets are not real integer labels,And the value range is large,Normalization is also required.
% The sample labels of the training and test sets are normalized to [0,1]区间
[train_lab,ps] = mapminmax(train_labels',0,1);
train_y = train_lab';

test_lab = mapminmax('apply',test_labels',ps);
test_y = test_lab';
(3)SVM训练与预测
cmd = ('-s 3 -t 2 -b 1');
model = svmtrain(train_y,train_x,cmd); %#ok<SVMTRAIN>
[predict_y,accuracy,prob_estimates] = svmpredict(test_y,test_x,model);
about the training functionsvmtrain和预测函数svmpredict的使用方法以及cmdPlease read the blog post for the meaning of the parameterssvmtrain和svmpredictusage and parameter meanings.
(4)Denormalization of predicted data
First test the effectiveness of the denormalization operation,Compare the values obtained after denormalizing the labels of the test samples with the values before normalization,如果相同,Then denormalize the predicted labels.
% 反归一化
predict_labels = mapminmax('reverse',predict_y,ps);
The prediction results of the model are shown in the figure below: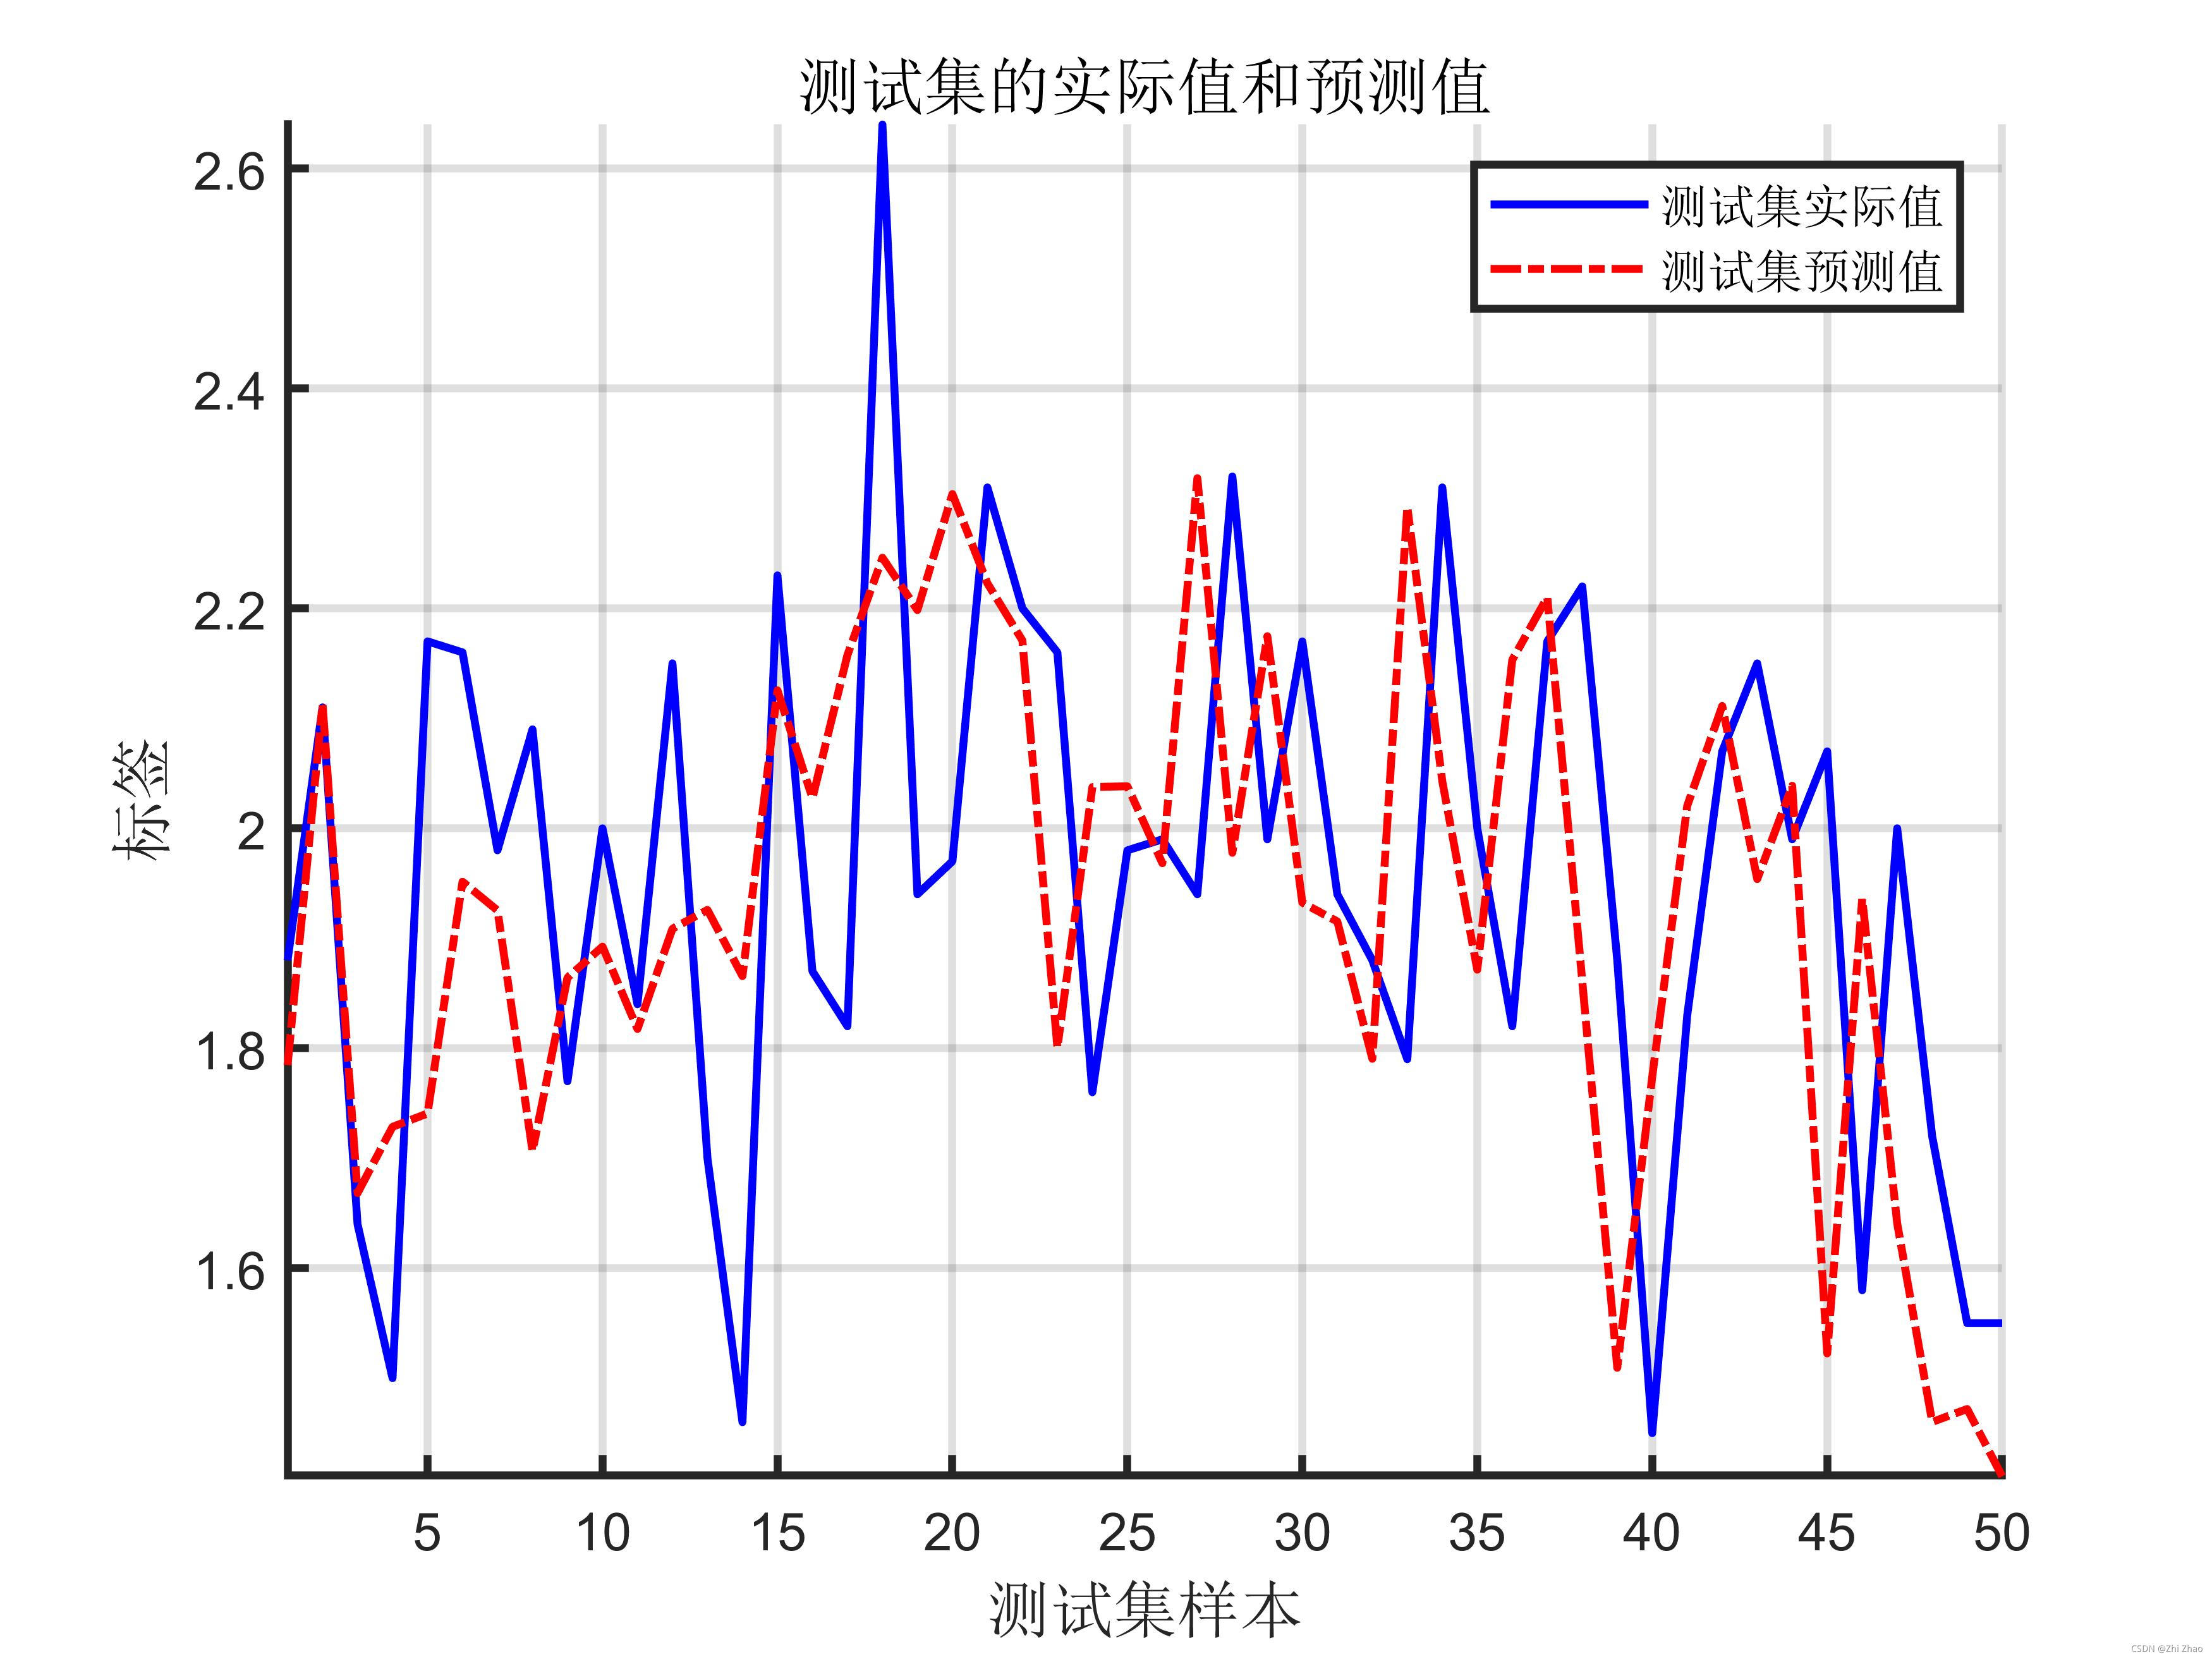
三、MATLAB代码
clc;
clear;
close all;
load Sample;
% 训练集与测试集的划分
[m,n] = size(Sample); % The data are of equal size
ratio = 2/3; % The proportion of training data
m_train = round(m*ratio); % 训练数据行数
train_sample = Sample(1:m_train,1:5); % Examples of training and test sets
test_sample = Sample(m_train+1:m,1:5);
train_labels = Sample(1:m_train,6); % Sample labels for training and test sets
test_labels = Sample(m_train+1:m,6);
% The samples of the training set and test set are normalized to [0,1]区间
[train_scale,ps] = mapminmax(train_sample',0,1);
train_x = train_scale';
test_scale = mapminmax('apply',test_sample',ps);
test_x = test_scale';
% The sample labels of the training and test sets are normalized to [0,1]区间
[train_lab,ps] = mapminmax(train_labels',0,1);
train_y = train_lab';
test_lab = mapminmax('apply',test_labels',ps);
test_y = test_lab';
%% SVM网络训练、验证与测试
cmd = ('-s 3 -t 2 -b 1');
model = svmtrain(train_y,train_x,cmd); %#ok<SVMTRAIN>
[predict_y,accuracy,prob_estimates] = svmpredict(test_y,test_x,model);
% 反归一化
predict_labels = mapminmax('reverse',predict_y,ps);
%% 结果分析
% 验证集、测试集的实际分类和预测分类图
figure;
hold on;
plot(test_labels,'b-');
plot(predict_labels,'r-.');
axis tight;
xlabel('测试集样本','FontSize',12);
ylabel('标签','FontSize',12);
legend('测试集实际值','测试集预测值');
title('The actual and predicted values for the test set','FontSize',12);
grid on;
参考资料
[1] matlabNormalization and denormalization functions——mapminmax
[2] svmtrain和svmpredictusage and parameter meanings
边栏推荐
猜你喜欢

随机推荐
Golang学习(三十五) go 连接redis
华为Mux VLAN 二层流量隔离
Oauth2.0 authentication server construction
SQL在MySQL中是如何执行的
UINIX 高级环境编程杂项之限制
关于导出聊天记录这件事……
Dcoker的安装及使用命令
华为单臂路由配置,实现不同vlan之间的通信
DOM —— 事件代理
adb常用命令
golang中使用泛型
smart_rtmpd 轻松突破 C100K 测试
APP版本更新通知流程测试要点
RTMP, RTSP, SRT 推流和拉流那些事
Mysql开启日志并按天进行分割
假的服务器日志(给history内容增加ip、用户等内容)
【数据读写】csv文件与xls/xlsx文件
CDN的加速原理是什么?
How to tick the word box?
webrtc 数据接收流程图解