当前位置:网站首页>如何在 go 程序中暴露 Prometheus 指标
如何在 go 程序中暴露 Prometheus 指标
2022-07-31 01:43:00 【TechForGeek】
SLI 与 SLO
SLI(服务质量指标) 指的是一个服务的某项服务质量的一个具体量化指标(如请求延迟、错误率、QPS)。
SLO(服务质量目标) 则是服务的某个 SLI 的目标值,例如,我们可以定义一个SLO,要求 95% 的请求的延迟小于 100ms。
SLI与SLO是传统运维转型SRE绕不过的主题,它们是SRE实践的核心。传统运维通常追求 100% 的可用性,但这个目标是不可能实现的,通过实施SLO,可以带来如下好处:
监控应用程序的行为,以便更好地改进应用程序
确定工作优先级,即开发新特性还是保障服务稳定性
作为控制手段使用,通过比较SLI与SLO,决定某项操作是否执行
建立用户预期
定义 SLI
要实施 SLO,首先要定义出来 SLI,而 Prometheus 监控则是定义 SLI 的一种很好的工具,下面将介绍在 Go 程序中暴露 Prometheus Metric 来定义 SLI。
在 Golang 程序中暴露 Prometheus 指标
按照 Prometheus 官方文档[1]中的说明,在 Golang 中暴露 Prometheus 指标,可以使用 Golang 的 Prometheus Client Library —— github.com/prometheus/client_golang。
接下来的例子中,我们使用 net/http 标准模块创建一个 /login 接口,然后使用 Golang 的 Prometheus Client Library 统计接口的访问次数。
foo.go:
package main

import (
    "net/http"

    "github.com/prometheus/client_golang/prometheus"
    "github.com/prometheus/client_golang/prometheus/promhttp"
)

var http_requests_total = prometheus.NewCounterVec(
    prometheus.CounterOpts{
        Name: "http_requests_total",
        Help: "Total Request",
    },
    []string{"path"})

func login(w http.ResponseWriter, r *http.Request) {
    http_requests_total.With(prometheus.Labels{"path": "login"}).Inc()
    // 使用 WithLabelValues() 函数可以不指定 Key 值
    // http_requests_total.WithLabelValues("login").Inc()
    w.Write([]byte("login success\n"))
}

func logout(w http.ResponseWriter, r *http.Request) {
    http_requests_total.With(prometheus.Labels{"path": "logout"}).Inc()
    // 使用 WithLabelValues() 函数可以不指定 Key 值
    // http_requests_total.WithLabelValues("login").Inc()
    w.Write([]byte("logout success\n"))
}

func init() {
    prometheus.MustRegister(http_requests_total)
}

func main() {
    http.Handle("/metrics", promhttp.Handler())
    http.HandleFunc("/login", login)
    http.HandleFunc("/logout", logout)
    http.ListenAndServe(":6060", nil)
}
执行如下命令运行上面的程序:
# 下载依赖模块
go get
# 运行程序
go run foo.go
使用 curl 命令访问 '/login' 接口:
curl http://SERVER-IP:6060/login然后访问 '/metrics' 接口获取 Prometheus Metric 信息:
curl -s http://ops-api.stonewise.cn:6060/metrics | grep login_requests_total输出内容如下:
# HELP login_requests_total Total Request
# TYPE login_requests_total counter
login_requests_total 1
可以看到,我们已经成功地统计了 '/login' 接口的访问次数了。
使用 Label 区分不同的 API
当我们程序中有多个 API 接口时,为每个 API 接口单独定义一个 metric,既麻烦又不便于管理,此时,我们可以定义一个 metric,然后在这个 metric 上添加 Label,使用 Label 来区分不同的 API 接口。
下面的例子中,我们在程序中定义了 '/login' 和 '/logout' 两个接口,然后定义了一个 prometheus metric —— http_requests_total,在这个 metric 上,我们添加了一个 Label —— path,通过这个 Label 来区分不同的 API。
foo.go:
package main

import (
    "net/http"

    "github.com/prometheus/client_golang/prometheus"
    "github.com/prometheus/client_golang/prometheus/promhttp"
)

var http_requests_total = prometheus.NewCounterVec(
    prometheus.CounterOpts{
        Name: "http_requests_total",
        Help: "Total Request",
    },
    []string{"path"})

func login(w http.ResponseWriter, r *http.Request) {
    http_requests_total.With(prometheus.Labels{"path": "login"}).Inc()
    // 使用 WithLabelValues() 函数可以不指定 Key 值
    // http_requests_total.WithLabelValues("login").Inc()
    w.Write([]byte("login success\n"))
}

func logout(w http.ResponseWriter, r *http.Request) {
    http_requests_total.With(prometheus.Labels{"path": "logout"}).Inc()
    // 使用 WithLabelValues() 函数可以不指定 Key 值
    // http_requests_total.WithLabelValues("login").Inc()
    w.Write([]byte("logout success\n"))
}

func init() {
    prometheus.MustRegister(http_requests_total)
}

func main() {
    http.Handle("/metrics", promhttp.Handler())
    http.HandleFunc("/login", login)
    http.HandleFunc("/logout", logout)
    http.ListenAndServe(":6060", nil)
}
执行如下命令运行上面的程序:
# 下载依赖模块
go get
# 运行程序
go run foo.go
使用 curl 命令访问 '/login' 接口:
curl http://SERVER-IP:6060/login使用 curl 命令访问 '/logout' 接口:
curl http://SERVER-IP:6060/logout
然后访问 '/metrics' 接口获取 Prometheus Metric 信息:
curl -s http://ops-api.stonewise.cn:6060/metrics | grep http_requests_total输出内容如下:
# HELP http_requests_total Total Request
# TYPE http_requests_total counter
http_requests_total{path="login"} 1
http_requests_total{path="logout"} 1
可以看到,http_requests_total 已经通过 path Label 来区分不同接口的统计信息了。
到这里,我们已经成功地在 Golang 程序中暴露 Prometheus 指标了。
有了 Counter 类型的指标 http_request_total,我们可以借助 Prometheus 的 rate() 函数来计算访问不同接口的 QPS,这样我们就定义好了一个 SLI。
总结
在这篇文章中,我们介绍了使用 Golang 的 github.com/prometheus/client_golang 模块,创建 Counter 类型的指标来统计不同接口的访问次数。 github.com/prometheus/client_golang 模块除了支持 Counter 类型的指标外,还支持gauge,summary,histogram 类型的 metric,使用方法都类似,详细的使用说明可以参考 prometheus_client 模块的文档说明[2]。
参考:
[1]: https://prometheus.io/docs/instrumenting/clientlibs/
[2]: https://github.com/prometheus/client_golang
一如既往,如果你对文章中的内容有任何疑问,或者是发现文章中有任何错误,都可以通过留言告诉我;如果你喜欢我的文章,欢迎关注我的微信公众号 Tech For Geek.
边栏推荐
猜你喜欢

九州云获评云计算标准化优秀成员单位
1.非类型模板参数 2.模板的特化 3.继承讲解

软件测试要达到一个什么水平才能找到一份9K的工作?
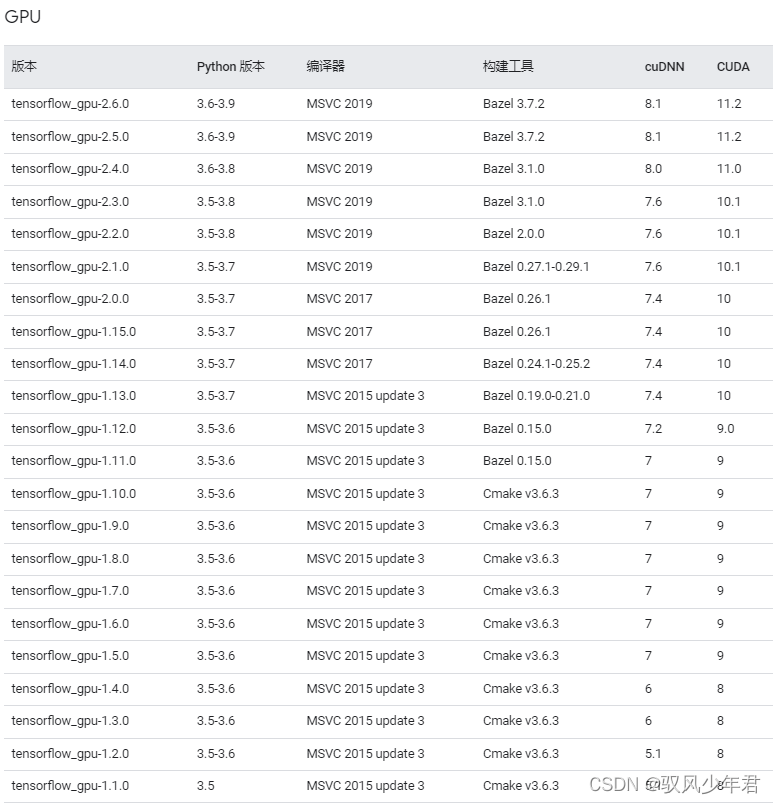
tensorflow与GPU版本对应安装问题

关于Redis相关内容的基础学习

解析云原生消息流系统 Apache Pulsar 能力及场景

《MySQL数据库进阶实战》读后感(SQL 小虚竹)

RTL8720DN开发笔记一 环境搭建与mqtt实例
Xiaohei's leetcode journey: 117. Fill the next right node pointer of each node II

JPEG Steganalysis of Digital Image Steganography
随机推荐
VSCode Plugin: Nested Comments
【genius_platform软件平台开发】第七十四讲:window环境下的静态库和动态库的一些使用方法(VC环境)
MySQL stored procedure
coldfusion8后台计划任务拿shell
Parameter introduction and selection points of wireless module
射频器件的基本参数1
leetcode-399:除法求值
"Real" emotions dictionary based on the text sentiment analysis and LDA theme analysis
九州云入选“可信云最新评估体系及2022年通过评估企业名单”
Jetpack Compose学习(8)——State及remeber
Ticmp - 更快的让应用从 MySQL 迁移到 TiDB
The difference between 4G communication module CAT1 and CAT4
内网渗透——提权
SQLserver查询最近三个月的数据,语句该怎么写sqlserver
keep-alive缓存组件
【Map与Set】之LeetCode&牛客练习
TiKV主要内存结构和OOM排查总结
软件测试要达到一个什么水平才能找到一份9K的工作?
Gateway路由的配置方式
Nacos