当前位置:网站首页>Case study on comprehensive competitiveness of principal components
Case study on comprehensive competitiveness of principal components
2022-07-01 18:37:00 【spssau】
One 、 Case background
1. Case description
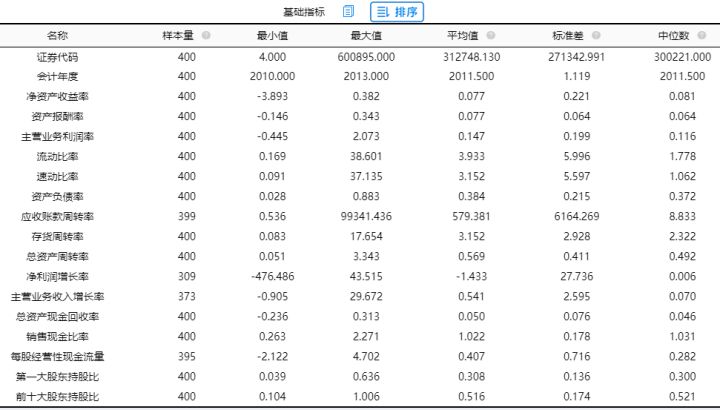
Research, research 100 companies 2010-2013 Specific data on finance in , These financial indicators are profitability 、 Solvency 、 Operational capability 、 Development capabilities and corporate governance . There are several analysis items for each dimension , But some indicators are the bigger the better , Some indicators are as small as possible . Data processing is required before research .
2. research objective
The main purpose of this case is to use data for principal component analysis , Finally, the principal component ranking or competitiveness ranking of each company , Use component scores to analyze the performance of each company in 2010-2013 In, the ranking of each dimension and the final comprehensive score ranking , And find the top 20 The company .
Two 、 Data processing
The purpose of principal component is to use a few components to describe the relationship between many indicators or factors , Put several closely related variables into the same category , Each type of variable becomes a component ( The reason why it is called ingredient , Because it is unobservable , That is, it is not a specific variable ), On the premise of minimum information loss , Reflect most of the information of the original data with a few components .
Before the principal component , Because each index in the selected index system has its own dimension and variation differences , This brings inconvenience to comprehensive analysis and modeling , So we need to preprocess the collected data , To eliminate the influence of dimensional and variation differences . Generally, the processing of data includes standardization processing (Z-score Law )、 Forward processing 、 Averaging treatment, etc .
Some indicators in this case need to be handled in advance , The specific subordinate dimensions of indicators and the nature of indicators are as follows , For example, the asset responsibility rate is a reverse indicator, which can be reversed or counted backwards ; However, the data of the analysis item needs to be greater than 0, Other indicators need to be treated in a positive way , Of corporate governance 2 Indicators can be treated positively or moderately , For example, the bigger the index is, the better, and the smaller the index is, the better , If you think it is better to be close to a certain value or within a certain range, then use moderation , In this case, it is considered that the larger the better, and it is treated as positive ( There are also references for moderation , It is suggested to give priority to references ).

First use SPSSAU Analyze items “ Describe the analysis ” Observe the basic situation of the data . It is found that all data of asset liability ratio are greater than 0, So you can directly “ Take the bottom ”.
The analysis results come from SPSSAU
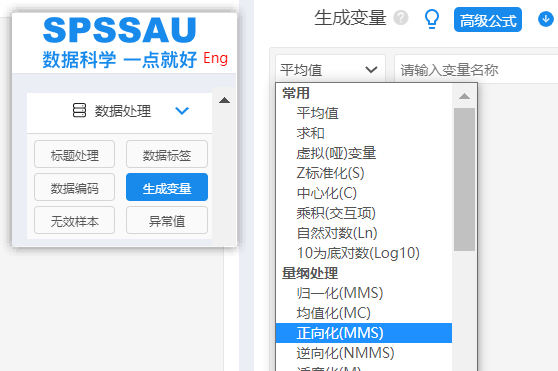
And then use it SPSSAU“ Data processing ” Medium “ Generating variables ” Conduct index processing ( Generally, standardization is not required after the forward and reverse processing , Because the forward and reverse transformation has dealt with dimensional problems , But it needs to be standardized after taking the reciprocal ).
3、 ... and 、 The principal components
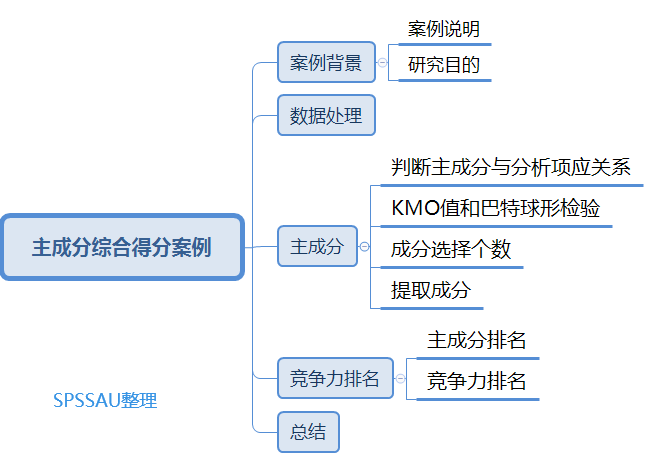
The principal component results are divided into 4 Parts of , Judge the corresponding relationship between principal components and analysis items 、KMO Value and Barth ball test 、 Select the number of ingredients and extract ingredients .
1. Judge the relationship between principal components and analysis items
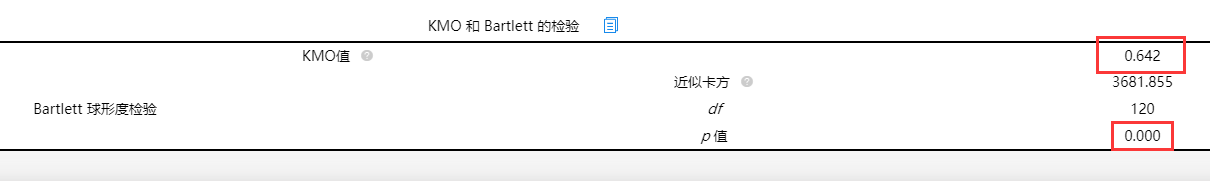
Using principal component analysis for information enrichment research , First, analyze whether the research data is suitable for principal component analysis , As can be seen from the table above :KMO by 0.642, Greater than 0.6, Meet the prerequisite requirements of principal component analysis , It means that the data can be used for principal component analysis . And data through Bartlett Sphericity test (p<0.05), It shows that the research data is suitable for principal component analysis .
The relationship between components and corresponding items :
In general , If 16 Item and 5 The corresponding relationship between the components , Inconsistent with professional knowledge , For example, the first item is divided under the first component , At this time, it indicates that this item may be deleted , It appears ‘ the wrong person ’ The phenomenon . Therefore, some unreasonable items may be deleted during analysis . besides , It's also possible that ‘ become entangled in ’ The phenomenon .
- “ the wrong person ”
In general , If 16 Item and 5 The corresponding relationship between the components , Inconsistent with professional knowledge , For example, the first item is divided under the first component , At this time, it indicates that this item may be deleted , It appears ‘ the wrong person ’ The phenomenon . For example, in the case of “ Turnover rate of accounts receivable ” It should belong to ingredients 2 It is divided into other components during analysis .
- “ become entangled in ”
except “ the wrong person ” The phenomenon , Sometimes there will be ‘ become entangled in ’ The phenomenon , For example, in the case of “ Return on equity ” It can be attributed to ingredients 1, composition 2, It can also be attributed to ingredients 3, This is more normal ( Referred to as ‘ become entangled in ’), It needs to be handled in combination with the actual situation , This item can be deleted , You can also not delete , At this time , Analysis is somewhat subjective .
Principal component analysis is a repeated process , For example, after deleting one or more question items , Then it needs to be analyzed again for comparison and selection . The ultimate goal is : Correspondence between components and analytical items , Basically consistent with the professional knowledge .
Step1: The first analysis
This example contains 16 Analysis items , this 16 The analysis items are divided into 5 Dimensions , Therefore, you can take the initiative to tell SPSSAU, this 16 Items are five dimensions , otherwise SPSSAU It will automatically determine how many ingredients ( Usually, the automatic judgment of software is quite different from the actual situation , Therefore, it is suggested to actively set the number of ingredients ). Here's the picture :
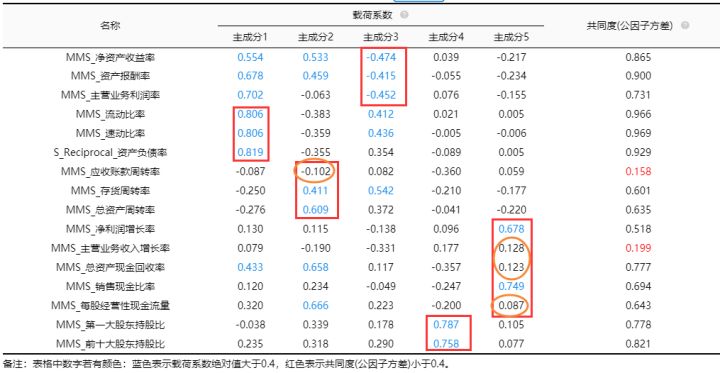
As can be seen from the above figure :
“ Current ratio ”、“ Quick ratio ” as well as “ Asset-liability ratio ” this 3 term , They all correspond to ingredients 1, The variance of common factors is higher than 0.4, Illustrate this 3 Items should belong to the same dimension , That is, logically this 3 term , It didn't show up “ the wrong person ” The phenomenon . But there are “ become entangled in ” The situation of . Not to deal with temporarily .“ Turnover rate of accounts receivable ”、“ Inventory turnover ”、“ Turnover of total assets ” They correspond to ingredients 2, However, the common degree of the turnover rate of accounts receivable is less than 0.4 So it needs to be deleted . “ Return on equity ”、“ Return on assets ” as well as “ Profit margin of main business ” common 3 term , this 3 Items correspond to components 3, this 3 Item does not appear ‘ the wrong person ’ problem , But there was “ become entangled in ”.“ The shareholding ratio of the largest shareholder ” and “ Shareholding ratio of top ten shareholders ” common 2 term , They all correspond to ingredients 4, It didn't show up “ become entangled in ” The phenomenon of .“ Net profit growth rate ”、“ Main business income growth rate ”、“ Cash recovery rate of total assets ”、“ Sales cash ratio ” as well as “ Operating cash flow per share ” common 5 term , When they correspond to ingredients 5, “ Main business income growth rate ”、“ Cash recovery rate of total assets ” as well as “ Operating cash flow per share ” appear “ the wrong person ” Delete it .
Summing up the above analysis, we can see :“ Main business income growth rate ”、“ Cash recovery rate of total assets ” as well as “ Operating cash flow per share ” These three items appear “ the wrong person ”, These three items should be deleted ;“ Turnover rate of accounts receivable ” The degree of commonality is less than 0.4 It needs to be deleted , And others appear “ become entangled in ” Phenomenal , Do not deal with ( Just pay attention ). Re analyze as follows .
Step2: The second analysis
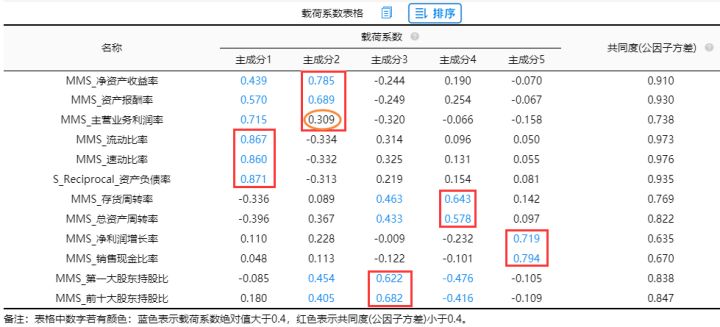
It can be seen from the figure above “ Profit margin of main business ” appear ‘ the wrong person ’ The phenomenon , Should delete , as well as “ Return on assets ”、“ Return on assets ” Etc ‘ become entangled in ’ The phenomenon , Not to deal with temporarily , But attention should be paid . Summing up : Should be “ Profit margin of main business ” Delete it first and then proceed to the... Again 3 dimensional analysis .
Step3: The third analysis
take “ Profit margin of main business ” The analysis after deletion is as follows :

It can be seen from the figure above
except “ Current ratio ”、“ Quick ratio ” as well as “ Asset-liability ratio ” this 3 term ,“ Net profit growth rate ”、“ Sales cash ratio ” These two , The remaining items exist “ become entangled in ” The phenomenon of , But considering the composition, there are only two items left , Therefore, it means that it is acceptable , End of main component analysis .
2.KMO Value and Barth ball test

Using principal component analysis for information enrichment research , First, analyze whether the research data is suitable for principal component analysis , As can be seen from the table above :KMO by 0.605, Greater than 0.6, Meet the prerequisite requirements of principal component analysis , It means that the data can be used for principal component analysis . And data through Bartlett Sphericity test (p<0.05), It shows that the research data is suitable for principal component analysis .
3. Number of component choices
When the data is determined that principal component analysis can be used , Next, determine the number of principal components . utilize SPSSAU Select the principal component analysis method to judge the number of selected components . There is no precise quantitative method for determining the number of components , But the commonly used method is to determine the number of components with the help of three criteria . First, the eigenvalue criterion , The second is the gravel map inspection criteria , Third, professional knowledge judgment . The eigenvalue criterion is to select eigenvalues greater than or equal to 1 As the initial component , The abandonment characteristic value is less than 1 The principal component of . The gravel diagram test criterion is to draw a broken line diagram of the characteristic value changing with the number of components according to the order in which the components are extracted , Judge the number of components according to the shape of the graph . The characteristic of line chart is from high to low , First steep, then flat , Finally, it almost forms a straight line . The point before the curve begins to flatten is considered to be the maximum fraction extracted . Professional knowledge judgment method is combined with their own professional knowledge , The number of subjective judgment components . This part uses characteristic root value and gravel map to judge .

Variance interpretation rate table It is mainly used to judge how many principal components are suitable . And the variance interpretation rate and cumulative variance interpretation rate of each principal component . The larger the variance interpretation rate, the more the principal components contain the original data information .
The above table aims at the extraction of principal components , And the amount of information extracted by principal component analysis , It can be seen from the above table that : Principal component analysis extracted a total of 5 A principal component , Eigenvalues are greater than 1, this 5 The variance interpretation rates of the principal components are 29.083%,18.253%,14.734%,12.376%,11.033%, The cumulative variance interpretation rate is 85.479%.( Tips : If the number of principal components extracted is not as expected , You can actively set the number of principal components during analysis ). in addition , A total of... Were extracted in this analysis 5 A principal component , Their corresponding weighted variance interpretation rate, i.e. weight, is :29.083/85.479=34.02%;18.253/85.479=21.35%;14.734/85.479=17.24%;12.376/85.479=14.48%;11.033/85.479=12.91%; meanwhile SPSSAU Gravel map is also provided to help researchers judge the number of principal component extraction .
Characteristic root Generally, it refers to the contribution of each component . The sum of this value matches the number of items , The higher the value , The greater the contribution of the principal components . Of course, principal component analysis usually needs to integrate their own professional knowledge and comprehensive judgment , Even if the eigenvalue is less than 1, You can also set ingredients . In principal component analysis , The researchers did not preset scores , The system will take the characteristic root “ Greater than 1” Divide the criteria . It can be seen that there are five eigenvalues greater than 1, It is reasonable to extract five components , In addition to the characteristic root SPSSAU It also provides a more intuitive gravel map to help judge .

At the same time, the number of principal components extracted can be determined by combining with the gravel map . When the broken line suddenly becomes smooth from steep , The number of principal components corresponding to steep to stable is the number of reference extracted principal components . In practical research, more professional knowledge , Combined with the corresponding relationship between principal components and research items , The number of principal components is obtained through comprehensive weighing and judgment .
As you can see from the diagram , The horizontal axis indicates the number of indicators , The vertical axis represents the eigenvalue , When extracted 5 When two components , The change of eigenvalue is obvious ; When extracted 5 Later ingredients , The change of characteristic root is relatively stable , The contribution to the original variables is relatively small , It can be seen that 5 The three components have significant effects on the original variables . The gravel map only assists in determining the number of components , If analyzed from this figure 6 Ingredients are also ok .
This case is extracted according to professional knowledge 5 Ingredients , If there is no preset number of components, the system can make decisions by default .
4. Extract ingredients
The number of component selections has been determined. After analysis, the load coefficient matrix is as follows :
Load factor table , It mainly shows the information extraction of principal components for the research items , And the corresponding relationship between principal components and research items . The blue value represents that the absolute value of the load factor is greater than 0.4. Common degree Represents the amount of information that can be extracted from a question item , The higher the degree of commonality, the higher the degree to which the index can be explained by the principal component , The more information is extracted . General with 0.4 As a standard .
As can be seen from the results , The principal components 1 Reflect in “ Current ratio ”、“ Quick ratio ” as well as “ Asset-liability ratio ” common 3 Information of indicators , They mainly reflect the solvency of the company . The principal components 2 Reflected in “ Return on equity ”、“ Return on assets ” common 2 They mainly reflect the profitability of the company , The principal components 3 Reflected in “ The shareholding ratio of the largest shareholder ” and “ Shareholding ratio of top ten shareholders ” common 2 term , They mainly reflect the ability of corporate governance , The principal components 4 Reflected in “ Inventory turnover ”、“ Turnover of total assets ” common 2 term , They mainly reflect the operating capacity of the company , The principal components 5 Reflected in “ Net profit growth rate ”、 “ Sales cash ratio ”, They mainly reflect the development ability of the company .
Sort out the table as follows : The names of the five ingredients are F1 Solvency 、F2 Profitability 、F3 Governance 、F4 Operational capacity and F5 Develop ability .

Four 、 Competitive ranking
The larger the principal component, the more competitive it is , The higher the comprehensive score, the stronger the comprehensive competitiveness of the company , And the principal component and comprehensive scores are SPSSAU The analysis is as follows . It is divided into two parts: main component ranking and competitiveness ranking .
Principal component ranking
Component score coefficient matrix


Directly SPSSAU Upper right corner “ My data ” You can also download to view the component scores .
Next, the output of each company in 2010-2013 Ranking of components in ( Before show only 20 term ):
- Solvency
| Sort | name | Solvency |
| 1 | Shuanglu Pharmaceutical Co., Ltd | 16.41 |
| 2 | Qianhong Pharmaceutical Co., Ltd | 13.03 |
| 3 | Made by hualan bio-engineering | 7.40 |
| 4 | Zhi Fei biology | 6.78 |
| 5 | Cable car glides god | 6.20 |
| 6 | Big Huanong | 5.77 |
| 7 | Boya Biology | 5.39 |
| 8 | Shanghai Rex | 4.56 |
| 9 | Guan Hao biology | 3.78 |
| 10 | Jindawei | 3.23 |
| 11 | Kehua Biology | 3.20 |
| 12 | Anke Biology | 2.40 |
| 13 | Dong'e donkey hide gelatin | 2.07 |
| 14 | Jilin Aodong | 2.04 |
| 15 | Rip biology | 2.03 |
| 16 | Four ring creatures | 1.77 |
| 17 | Star River creatures | 1.38 |
| 18 | Tong Hua Dong Bao | 1.28 |
| 19 | Tianshan creatures | 1.01 |
| 20 | Watson Biology | 0.70 |
For the profitability of the company , Use PivotTable to sum the scores of principal components , According to the data, the best is “ Shuanglu Pharmaceutical Co., Ltd ” The second is “ Qianhong Pharmaceutical Co., Ltd ” front 20 The name is shown in the table above .
2) Profitability
| Sort | name | Profitability |
| 1 | China Resources 39 | 7.17 |
| 2 | China animal husbandry Co., Ltd | 6.81 |
| 3 | Shanghai Rex | 6.18 |
| 4 | Is state science and technology | 5.79 |
| 5 | Dabei agriculture | 5.48 |
| 6 | Tsingtao Beer | 5.38 |
| 7 | Elliot | 4.61 |
| 8 | China Resources crane | 4.45 |
| 9 | Tiantan biology | 4.35 |
| 10 | AUCMA | 4.03 |
| 11 | Yueda investment | 3.68 |
| 12 | Dong'e donkey hide gelatin | 3.35 |
| 13 | Yanjing Beer | 3.24 |
| 14 | Zhangzi Island | 3.14 |
| 15 | Golden seed wine | 3.08 |
| 16 | Kehua Biology | 3.03 |
| 17 | Wanxiang Denong | 3.03 |
| 18 | Bright Dairy | 2.98 |
| 19 | Days kang biological | 2.95 |
| 20 | Shuanglu Pharmaceutical Co., Ltd | 2.95 |
For the profitability of the company , Use PivotTable to sum the scores of principal components , According to the data, the best is “ China Resources 39 ” The second is “ China animal husbandry Co., Ltd ” front 20 The name is shown in the table above .
3) Governance
| Sort | name | Governance |
| 1 | Chengzhi Co., Ltd | 7.992604 |
| 2 | Is state science and technology | 7.153529 |
| 3 | Zhi Fei biology | 6.679127 |
| 4 | Melo pharmaceutical | 6.650961 |
| 5 | Qianhong Pharmaceutical Co., Ltd | 4.80757 |
| 6 | Bright Dairy | 4.745864 |
| 7 | Days kang biological | 3.93622 |
| 8 | Cable car glides god | 3.915128 |
| 9 | Dabei agriculture | 3.838614 |
| 10 | China Resources crane | 3.812249 |
| 11 | Yangnong chemical industry | 3.253352 |
| 12 | Rip biology | 3.20509 |
| 13 | Yanjing Beer | 2.992444 |
| 14 | Jindawei | 2.920408 |
| 15 | Star River creatures | 2.850168 |
| 16 | Sihuan pharmaceutical | 2.731311 |
| 17 | China Resources 39 | 2.618381 |
| 18 | Boya Biology | 2.598811 |
| 19 | China animal husbandry Co., Ltd | 2.353754 |
| 20 | Shenhua holding | 2.292654 |
For corporate governance , Use PivotTable to sum the scores of principal components , According to the data, the best is “ Chengzhi Co., Ltd ” The second is “ Is state science and technology ” front 20 The name is shown in the table above .
4) Operational capability
| Sort | name | Operational capability |
| 1 | Is state science and technology | 9.41 |
| 2 | Chengzhi Co., Ltd | 7.50 |
| 3 | Shuanglu Pharmaceutical Co., Ltd | 6.43 |
| 4 | Kehua Biology | 5.79 |
| 5 | Shenhua holding | 5.73 |
| 6 | COFCO biochemistry | 5.39 |
| 7 | Sanonda A | 4.96 |
| 8 | Sea King creatures | 4.76 |
| 9 | Dabei agriculture | 4.35 |
| 10 | Huabei Pharmaceutical Co., Ltd | 4.22 |
| 11 | Dong'e donkey hide gelatin | 3.81 |
| 12 | Bright Dairy | 3.64 |
| 13 | Big Huanong | 3.37 |
| 14 | Yangnong chemical industry | 3.15 |
| 15 | Qianhong Pharmaceutical Co., Ltd | 3.15 |
| 16 | Weiyuan biochemical | 2.79 |
| 17 | Four ring creatures | 2.69 |
| 18 | Ronghua Industrial Co., Ltd | 2.45 |
| 19 | Xin'an stock | 2.45 |
| 20 | hops | 2.34 |
For the company's operating capacity , Use PivotTable to sum the scores of principal components , According to the data, the best is “ Is state science and technology ” The second is “ Chengzhi Co., Ltd ” front 20 The name is shown in the table above .
5) Develop ability
| ranking | name | Develop ability |
| 1 | Chengzhi Co., Ltd | 6.99 |
| 2 | Four ring creatures | 4.94 |
| 3 | Zhongyuan Concord | 4.84 |
| 4 | COFCO biochemistry | 4.32 |
| 5 | Is state science and technology | 4.31 |
| 6 | Bright Dairy | 4.15 |
| 7 | Wuzhong, Jiangsu | 3.59 |
| 8 | Qianhong Pharmaceutical Co., Ltd | 2.99 |
| 9 | AUCMA | 2.94 |
| 10 | Qinghai gelatin | 2.79 |
| 11 | Xin'an stock | 2.75 |
| 12 | Dawn biology | 2.61 |
| 13 | Yangnong chemical industry | 2.42 |
| 14 | Sea King creatures | 2.39 |
| 15 | Weiyuan biochemical | 2.01 |
| 16 | Ronghua Industrial Co., Ltd | 1.92 |
| 17 | hops | 1.79 |
| 18 | Big Huanong | 1.79 |
| 19 | Yanjing Beer | 1.73 |
| 20 | Hainanhaiyao | 1.64 |
For the development ability of the company , Use PivotTable to sum the scores of principal components , According to the data, the best is “ Chengzhi Co., Ltd ” The second is “ Four ring creatures ” front 20 The name is shown in the table above .
2. Competitive ranking
about “ Comprehensive score ”SPSSAU It is very convenient to provide one click to generate comprehensive scores , After analysis, click my data in the upper right corner to view it , The specific calculation is as follows :
The comprehensive score is equal to the result obtained by multiplying the score of each principal component by the sum of their respective weights .
That is to say : Comprehensive score F value =a1*F1+a2*F2+a3*F3+a4*F4+a5*F5, ai=Fi Variance interpretation rate / The total variance interpretation rate (i from 1 To 5); Solve to get a1 To a5 The values of are 34.02%,21.35%,17.24%,14.48%,12.91%.
F=34.02%* The principal components 1 score +21.35%* The principal components 2 score +17.24%* The principal components 3 score +14.48%* The principal components 4 score +12.91%* The principal components 5 score ;
So finally calculate the comprehensive score of each company F value , The ranking of financial competitiveness is shown in the following table ( The intermediate process can be handled by PivotTable ):
- Some results of the pivot table are as follows

- The final results are as follows
| 1 | Shuanglu Pharmaceutical Co., Ltd | 1.73114 |
| 2 | Qianhong Pharmaceutical Co., Ltd | 1.726451 |
| 3 | Zhi Fei biology | 1.018631 |
| 4 | Boya Biology | 1.011556 |
| 5 | Is state science and technology | 0.987016 |
| 6 | Cable car glides god | 0.802011 |
| 7 | Jindawei | 0.747585 |
| 8 | Made by hualan bio-engineering | 0.593216 |
| 9 | Big Huanong | 0.553165 |
| 10 | Shanghai Rex | 0.525126 |
| 11 | Dabei agriculture | 0.499163 |
| 12 | Chengzhi Co., Ltd | 0.49584 |
| 13 | Star River creatures | 0.391593 |
| 14 | Tsingtao Beer | 0.35341 |
| 15 | Bright Dairy | 0.346792 |
| 16 | Guan Hao biology | 0.330535 |
| 17 | China animal husbandry Co., Ltd | 0.316433 |
| 18 | Jinhe creatures | 0.282712 |
| 19 | Kehua Biology | 0.272181 |
| 20 | China Resources crane | 0.262264 |
5、 ... and 、 summary
This case carries out principal component analysis on the data and describes the component score and comprehensive score , First, process the data , Use SPSSAU Generate variable function , Then judge the corresponding relationship between the principal components and the analysis items , And describe the number of ingredients selected and the extracted ingredients , Next, the competitiveness is ranked, and the component score is used to analyze the performance of each company in 2010-2013 Due to too much data, the results are only shown in the top 20 Famous companies , And specifically describe the calculation of the comprehensive score to get the final comprehensive score ranking . This analysis is over .
For more dry goods, please go to SPSSAU Official website view .
边栏推荐
- Find all missing numbers in the array
- [noip2015] jumping stone
- R语言ggplot2可视化:gganimate创建动态柱状图动画(gif)、在动画中沿给定维度逐步显示柱状图、enter_grow函数和enter_fade函数控制运动内插退出(渐变tweening)
- 1380. Lucky number in matrix / 1672 Total assets of the richest customers
- Apk signature process introduction [easy to understand]
- 每周推荐短视频:警惕“现象”与“问题”相互混淆
- [today in history] February 15: Pascal's father was born; YouTube was founded; Kotlin language comes out
- The ultimate version of the 13th simulation of the single chip microcomputer provincial competition of the Blue Bridge Cup
- 信度系数低怎么办?信度系数具体怎么算?
- Localization through custom services in the shuttle application
猜你喜欢
Bug of QQ browser article comment: the commentator is wrong

Classpath classpath

Highly reliable program storage and startup control system based on anti fuse FPGA and QSPI flash

必看,时间序列分析
1380. Lucky number in matrix / 1672 Total assets of the richest customers
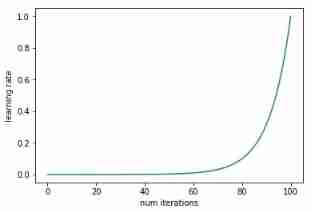
How to find the optimal learning rate
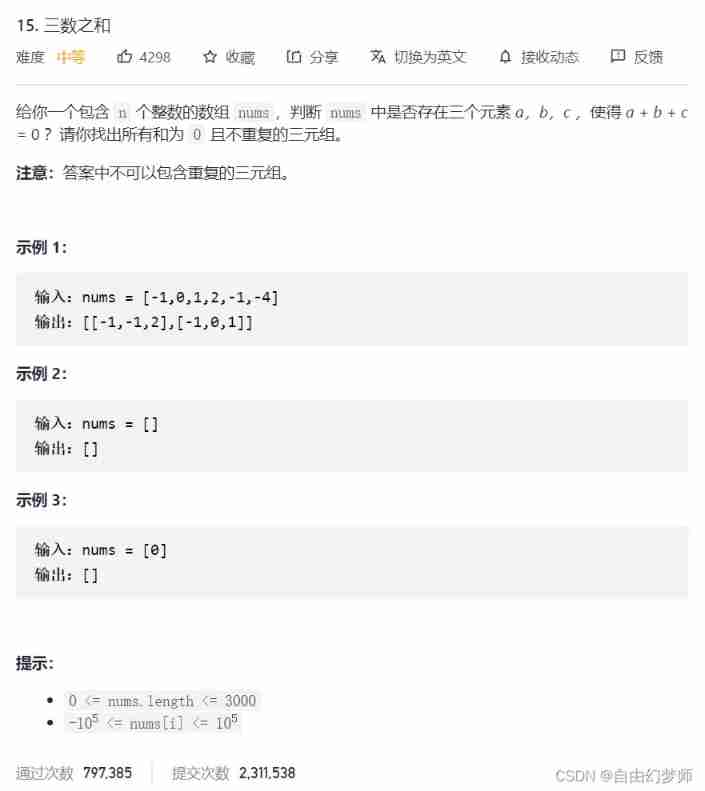
Sum of three numbers

Cloud picture says | distributed transaction management DTM: the little helper behind "buy buy buy"
Growing up in the competition -- (Guangyou's most handsome cub) Pikachu walking

Unity learning fourth week
随机推荐
. Net cloud native architect training camp (permission system code implements actionaccess) -- learning notes
信度系数低怎么办?信度系数具体怎么算?
Is Alipay wallet convenient to use?
Distributed task queue: Celery usage record
1380. Lucky number in matrix / 1672 Total assets of the richest customers
Flex layout
[today in history] February 15: Pascal's father was born; YouTube was founded; Kotlin language comes out
Review Net 20th anniversary development and 51aspx growth
Blue Bridge Cup real topic: the shortest circuit
. Net cloud native architect training camp (permission system code implements actionaccess) -- learning notes
Growing up in the competition -- (Guangyou's most handsome cub) Pikachu walking
创建您自己的NFT集合并发布一个Web3应用程序来展示它们(介绍)
To improve the efficiency of office collaboration, trackup may be the best choice
Yuancosmos game farmersworld farmers world - core content of the second conference in China!
R语言ggplot2可视化:可视化折线图、使用labs函数为折线图添加自定义的Y轴标签信息(customize y axis label)
Record 3 - the state machine realizes key control and measures the number of external pulses
Easycvr accesses the equipment through the national standard gb28181 protocol. What is the reason for the automatic streaming of the equipment?
Bernoulli distribution (a discrete distribution)
Leetcode-141环形链表
Find all missing numbers in the array