当前位置:网站首页>Matplotlib swordsman line - layout guide and multi map implementation (Updated)
Matplotlib swordsman line - layout guide and multi map implementation (Updated)
2022-07-02 09:12:00 【Qigui】
Individuality signature : The most important part of the whole building is the foundation , The foundation is unstable , The earth trembled and the mountains swayed . And to learn technology, we should lay a solid foundation , Pay attention to me , Take you to firm the foundation of the neighborhood of each plate .
Blog home page : Qigui's blog
Included column :Python The Jianghu cloud of the three swordsmen
From the south to the North , Don't miss it , Miss this article ,“ wonderful ” May miss you yo
Triple attack( Three strikes in a row ):Comment,Like and Collect—>Attention
List of articles
Layout guide
A simple example
stay Matplotlib in , Axis ( Including subgraphs ) The position of is in the standardized graphic coordinates , Your axis label or title ( Sometimes even scale labels ) Beyond the graphic area , So you need to edit .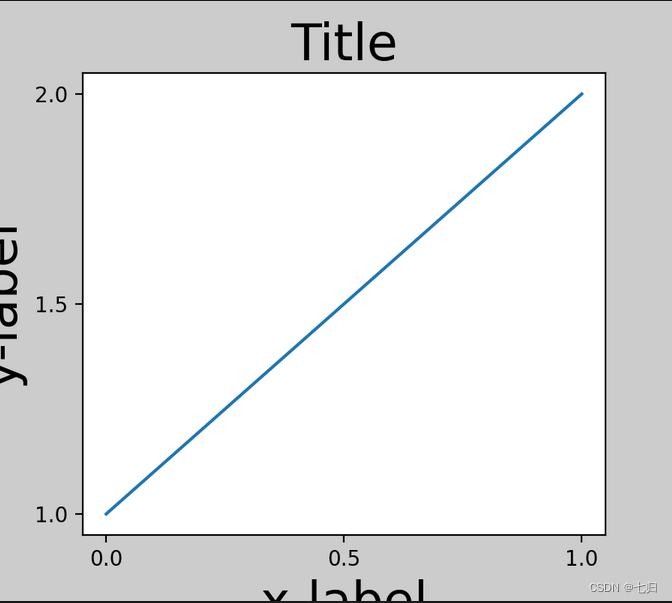
To prevent this , The position of the shaft needs to be adjusted .
- By adjusting the subgraph parameters Figure.subplots_adjust. To manually complete however , use constrained_layout=True Keyword parameters will be adjusted automatically .
- This Figure.tight_layout It's auto filled
- tight_layout() The subgraph spacing will also be adjusted to minimize overlap
- tight_layout() You can use keyword parameters pad , w_pad and h_pad , Controls the additional padding around the graph boundary and between subgraphs
fig, ax = plt.subplots(constrained_layout=True)
example_plot(ax, fontsize=24)
When you have multiple subgraphs , You usually see that different label axes overlap each other
fig, axs = plt.subplots(2, 2, constrained_layout=False)
for ax in axs.flat:
    example_plot(ax)
- Output image :
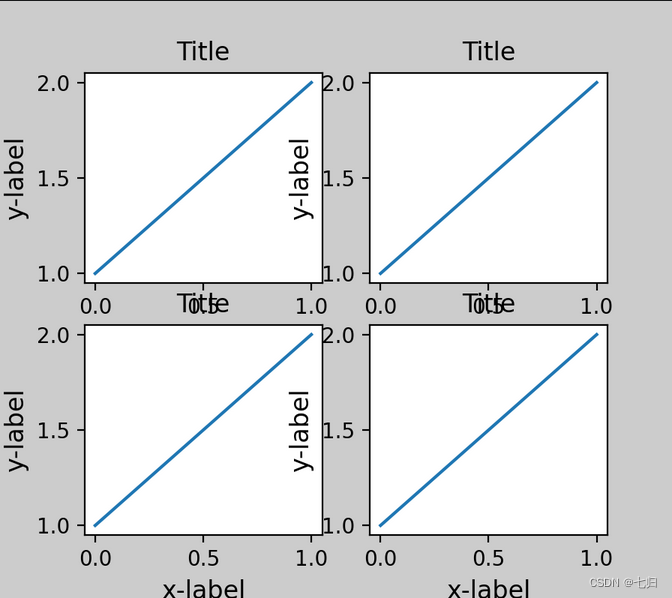
- Calling plt.subplots Appoint constrained_layout=True, Make the layout properly constrained
- tight_layout The function can adjust the relative size of the subgraph so that the characters do not overlap
fig, axs = plt.subplots(2, 2, constrained_layout=True)
for ax in axs.flat:
    example_plot(ax)
- Output image :

subtitle —— title
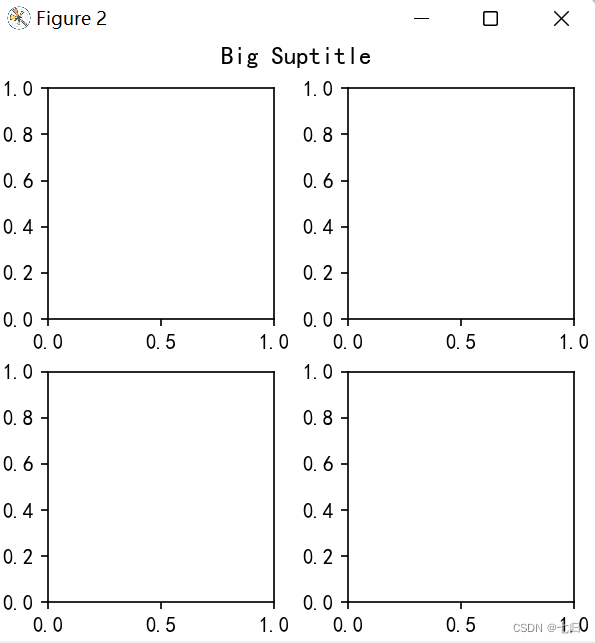
- constrained_layout You can also make room to set the title suptitle.
fig, axs = plt.subplots(2, 2, figsize=(4, 4), constrained_layout=True)
fig.suptitle('Big Suptitle')
plt.show()
- Output image :
Legend has it that —— legend
The legend can be placed outside its parent axis . Constrained layout is designed to deal with this problem Axes.legend(). however , Constrained layouts do not handle legends created by Figure.legend().
fig, ax = plt.subplots(constrained_layout=True)
ax.plot(np.arange(10), label='This is a plot')
ax.legend(loc='center left', bbox_to_anchor=(0.8, 0.5))
- Output image :
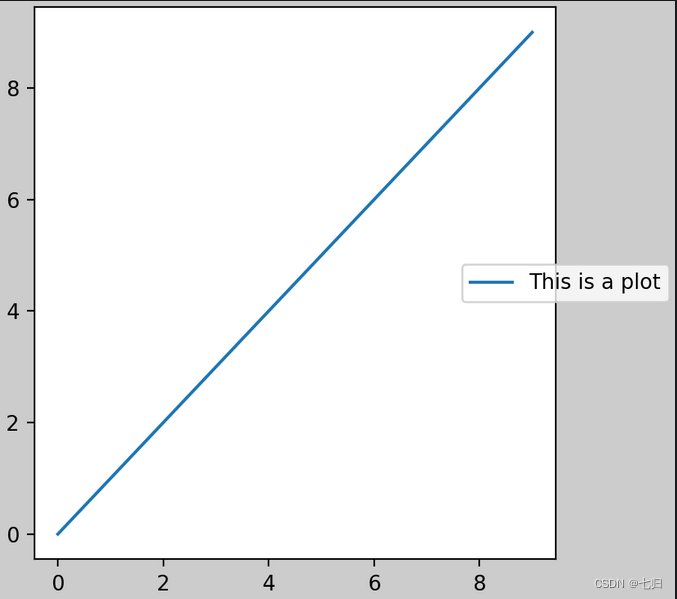
however , When there are multiple subgraphs, this will compress the space of the subgraph layout 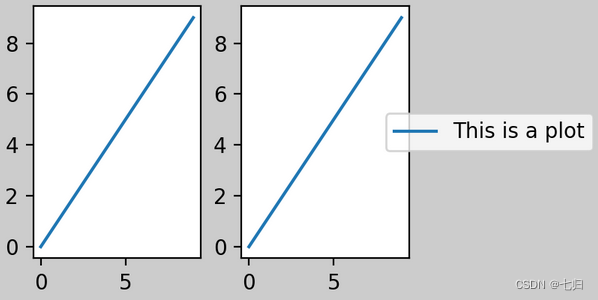
A better way to solve this embarrassment is to simply use the provided legend method Figure.legend: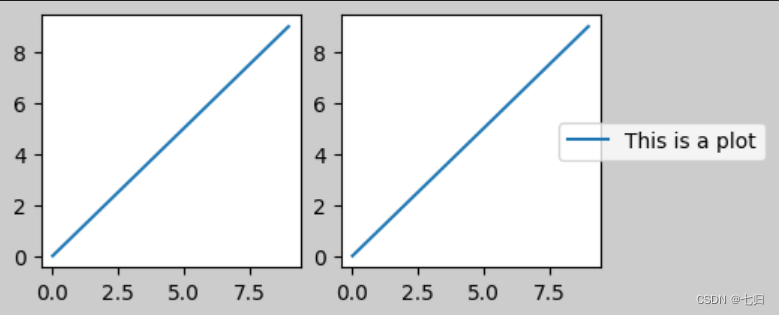
Filling and spacing
- Filling between shafts , Horizontal by w_pad and wspace And vertical by h_pad and hspace
- This can be done by set_constrained_layout_pads( w/h_pad, w/hspace) edit
- The spacing between subgraphs is determined by wspace and hspace Set up
- It can also be done through plt.subplots_adjust(wspace=0,hspace=0) Set up
- wspace,hspace: Used to control the percentage of width and height , such as subplot The gap between
Multi graph implementation
More pictures ——plt.subplots
subplots Parameters
plt.subplots(nrows, ncols, index, sharex, sharey)
- nrows Row number of subgraphs
- ncols Number of columns in a subgraph
- index Take the index of the subgraph
- sharex All subgraphs use the same x Axis scale
- sharey All subgraphs use the same y Axis scale
- sharex,sharey: Share or not x,y scale
- figsize Parameter can specify the size of the entire canvas
When we call plot when , If you set plt.figure(), Will be called automatically figure() Generate a figure, Strictly speaking , Is to generate subplots(111)
First create a chart figure, Then generate subgraphs ,(2,2,1) For creating 2*2 Matrix table of , Then choose the first , The order is from left to right, from top to bottom
Calling subplot Generally, you need to pass in three digits , Respectively represent the total number of head offices , The total number of columns , Of the current subgraph index
2*2 Four subgraphs index:1 The first sub graph is selected
ax1 = plt.subplot(221)
ax2 = plt.subplot(222)
ax3 = plt.subplot(223)
ax4 = plt.subplot(224) When all three digits are less than 10 when , You can omit the comma in the middle , This command is equivalent to plt.subplot(2,2,4)
beyond , May be an error
plt.subplot(225)
Two ways of implementation
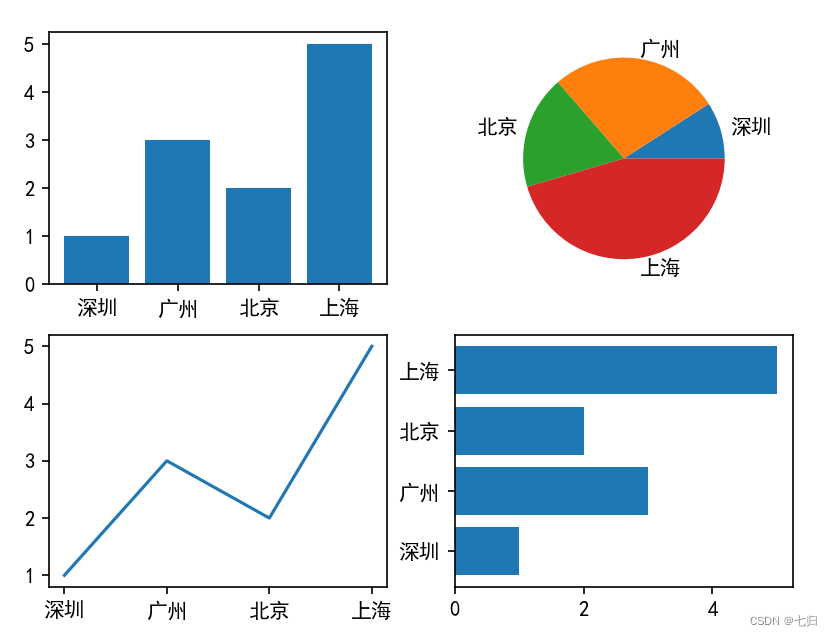
OO style
import matplotlib.pyplot as plt

x = [" Shenzhen ", " Guangzhou ", " Beijing ", " Shanghai "]
y = [1, 3, 2, 5]
fig, axs = plt.subplots(2, 2)

#  Subscript [nrows][ncols]
#  First subgraph
axs[0][0].bar(x, y)
#  Second subgraph
axs[0][1].pie(y, labels=x)
#  The third subgraph
axs[1][0].plot(x, y)
#  The fourth subgraph
axs[1][1].barh(x, y)
plt.show()
- Output image :
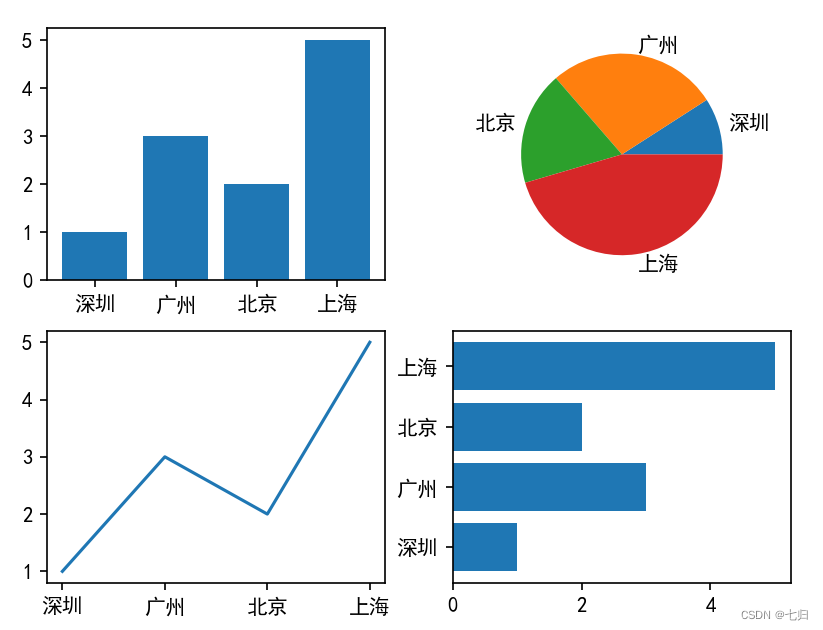
plplot style
import matplotlib.pyplot as plt

plt.rcParams['font.sans-serif'] = 'Microsoft YaHei'
x = [" Shenzhen ", " Guangzhou ", " Beijing ", " Shanghai "]
y = [1, 3, 2, 5]

#  First subgraph
plt.subplot(2, 2, 1)
plt.bar(x, y)
#  Second subgraph
plt.subplot(2, 2, 2)
plt.pie(y, labels=x)
#  The third subgraph
plt.subplot(2, 2, 3)
plt.plot(x, y)
#  The fourth subgraph
plt.subplot(2, 2, 4)
plt.barh(x, y)
plt.show()
- Output image :
All in one display ——plt.subplot
Graph in uniform graph
- Use plt.figure Create an image window . Use plt.subplot To create a thumbnail
- plt.subplot(2,2,1) Indicates that the entire image window is divided into 2 That's ok 2 Column , The current position is 1. Use plt.plot([0,1],[0,1]) In the 1 Create a small diagram at one location .
- plt.subplot(2,2,2) Indicates that the entire image window is divided into 2 That's ok 2 Column , The current position is 2. Use plt.plot([0,1],[0,2]) In the 2 Create a small diagram at one location .
- plt.subplot(2,2,3) Indicates that the entire image window is divided into 2 That's ok 2 Column , The current position is 3. plt.subplot(2,2,3) It can be abbreviated as plt.subplot(223). Use plt.plot([0,1],[0,3]) In the 3 Create a small diagram at one location .
- plt.subplot(224) Indicates that the entire image window is divided into 2 That's ok 2 Column , The current position is 4. Use plt.plot([0,1],[0,4]) In the 4 Create a small diagram at one location .
plt.figure()

plt.subplot(2,2,1)
plt.plot([0,1],[0,1])

plt.subplot(2,2,2)
plt.plot([0,1],[0,2])

plt.subplot(223)
plt.plot([0,1],[0,3])

plt.subplot(224)
plt.plot([0,1],[0,4])
Uneven graph in graph
- Use plt.subplot(2,1,1) Divide the entire image window into 2 That's ok 1 Column , The current position is 1. Use plt.plot([0,1],[0,1]) In the 1 Create a small diagram at one location .
- Use plt.subplot(2,3,4) Divide the entire image window into 2 That's ok 3 Column , The current position is 4. Use plt.plot([0,1],[0,2]) In the 4 Create a small diagram at one location .
- Used in the previous step plt.subplot(2,1,1) Divide the entire image window into 2 That's ok 1 Column , The first 1 A small picture occupies the 1 A place , That is, the whole second 1 That's ok .
- In this step plt.subplot(2,3,4) Divide the entire image window into 2 That's ok 3 Column , So the first... Of the entire image window 1 OK, it becomes 3 Column , That is to say 3 A place , To be the first 2 OK, No 1 The first position is the... Of the entire image window 4 A place .
plt.subplot(2,1,1)
plt.plot([0,1],[0,1])

plt.subplot(2,3,4)
plt.plot([0,1],[0,2])
- And so on , Create the first 5、6 Subgraph on position
plt.subplot(235)
plt.plot([0,1],[0,3])

plt.subplot(236)
plt.plot([0,1],[0,4])
Uneven subgraph ——add_gridspec
Area cutting
- Use GridSpec Draw a non-uniform subgraph
- utilize add_gridspec You can specify the relative width scale width_ratios And relative height scale parameters height_ratios
spec = fig.add_gridspec(nrows=2, ncols=2, width_ratios=[1,3],height_ratios=[1,2])
It means cutting the whole canvas to 2 That's ok 2 Column area ,width_ratios=[1, 3] It means that the width of the two columns is divided into 1:3 Tailoring , Empathy height_ratios=[1,2] Indicates that the vertical direction is in accordance with 1:2 Tailoring
x = [" Shenzhen ", " Guangzhou ", " Beijing ", " Shanghai "]
y = [1, 3, 2, 5]
fig = plt.figure(figsize=(10, 8))

spec = fig.add_gridspec(nrows=2, ncols=2, width_ratios=[1, 3], height_ratios=[1, 2])
ax = fig.add_subplot(spec[0, 0])
ax.bar(x, y)

ax = fig.add_subplot(spec[0, 1])
ax.plot(x, y)

ax = fig.add_subplot(spec[1, 0])
ax.pie(y, labels=x)

ax = fig.add_subplot(spec[1, 1])
ax.barh(x, y)
plt.show()
- Output image :

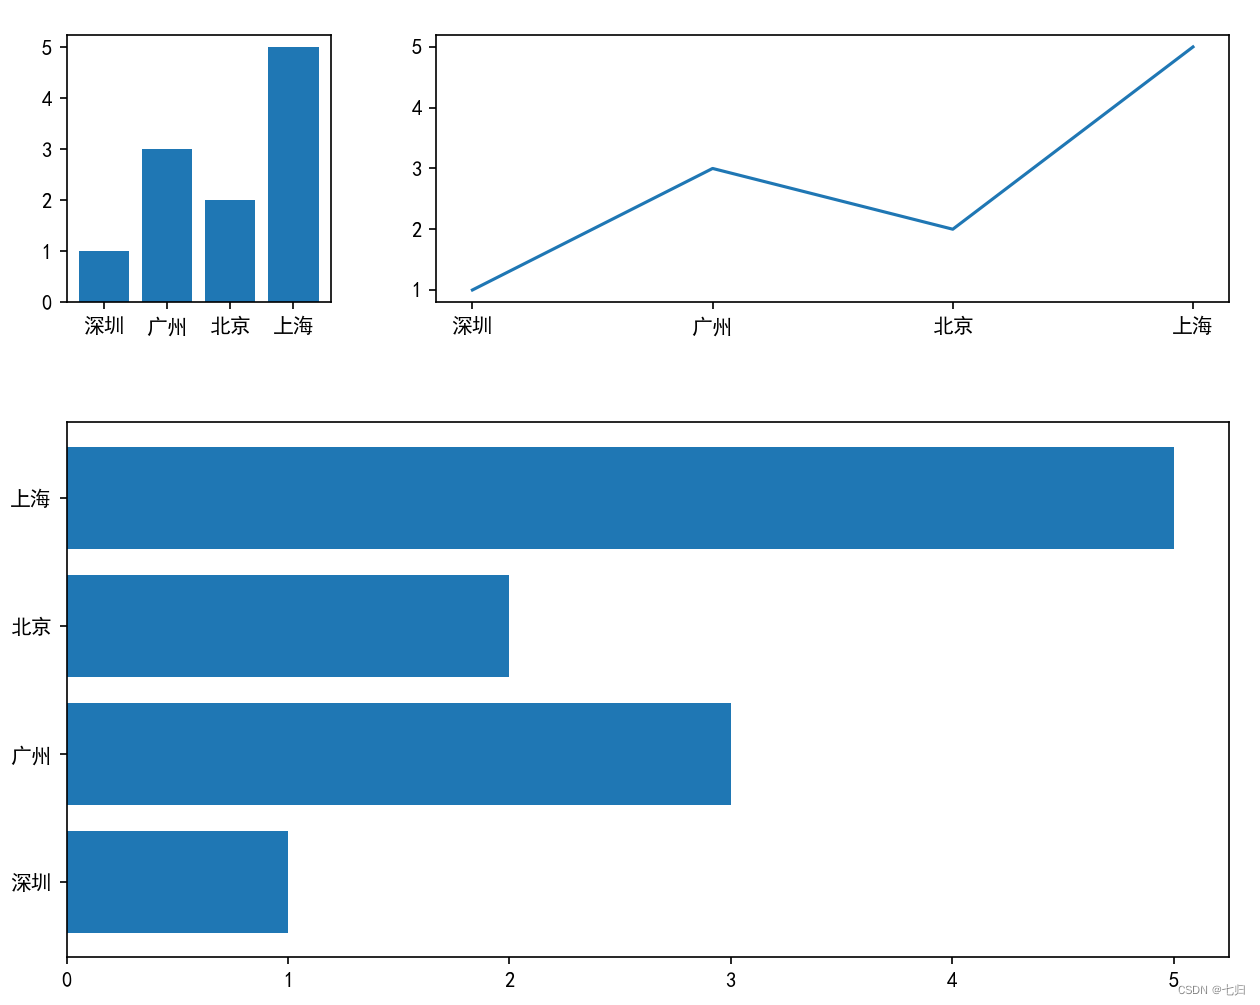
- spec It also supports slicing , For example, we will show the second line as the whole bar graph
x = [" Shenzhen ", " Guangzhou ", " Beijing ", " Shanghai "]
y = [1, 3, 2, 5]
fig = plt.figure(figsize=(10, 8))

spec = fig.add_gridspec(nrows=2, ncols=2, width_ratios=[1, 3], height_ratios=[1, 2])
ax = fig.add_subplot(spec[0, 0])
ax.bar(x, y)

ax = fig.add_subplot(spec[0, 1])
ax.plot(x, y)

#  The second line shows a bar chart in the whole area
ax = fig.add_subplot(spec[1, :])
ax.barh(x, y)

#  Adjust the distance between areas
plt.subplots_adjust(hspace=0.3, wspace=0.2)
plt.show()
- Output image :
Additive elements
- ax Subgraphs can also be passed set_title、set_xlable And so on , Axis title, etc
- If you need to add a headline, you can use fig.suptitle() To complete .
边栏推荐
- [staff] time mark and note duration (staff time mark | full note rest | half note rest | quarter note rest | eighth note rest | sixteenth note rest | thirty second note rest)
- Solution and analysis of Hanoi Tower problem
- 微服务实战|负载均衡组件及源码分析
- 西瓜书--第六章.支持向量机(SVM)
- Watermelon book -- Chapter 5 neural network
- Watermelon book -- Chapter 6 Support vector machine (SVM)
- Introduction to the basic concept of queue and typical application examples
- Minecraft plug-in service opening
- Micro service practice | introduction and practice of zuul, a micro service gateway
- Redis安装部署(Windows/Linux)
猜你喜欢
小米电视不能访问电脑共享文件的解决方案
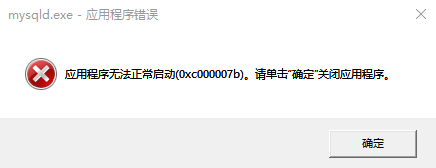
Mysql安装时mysqld.exe报`应用程序无法正常启动(0xc000007b)`
![[staff] the lines and spaces of the staff (the nth line and the nth space in the staff | the plus N line and the plus N space on the staff | the plus N line and the plus N space below the staff | the](/img/dc/c0ea188ef353ded86759dbe9b29df3.jpg)
[staff] the lines and spaces of the staff (the nth line and the nth space in the staff | the plus N line and the plus N space on the staff | the plus N line and the plus N space below the staff | the
![[go practical basis] how to customize and use a middleware in gin](/img/fb/c0a4453b5d3fda845c207c0cb928ae.png)
[go practical basis] how to customize and use a middleware in gin
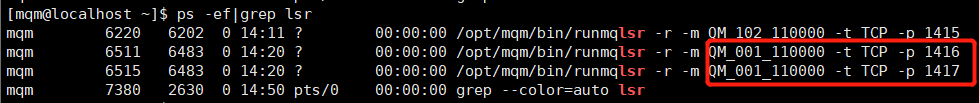
队列管理器running状态下无法查看通道

十年開發經驗的程序員告訴你,你還缺少哪些核心競爭力?

Avoid breaking changes caused by modifying constructor input parameters
"Redis source code series" learning and thinking about source code reading
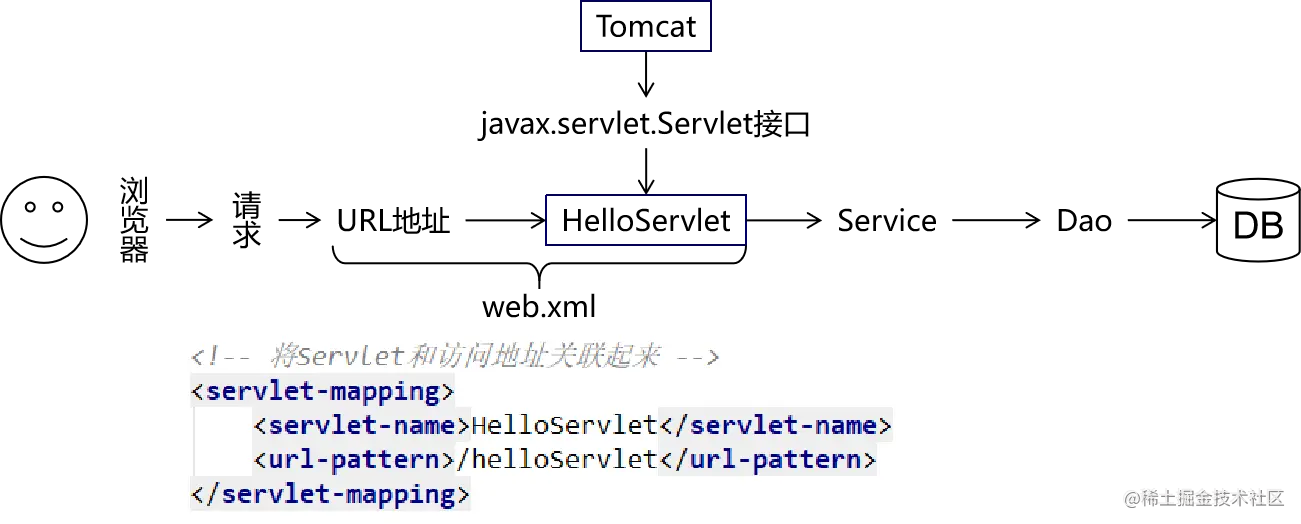
Servlet全解:继承关系、生命周期、容器和请求转发与重定向等

From concept to method, the statistical learning method -- Chapter 3, k-nearest neighbor method
随机推荐
AMQ 4043 solution for errors when using IBM MQ remote connection
【Go实战基础】gin 如何绑定与使用 url 参数
队列的基本概念介绍以及典型应用示例
C# 调用系统声音 嘀~
Redis安装部署(Windows/Linux)
2022/2/13 summary
深入剖析JVM是如何执行Hello World的
聊聊消息队列高性能的秘密——零拷贝技术
知识点很细(代码有注释)数构(C语言)——第三章、栈和队列
Taking the upgrade of ByteDance internal data catalog architecture as an example, talk about the performance optimization of business system
C# 百度地图,高德地图,Google地图(GPS) 经纬度转换
京东高级工程师开发十年,编写出:“亿级流量网站架构核心技术”
Servlet全解:继承关系、生命周期、容器和请求转发与重定向等
以字节跳动内部 Data Catalog 架构升级为例聊业务系统的性能优化
C# 将网页保存为图片(利用WebBrowser)
ORA-12514问题解决方法
机器学习之数据类型案例——基于朴素贝叶斯法,用数据辩男女
Mysql安装时mysqld.exe报`应用程序无法正常启动(0xc000007b)`
Gocv image reading and display
Avoid breaking changes caused by modifying constructor input parameters