当前位置:网站首页>This map drawing tool is amazing, I recommend it~~
This map drawing tool is amazing, I recommend it~~
2022-08-01 02:35:00 【The Way of Python Data】
来源:DataCharm
Previously, the editor introduced a number of articles about the drawing of spatial visualization charts in the public account,Liked by many students,But there are also many students who say noPython的版本,Today, the editor recommends an awesome academic research map visualization tool-Python-pygmt库,顾名思义,pygmtIt is based on the powerful drawing functionGMT软件,且使用pygmt前必须安装GMT(Generic Mapping Tools)软件.GMT具体安装步骤可参考:GMT中文手册[1].需要注意的是,现阶段pygmt还不能完全支持GMTAll chart types that can be drawn,Subsequent updates will continue to improve.This tweet is mostly rightPython-pygmt的一个介绍,主要内容如下:
Python-pygmt安装
Python-pygmt 示例绘制
Python-pygmt安装
The reason why it is specially introduced herepygmt库安装,Because the library is best to useAnaconda进行安装,And need to be done separatelypygmt运行环境的搭建.pygmtThe recommended installation script statement on the official website is as follows(默认GMT已安装):
conda create --name pygmt --channel conda-forge pygmtActivate the one you just built using the following statementpygmt虚拟环境:
conda activate pygmt「注意」:Here I recommend using itPythonWhen doing space charting,It is best to build the virtual environment separately,Avoid dependency library version conflicts.
Python-pygmt 示例绘制
This part of the editor mainly introducespygmtThe main types of charts that can be drawn at this stage,主要内容如下:
Shorelines(海岸线)
fig = pygmt.Figure()
fig.basemap(region="g", projection="W15c", frame=True)
fig.coast(shorelines=True)
fig.show()
data points(气泡图)
fig = pygmt.Figure()
fig.basemap(region=region, projection="M15c", frame=True)
fig.coast(land="black", water="skyblue")
pygmt.makecpt(cmap="viridis", series=[data.depth_km.min(), data.depth_km.max()])
fig.plot(
    x=data.longitude,
    y=data.latitude,
    size=0.02 * 2**data.magnitude,
    color=data.depth_km,
    cmap=True,
    style="cc",
    pen="black",
)
fig.colorbar(frame='af+l"Depth (km)"')
fig.show()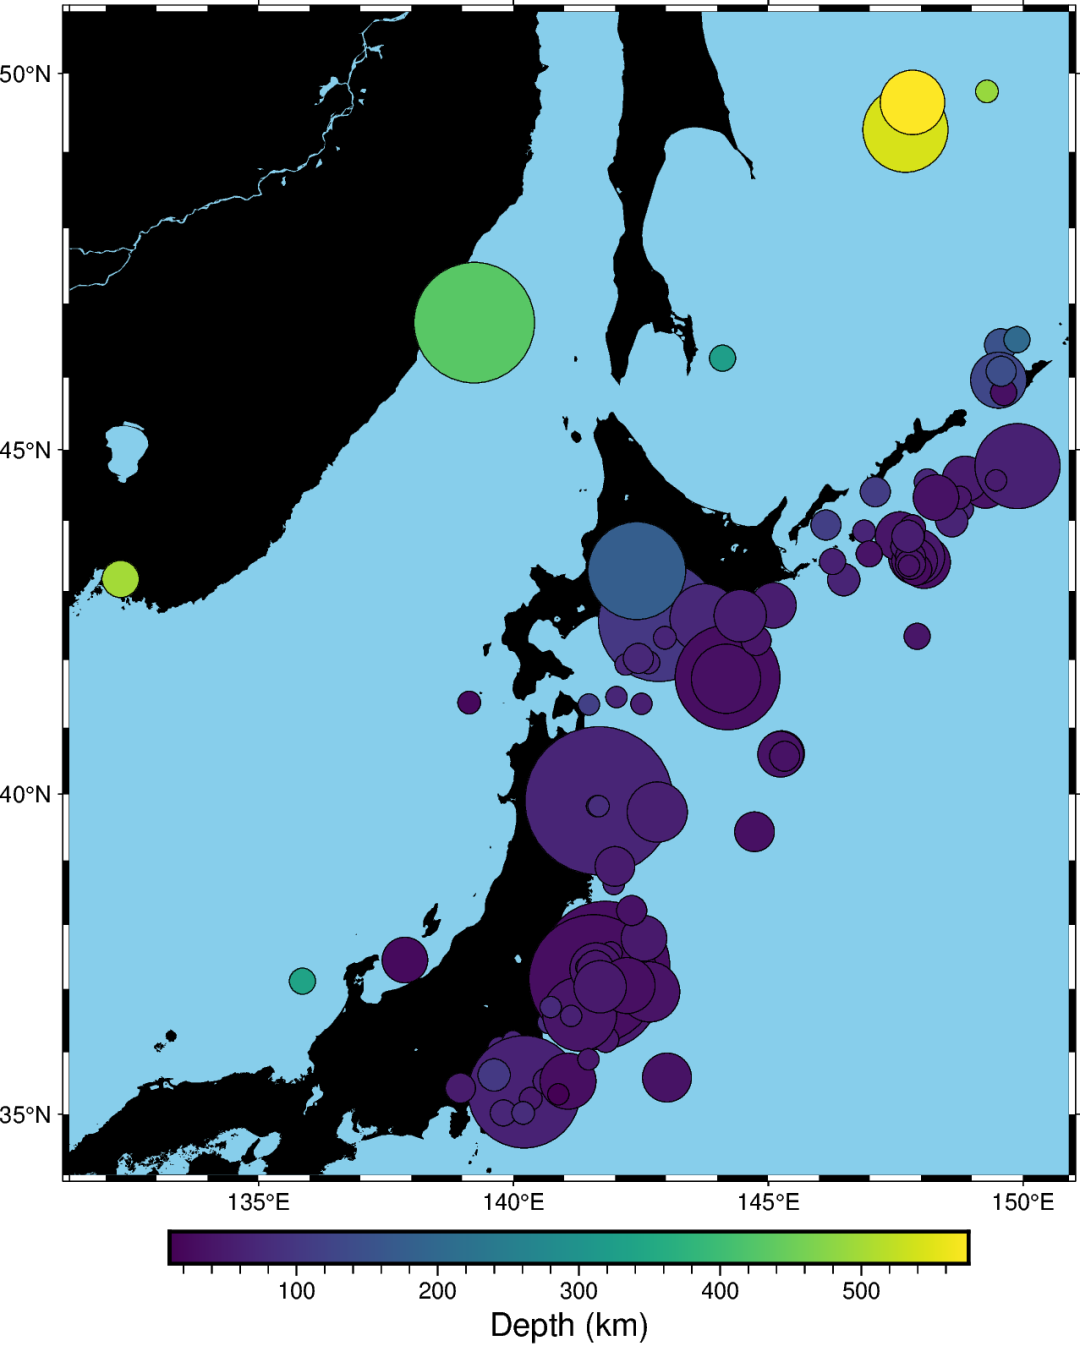
map with contour lines
fig = pygmt.Figure()
fig.grdimage(
    grid=grid,
    cmap="haxby",
    projection="M10c",
    frame=True,
)
fig.grdcontour(
    annotation=1000,
    interval=250,
    grid=grid,
    limit=[-4000, -2000],
)
fig.show()
Roads
import geopandas as gpd
import pygmt

# Read shapefile data using geopandas
gdf = gpd.read_file(
    "http://www2.census.gov/geo/tiger/TIGER2015/PRISECROADS/tl_2015_15_prisecroads.zip"
)
# The dataset contains different road types listed in the RTTYP column,
# here we select the following ones to plot:
roads_common = gdf[gdf.RTTYP == "M"]  # Common name roads
roads_state = gdf[gdf.RTTYP == "S"]  # State recognized roads
roads_interstate = gdf[gdf.RTTYP == "I"]  # Interstate roads

fig = pygmt.Figure()

# Define target region around O'ahu (Hawai'i)
region = [-158.3, -157.6, 21.2, 21.75]  # xmin, xmax, ymin, ymax

title = r"Main roads of O\047ahu (Hawai\047i)"  # \047 is octal code for '
fig.basemap(region=region, projection="M12c", frame=["af", f'WSne+t"{title}"'])
fig.coast(land="gray", water="dodgerblue4", shorelines="1p,black")

# Plot the individual road types with different pen settings and assign labels
# which are displayed in the legend
fig.plot(data=roads_common, pen="5p,dodgerblue", label="CommonName")
fig.plot(data=roads_state, pen="2p,gold", label="StateRecognized")
fig.plot(data=roads_interstate, pen="2p,red", label="Interstate")

# Add legend
fig.legend()

fig.show()
Blockmean
import pygmt

# Load sample data
data = pygmt.datasets.load_sample_data(name="japan_quakes")
# Select only needed columns
data = data[["longitude", "latitude", "depth_km"]]

# Set the region for the plot
region = [130, 152.5, 32.5, 52.5]
# Define spacing in x and y direction (150 by 150 minute blocks)
spacing = "150m"

fig = pygmt.Figure()

# Calculate mean depth in km from all events within 150x150 minute
# bins using blockmean
df = pygmt.blockmean(data=data, region=region, spacing=spacing)
# convert to grid
grd = pygmt.xyz2grd(data=df, region=region, spacing=spacing)

fig.grdimage(
    grid=grd,
    region=region,
    frame=["af", '+t"Mean earthquake depth inside each block"'],
    cmap="batlow",
)
# plot slightly transparent landmasses on top
fig.coast(land="darkgray", transparency=40)
# plot original data points
fig.plot(
    x=data.longitude, y=data.latitude, style="c0.3c", color="white", pen="1p,black"
)
fig.colorbar(frame=["x+lkm"])

fig.shift_origin(xshift="w+5c")

# Calculate number of total locations within 150x150 minute bins via
# blockmean's summary parameter
df = pygmt.blockmean(data=data, region=region, spacing=spacing, summary="n")
grd = pygmt.xyz2grd(data=df, region=region, spacing=spacing)

fig.grdimage(
    grid=grd,
    region=region,
    frame=["af", '+t"Number of points inside each block"'],
    cmap="batlow",
)
fig.coast(land="darkgray", transparency=40)
fig.plot(
    x=data.longitude, y=data.latitude, style="c0.3c", color="white", pen="1p,black"
)
fig.colorbar(frame=["x+lcount"])

fig.show()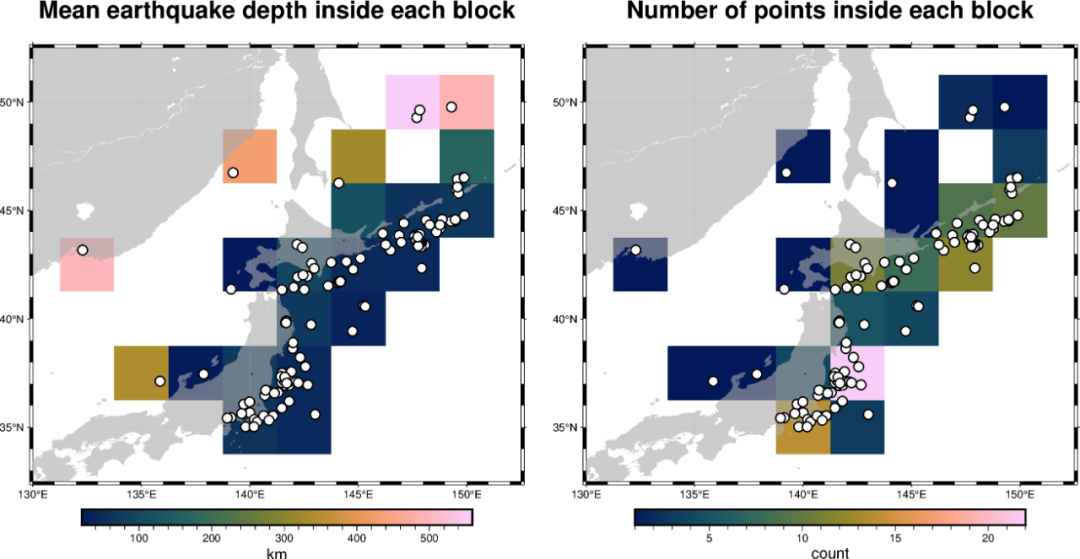
The above is a brief introduction to thePython-pygmtThe library is commonly used in scientific research mapping types,More other chart types,大家可参考:Python-pygmt官网例子[2]
总结
Today's tweet,小编介绍了PythonA powerful mapping tool in the language-pygmt,The library is powerful based on drawingGMT工具,与之相比,Drawing scripts are simpler and easier to understand,Interested friends can study hard,The editor will also include the library drawing with a map type~~
参考资料
[1]
GMT中文手册: https://docs.gmt-china.org/latest/.
[2]Python-pygmt官网例子: https://www.pygmt.org/latest/gallery/index.html.
-------- End --------

精选内容


边栏推荐
- STK8321 I2C (Shengjia-accelerometer) example
- [Data analysis] Based on matlab GUI student achievement management system [including Matlab source code 1981]
- IDEA debugging
- how to edit the table of contents of an epub ebook
- The fledgling Xiao Li's 114th blog project notes: Wisdom cloud intelligent flower watering device combat (3) - basic Demo implementation
- Talking about hardware device computing storage and data interaction
- Summary of MVCC
- 【分层强化学习】HIRO:Data-Efficient Hierarchical Reinforcement Learning
- Nmap 操作手册 - 完整版
- YOLO怎么入门?怎么实现自己的训练集?
猜你喜欢

ARM cross compilation

MYSQL logical architecture

leetcode:1562. 查找大小为 M 的最新分组【模拟 + 端点记录 + 范围合并】

IDEA调试
![[Data analysis] Based on matlab GUI student achievement management system [including Matlab source code 1981]](/img/65/b84443b98c28d2728e9ae44b1294fb.jpg)
[Data analysis] Based on matlab GUI student achievement management system [including Matlab source code 1981]

Google engineer fired for claiming AI awareness: breach of nondisclosure agreement

【 】 today in history: on July 31, "brains in vats" the birth of the participant;The father of wi-fi was born;USB 3.1 standard
![ROS2 series of knowledge (4): understand the concept of [service]](/img/14/8de92a89d9c4b6476ac37408bc7788.png)
ROS2 series of knowledge (4): understand the concept of [service]
MYSQL query interception optimization analysis
Game Security 03: A Simple Explanation of Buffer Overflow Attacks
随机推荐
带你体验一次类型编程实践
Item 36: Specify std::launch::async if asynchronicity is essential.
Which interpolation is better for opencv to zoom in and out??
机器学习初学者可以学哪些实战项目?
HCIP (14)
MYSQL master-slave replication
Four ways the Metaverse is changing the way humans work
Ordinary users cannot access HGFS directory
July Bootcamp (Day 31) - Status Compression
【入门教程】Rollup模块打包器整合
HIRO: Hierarchical Reinforcement Learning 】 【 Data - Efficient Hierarchical Reinforcement Learning
The fledgling Xiao Li's 112th blog project notes: Wisdom cloud intelligent flower watering device actual combat (1) - basic Demo implementation
New York University et al | TM-Vec: Template Modeling Vectors for Rapid Homology Detection and Alignment
《少年派2》:新男友竟脚踩两只船,林妙妙与钱三一感情回温
ARM cross compilation
Chain programming, packages, access
how to edit the table of contents of an epub ebook
软考高级系统架构设计师系列之:系统开发基础知识
树莓派 的 arm 版的 gcc 安装 和环境变量的配置
纽约大学等 | TM-Vec:用于快速同源检测和比对的模版建模向量