当前位置:网站首页>The use of subplot function in MATLAB
The use of subplot function in MATLAB
2022-07-01 19:26:00 【jk_ one hundred and one】
Catalog
Replace the subgraph with empty coordinate area
Customize the subgraph on the location
Create a subgraph containing polar regions
Modify the coordinate area attribute after creation
Make the subgraph the current coordinate area
Convert existing coordinate areas into subgraphs
Convert coordinate areas in different drawing windows into subgraphs
subplot The function is to create a coordinate area at each block position .
grammar
subplot(m,n,p)
subplot(m,n,p,'replace')
subplot(m,n,p,'align')
subplot(m,n,p,ax)
subplot('Position',pos)
subplot(___,Name,Value)
ax = subplot(___)
subplot(ax)
explain
subplot(m,n,p) Divide the current window into m×n grid , And in p Create a coordinate area at the specified location .MATLAB Number subgraphs by line number . The first subgraph is the first column of the first row , The second subgraph is the second column of the first row , And so on . If a coordinate zone already exists at the specified location , This command will set the coordinate area as the current coordinate area .
subplot(m,n,p,'replace') Delete location p And create a new coordinate area .
subplot(m,n,p,'align') Create a new coordinate area , To align the borders . This option is the default behavior .
subplot(m,n,p,ax) Set the existing coordinate area ax Convert to sub graph in the same graph window .
subplot('Position',pos) stay pos Create a coordinate area at the specified custom location . Use this option to locate subgraphs that are not aligned with the grid position . Appoint pos As [left bottom width height] Four element vector of form . If the new coordinate area overlaps with the existing coordinate area , The new coordinate area will replace the existing coordinate area .
subplot(___,Name,Value) Use one or more names - Value pair group parameter modify coordinate area attribute . Set the coordinate area properties after all other input parameters .
ax = subplot(___) Create a Axes object 、PolarAxes Object or GeographicAxes object . Can be used later ax Modify the coordinate area .
subplot(ax) take ax The specified coordinate area is set as the current coordinate area of the parent drawing window . If the parent window is not the current window , This option does not make the parent window the current window .
Example
Upper and lower subgraphs
Create a chart window with two stacked subgraphs . Draw a sine wave on each subgraph .
subplot(2,1,1);
x = linspace(0,10);
y1 = sin(x);
plot(x,y1)

subplot(2,1,2);
y2 = sin(5*x);
plot(x,y2)
As shown in the figure :

Quadrant of subgraph
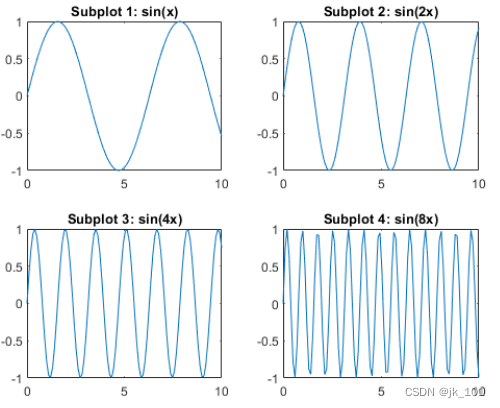
Create a diagram window divided into four subgraphs . Draw a sine wave on each subgraph and assign a title to each subgraph .
subplot(2,2,1)
x = linspace(0,10);
y1 = sin(x);
plot(x,y1)
title('Subplot 1: sin(x)')

subplot(2,2,2)
y2 = sin(2*x);
plot(x,y2)
title('Subplot 2: sin(2x)')

subplot(2,2,3)
y3 = sin(4*x);
plot(x,y3)
title('Subplot 3: sin(4x)')

subplot(2,2,4)
y4 = sin(8*x);
plot(x,y4)
title('Subplot 4: sin(8x)')
As shown in the figure :
Subgraphs of different sizes
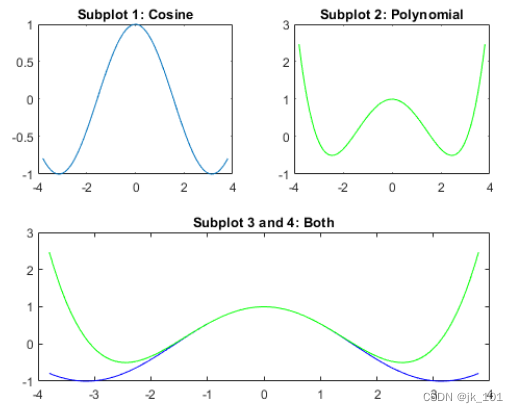
Create a diagram window with three subgraphs . Create two subgraphs in the upper part of the diagram window , And create a third sub graph in the lower part of the graph window . Add a title to each subgraph .
subplot(2,2,1);
x = linspace(-3.8,3.8);
y_cos = cos(x);
plot(x,y_cos);
title('Subplot 1: Cosine')

subplot(2,2,2);
y_poly = 1 - x.^2./2 + x.^4./24;
plot(x,y_poly,'g');
title('Subplot 2: Polynomial')

subplot(2,2,[3,4]);
plot(x,y_cos,'b',x,y_poly,'g');
title('Subplot 3 and 4: Both')
As shown in the figure :
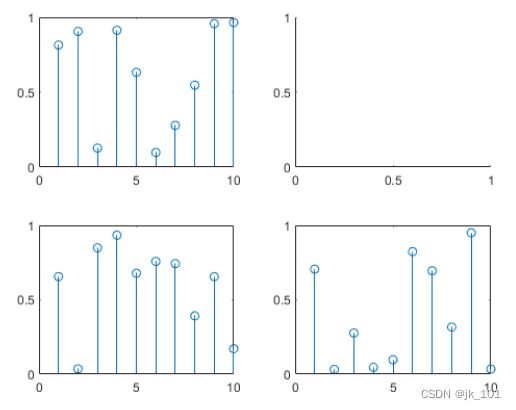
Replace the subgraph with empty coordinate area
Create a chart window containing four needle graphs of random data . Then replace the second sub graph with empty coordinate area .
for k = 1:4
    data = rand(1,10);
    subplot(2,2,k)
    stem(data)
end
As shown in the figure :

subplot(2,2,2,'replace')As shown in the figure :
Customize the subgraph on the location
Create a window containing two subgraphs that are not aligned with the grid position . Specify a custom location for each subgraph .
pos1 = [0.1 0.3 0.3 0.3];
subplot('Position',pos1)
y = magic(4);
plot(y)
title('First Subplot')

pos2 = [0.5 0.15 0.4 0.7];
subplot('Position',pos2)
bar(y)
title('Second Subplot')
As shown in the figure :

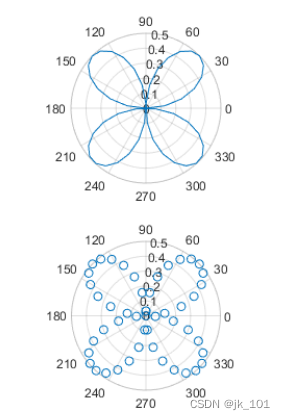
Create a subgraph containing polar regions
Create a drawing window with two polar regions . Create a polar chart in the upper subgraph , Create a polar scatter chart in the lower subgraph .
figure
ax1 = subplot(2,1,1,polaraxes);
theta = linspace(0,2*pi,50);
rho = sin(theta).*cos(theta);
polarplot(ax1,theta,rho)

ax2 = subplot(2,1,2,polaraxes);
polarscatter(ax2,theta,rho)
As shown in the figure :
Modify the coordinate area attribute after creation
Create a diagram window with two subgraphs . take Axes Object to a variable ax1 and ax2. take Axes Object is specified as the input of the drawing function , To ensure that the drawing function is drawn in a specific subgraph .
ax1 = subplot(2,1,1);
Z = peaks;
plot(ax1,Z(1:20,:))

ax2 = subplot(2,1,2);
plot(ax2,Z)
As shown in the figure :

By setting Axes Object to modify the coordinate area . Change the font size of the upper sub graph and the line width of the lower sub graph . Some drawing functions can set coordinate area properties . First execute the drawing function , Then specify the coordinate area attribute to avoid overwriting the setting of the existing coordinate area attribute . Use dot notation to set properties .
Make the subgraph the current coordinate area
Create a diagram window with multiple subgraphs . take Axes Objects are stored in vectors ax in . Then make the second sub graph the current coordinate area . Create a line graph and change the axis range of the second sub graph . By default , The graph function acts on the current coordinate area .
for k = 1:4
    ax(k) = subplot(2,2,k);
end

subplot(ax(2))
x = linspace(1,50);
y = sin(x);
plot(x,y,'Color',[0.1, 0.5, 0.1])
title('Second Subplot')
axis([0 50 -1 1])
As shown in the figure :

Convert existing coordinate areas into subgraphs
Create a line diagram . Then transform the coordinate area , Make it the lower sub graph of the graph window .subplot The function uses the window where the original coordinate area is located .
x = linspace(1,10);
y = sin(x);
plot(x,y)
title('Sine Plot')
As shown in the figure :

ax = gca;
subplot(2,1,2,ax)
As shown in the figure :

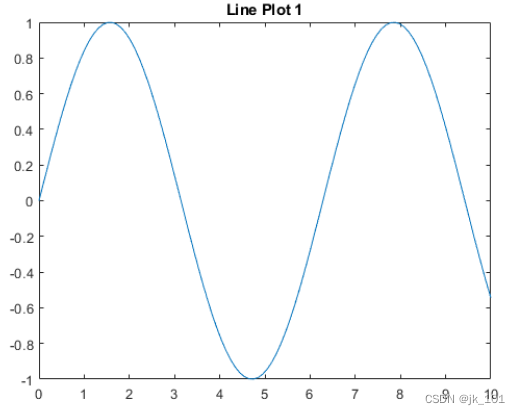
Convert coordinate areas in different drawing windows into subgraphs
Merge coordinate areas located in different windows into a single window containing subgraphs .
Create two diagrams in two different diagram windows . take Axes Object to a variable ax1 and ax2. take Legend Object to a variable lgd.
figure
x = linspace(0,10);
y1 = sin(x);
plot(x,y1)
title('Line Plot 1')
As shown in the figure :
ax1 = gca;

figure
y2 = 2*sin(x);
plot(x,y2)
title('Line Plot 2')
lgd = legend('2*Sin(x)');
As shown in the figure :

ax2 = gca;Use copyobj Create two Axes Copy of object . Specify the parent of the copied coordinate area as the new drawing window . Because the legend and color bar will not be copied with the relevant coordinate area , So please copy the legend with the coordinate area .
fnew = figure;
ax1_copy = copyobj(ax1,fnew);
subplot(2,1,1,ax1_copy)

copies = copyobj([ax2,lgd],fnew);
ax2_copy = copies(1);
subplot(2,1,2,ax2_copy)
As shown in the figure :

Input parameter description
m - Grid rows
Grid rows , Specify as a positive integer .
n - Number of grid columns
Number of grid columns , Specify as a positive integer .
p - Grid location of the new coordinate area
Grid location of the new coordinate area , Specify as scalar or positive integer vector .
If p Is a positive integer scalar , be subplot In grid position p Create a sub graph at .
If p Is a positive integer vector , be subplot Create a new span p Subgraphs of grid locations listed in .
Example :subplot(2,3,1) In position 1 Create a sub graph at .
Example : subplot(2,3,[2,5]) Create cross location 2 and 5 The children of .
Example : subplot(2,3,[2,6]) Create cross location 2、3、5 and 6 The children of .
pos - Custom location of the new coordinate area
Custom location of the new coordinate area , Designated as [left bottom width height] Four element vector of form .
left and bottom Element specifies the position of the lower left corner of the subgraph relative to the lower left corner of the graph window .
width and height Element specifies the dimension of the subgraph .
Specify between 0 and 1 Normalized value between ( Based on the inner bound of graph window ).
Be careful : When using scripts to create subgraphs , In a drawnow Order or MATLAB Return to waiting for user command ,MATLAB Will not be finalized Position Property value . Before the script refreshes the drawing or exits , Of subgraphs Position Attribute values will be affected by changes .
ax - To set as the current coordinate area or convert to the existing coordinate area of the subgraph
To set as the current coordinate area or convert to the existing coordinate area of the subgraph , Designated as Axes object 、PolarAxes object 、GeographicAxes Object or has PositionConstraint Attribute graphic object , Such as HeatmapChart object .
To create an empty polar or geographic coordinate area at the location of the sub map , Please put ax Designated as polaraxes or geoaxes function . for example ,subplot(2,1,2,polaraxes).
Tips
To clear the contents of the picture window , Please use clf. for example , You can clear the existing sub drawing layout in the drawing window before creating a new sub drawing layout .
To superimpose coordinate areas , Please switch to axes command .subplot The function deletes the existing coordinate area that overlaps the new coordinate area . for example ,subplot('Position',[.35 .35 .3 .3]) All the bottom coordinate areas will be deleted , but axes('Position',[.35 .35 .3 .3]) The new coordinate area will be placed in the middle of the drawing window without deleting the bottom coordinate area .
subplot(111) It's an exception , Its behavior is related to subplot(1,1,1) Different . For backward compatibility reasons ,subplot(111) Is a special case of subgraphs , It does not immediately create coordinate areas , Instead, set the picture window , So that the following graphic commands can be executed clf reset. The next graphic command will delete all the window children , And create a new coordinate area in the default location .subplot(111) No return Axes object , If the code specifies the return parameter , An error will occur .
Alternative functions
Use tiledlayout and nexttile Function to create a configurable drawing tile . Configuration options include :
Control of spacing between drawings and around layout edges
Options for sharing titles at the top of the layout
share x Axis and y Options for axis labels
It is used to control whether the partition is fixed size or adjustable variable size
边栏推荐
- ECS summer money saving secret, this time @ old users come and take it away
- Lake Shore 连续流动低温恒温器传输线
- 云服务器ECS夏日省钱秘籍,这次@老用户快来领走
- pickle.load报错【AttributeError: Can‘t get attribute ‘Vocabulary‘ on <module ‘__main__‘】
- Graduation season | Huawei experts teach the interview secret: how to get a high paying offer from a large factory?
- Helium transmission line of lake shore cryostat
- Three ways for redis to realize current limiting
- 实现一个Prometheus exporter
- Reading the paper [learning to discretely compose reasoning module networks for video captioning]
- MFC中如何重绘CListCtrl的表头
猜你喜欢
从零开始学 MySQL —数据库和数据表操作
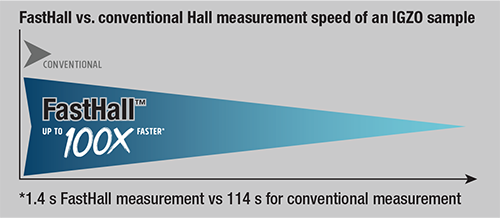
M91快速霍尔测量仪—在更短的时间内进行更好的测量

Lumiprobe cell imaging study PKH26 cell membrane labeling kit
![[pytorch record] automatic hybrid accuracy training torch cuda. amp](/img/a5/cf1eb2801380cf2887dfd532d3eb1e.jpg)
[pytorch record] automatic hybrid accuracy training torch cuda. amp
Today, with the popularity of micro services, how does service mesh exist?

Getting started with kubernetes command (namespaces, pods)
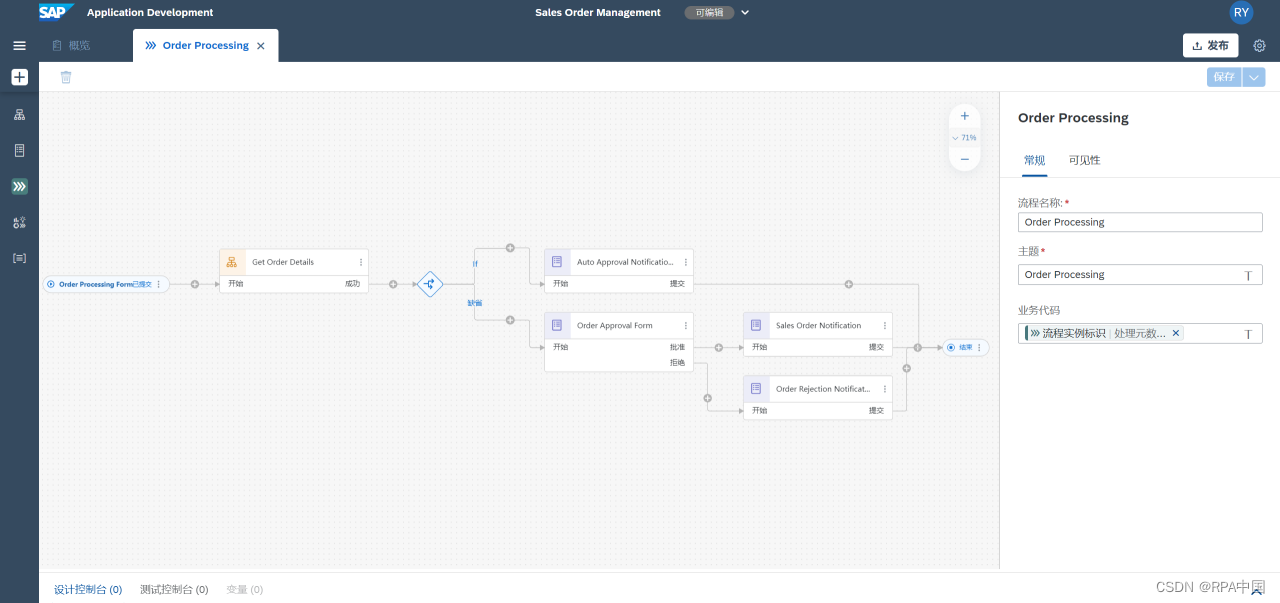
Enabling "new Chinese enterprises", SAP process automation landing in China
![Reading the paper [learning to discretely compose reasoning module networks for video captioning]](/img/a2/acdaebeb67ec4bcb01c8ff4bbd1d1e.png)
Reading the paper [learning to discretely compose reasoning module networks for video captioning]
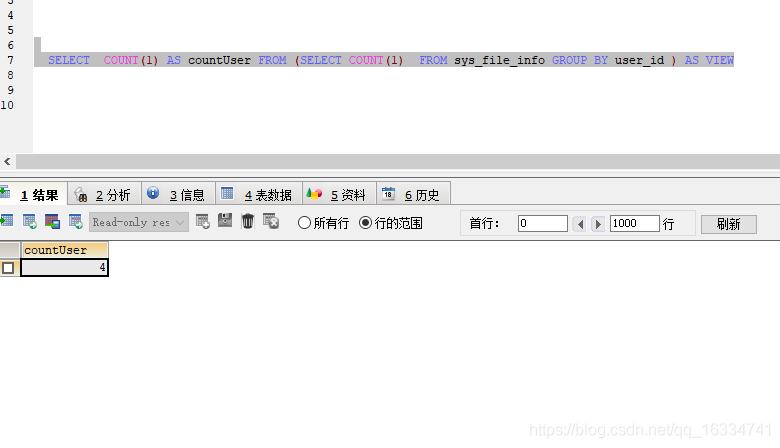
sql查询去重统计的方法总结

混沌工程平台 ChaosBlade-Box 新版重磅发布
随机推荐
Lake Shore低温恒温器的氦气传输线
Love business in Little Red Book
助力数字经济发展,夯实数字人才底座—数字人才大赛在昆成功举办
Today, with the popularity of micro services, how does service mesh exist?
Three ways for redis to realize current limiting
6月刊 | AntDB数据库参与编写《数据库发展研究报告》 亮相信创产业榜单
Viewing technological changes through Huawei Corps (VI): smart highway
数商云:从规划到落地,五矿集团如何快速构建数字化发展新格局?
Solution of digital supply chain centralized purchase platform in mechanical equipment industry: optimize resource allocation and realize cost reduction and efficiency increase
M91 fast hall measuring instrument - better measurement in a shorter time
How to redraw the header of CListCtrl in MFC
Enabling "new Chinese enterprises", SAP process automation landing in China
Specification of lumiprobe reactive dye indocyanine green
More information about M91 fast hall measuring instrument
白盒加密技术浅理解
Go语言高级
奔赴山海之前,毕业季一定要做的那些事情
Superoptimag superconducting magnet system - SOM, Som2 series
3. "Create your own NFT collections and publish a Web3 application to show them" cast NFT locally
Summary of the core steps in the life cycle of beans