当前位置:网站首页>How to draw non overlapping bubble chart in MATLAB
How to draw non overlapping bubble chart in MATLAB
2022-07-03 17:57:00 【Tingwu】
For example, select indicators for the situation of higher education in countries around the world , use topsis I can't deal with it , You can get the education of various countries topsis fraction .
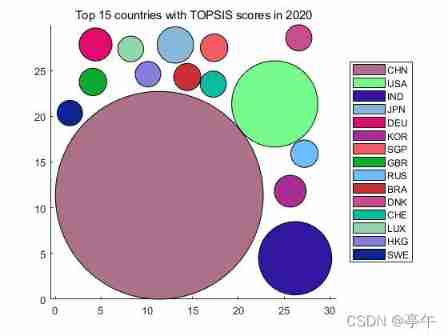
So how to use the graph to intuitively show the data results ? Considering the aesthetics , You can use non overlapping bubble charts , Bubble ( That is round ) Radius and topsis Score correlation , The size of the circle shows the country topsis Score level .
as follows :
matlab Implementation code :
First import the data :
clc,clear
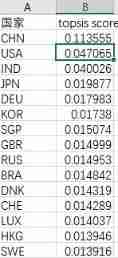
D=xlsread(' ranking .xlsx',1,'B2:B16')';%topsis The top 15 fraction
[~,~,country]=xlsread(' ranking .xlsx',1,'A2:A16'); % The name of the country , For legend
Define bubble radius :
because topsis The scores are all in 0-1 Between , Is too small , So multiply by 100 As the bubble radius of various countries .
N=length(D);   % The number of circles to draw
r=D*100;                            % Generation radius
Define the side length of the picture :
If all circles do not overlap , The maximum length occupied ( That is, the side length of the graph ) Not more than the sum of circle diameters
w=2*sum(r); %** Area side length **Generate the first point , Draw a circle together :
Note that the first circle obviously can't make it run outside the figure , The radius length can be roughly defined as the center coordinate .
use [rand,rand,rand] Random color .
p=r(1)*ones(1,2);             % Generate a random point
A=p';                                     % The coordinates of the first point are recorded into the matrix A in , Transpose operation
t=0:360;
patch(p(1)+r(1)*cosd(t),p(2)+r(1)*sind(t),[rand,rand,rand])
hold on
The idea of generating non overlapping bubbles :
Generate points randomly , For example, start to generate the coordinates of the center of the third circle , Then judge the point and the 1,2 The distance between the coordinates of the center of a circle , Respectively cannot be less than r3+r1 and r3+r2. If it fails to meet the standard, continue to randomly generate points , If it meets the standard, store the coordinates of the point , And draw circles of random colors .
for ii=2:N
    p=r(ii)+(w-2*r(ii)-47).*rand(1,2);   % Generate a new random point ,rand(1,2) It means to produce one row and two columns (0,1) Random number between
    while any((A(1,1:ii-1)-p(1)).^2+(A(2,1:ii-1)-p(2)).^2<=(r(1,1:ii-1)+r(ii)).^2) % Distance judgment does not overlap
          p=r(ii)+(w-2*r(ii)-47).*rand(1,2);
    end
    A = [A,p'];                                            % Save the new point to matrix A
    patch(p(1)+r(ii)*cosd(t),p(2)+r(ii)*sind(t),[rand,rand,rand]);      % Fill a circle
end
Because you want to make the non overlapping bubbles appear more compact in the figure , Constantly adjust parameters when generating coordinates ,-47 It looks better when .
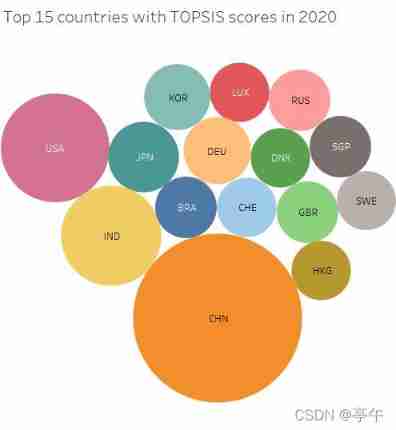
@[email protected] Although it can still meet the current goal , But it's too unwise , There are at least two ways to improve this kind of diagram : Realize that each bubble is next to ; Customize a color matrix for the color of bubbles , If you can , Give Way topsis Score from high to low gradient color , Then the color column is shown on the next figure . If it is realized in the future , Come back and make up , Maybe not (?)
Of course , This picture can be found in tableau In the software :
The complete code is as follows :
clc,clear
D=xlsread(' ranking .xlsx',1,'B2:B16')';%topsis The top 15 fraction
[~,~,country]=xlsread(' ranking .xlsx',1,'A2:A16'); % The name of the country , For legend
N=length(D);   % The number of circles to draw
r=D*100;                            % Generation radius
w=2*sum(r);                              %** Area side length **
p=r(1)*ones(1,2);             % Generate a random point
A=p';                                     % The coordinates of the first point are recorded into the matrix A in , Transpose operation
t=0:360;
patch(p(1)+r(1)*cosd(t),p(2)+r(1)*sind(t),[rand,rand,rand])
%plot([0 w w 0 0],[0 0 w w 0]);     % Draw an area box
hold on
for ii=2:N
    p=r(ii)+(w-2*r(ii)-47).*rand(1,2);   % Generate a new random point ,rand(1,2) It means to produce one row and two columns (0,1) Random number between
    while any((A(1,1:ii-1)-p(1)).^2+(A(2,1:ii-1)-p(2)).^2<=(r(1,1:ii-1)+r(ii)).^2) % Distance judgment does not overlap
          p=r(ii)+(w-2*r(ii)-47).*rand(1,2);
    end
    A = [A,p'];                                            % Save the new point to matrix A
    patch(p(1)+r(ii)*cosd(t),p(2)+r(ii)*sind(t),[rand,rand,rand]);      % Fill a circle
end
legend(country,'Location','EastOutside') % Locate the legend
title('Top 15 countries with TOPSIS scores in 2020')
hold off
axis equal
Reference blog :MATLAB Draw a random circle that does not coincide in the region - Pangolin2 - Blog Garden
边栏推荐
- Five problems of database operation in commodity supermarket system
- (9) Opencv Canny edge detection
- 面试官:值为 nil 为什么不等于 nil ?
- Discussion sur la logique de conception et de mise en oeuvre du processus de paiement
- Micro service component sentinel console call
- List的stream中Long对象与long判等问题记录
- [mathematical logic] equivalent calculus and reasoning calculus of predicate logic (individual word | predicate | quantifier | predicate logic formula | two basic formulas | proposition symbolization
- 聊聊支付流程的设计与实现逻辑
- PHP MySQL Update
- How to deploy applications on kubernetes cluster
猜你喜欢
Type conversion, variable

win32:堆破坏的dump文件分析

一入“远程”终不悔,几人欢喜几人愁。| 社区征文

STM32 realizes 74HC595 control
Automata and automatic line of non-standard design
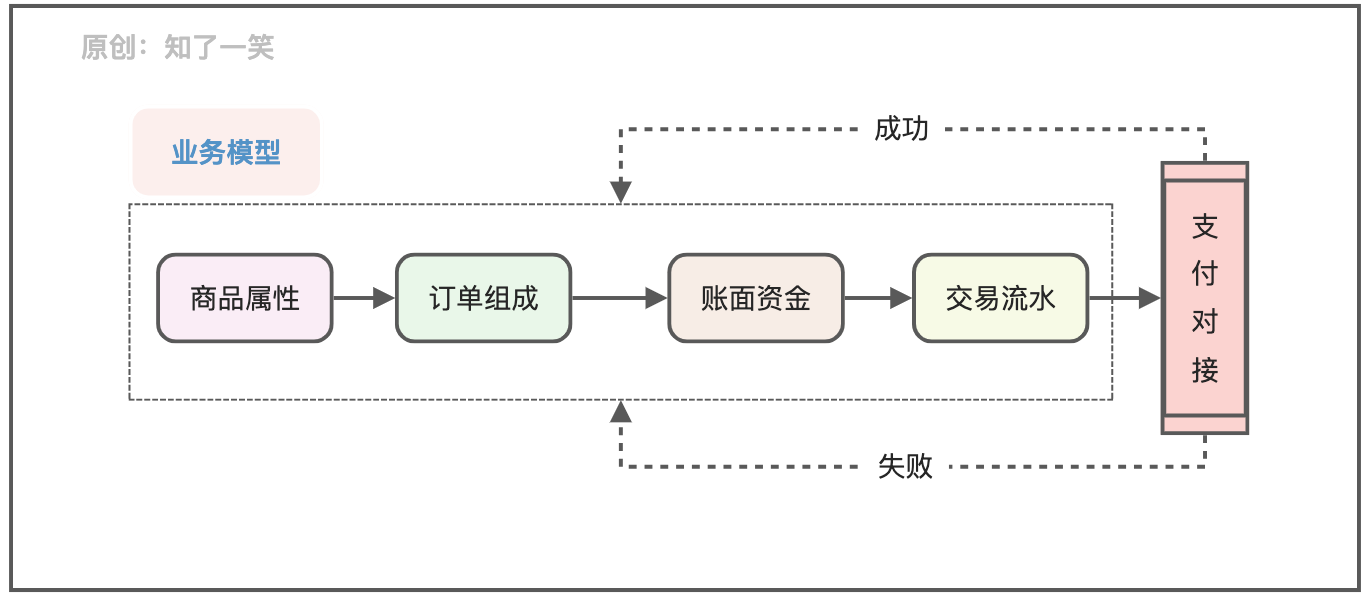
聊聊支付流程的设计与实现逻辑

PHP MySQL create database

Line by line explanation of yolox source code of anchor free series network (5) -- mosaic data enhancement and mathematical understanding

Research Report on competitive strategy Outlook Analysis and investment strategic planning of China's smart home equipment industry, 2022-2028

TCP拥塞控制详解 | 3. 设计空间
随机推荐
Embedded-c language-7
SSL / bio pour OpenSSL Get FD
A. Odd Selection【BruteForce】
1146_ SiCp learning notes_ exponentiation
Win32: analyse du fichier dump pour la défaillance du tas
PHP MySQL Update
[tutorial] build your first application on coreos
微服务组件Sentinel控制台调用
毕业总结
(9) Opencv Canny edge detection
Create a new file from templates with bash script - create new file from templates with bash script
一入“远程”终不悔,几人欢喜几人愁。| 社区征文
Internet hospital his management platform source code, online consultation, appointment registration smart hospital applet source code
How to read the source code [debug and observe the source code]
Talk about the design and implementation logic of payment process
Research Report on market demand and investment planning for the development of China's office chair industry, 2022-2028
(8) HS corner detection
Codeforces Round #803 (Div. 2) C. 3SUM Closure
supervisor监控Gearman任务
Three gradient descent methods and code implementation