当前位置:网站首页>【数据挖掘】任务6:DBSCAN聚类
【数据挖掘】任务6:DBSCAN聚类
2022-07-03 01:09:00 【zstar-_】
要求
编程实现DBSCAN对下列数据的聚类
数据获取:https://download.csdn.net/download/qq1198768105/85865302
导库与全局设置
from scipy.io import loadmat
import matplotlib.pyplot as plt
import numpy as np
from sklearn.cluster import DBSCAN
from sklearn import datasets
import pandas as pd
plt.rcParams['font.sans-serif'] = ["SimHei"]
plt.rcParams["axes.unicode_minus"] = False
DBSCAN 聚类参数说明
eps:ϵ-邻域的距离阈值,和样本距离超过ϵ的样本点不在ϵ-邻域内,默认值是0.5。
min_samples:形成高密度区域的最小点数。作为核心点的话邻域(即以其为圆心,eps为半径的圆,含圆上的点)中的最小样本数(包括点本身)。
若y=-1,则为异常点
由于DBSCAN生成的类别不确定,因此定义一个函数用来筛选出符合指定类别的最合适的参数。
合适的标准是异常点个数最少
def search_best_parameter(N_clusters, X):
    min_outliners = 999
    best_eps = 0
    best_min_samples = 0
    # 迭代不同的eps值
    for eps in np.arange(0.001, 1, 0.05):
        # 迭代不同的min_samples值
        for min_samples in range(2, 10):
            dbscan = DBSCAN(eps=eps, min_samples=min_samples)
            # 模型拟合
            y = dbscan.fit_predict(X)
            # 统计各参数组合下的聚类个数(-1表示异常点)
            if len(np.argwhere(y == -1)) == 0:
                n_clusters = len(np.unique(y))
            else:
                n_clusters = len(np.unique(y)) - 1
            # 异常点的个数
            outliners = len([i for i in y if i == -1])
            if outliners < min_outliners and n_clusters == N_clusters:
                min_outliners = outliners
                best_eps = eps
                best_min_samples = min_samples
    return best_eps, best_min_samples
# 导入数据
colors = ['green', 'red', 'blue']
smile = loadmat('data-密度聚类/smile.mat')
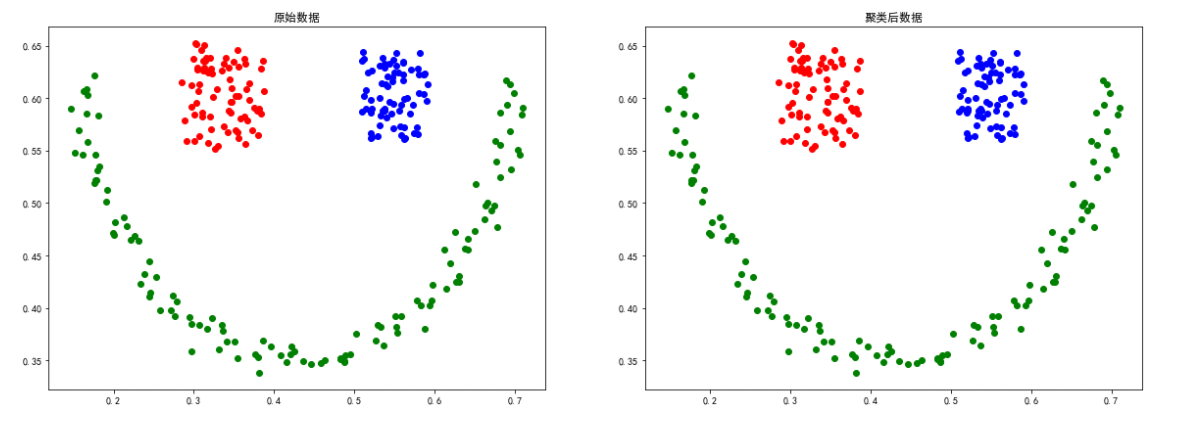
smile数据
X = smile['smile']
eps, min_samples = search_best_parameter(3, X)
dbscan = DBSCAN(eps=eps, min_samples=min_samples)
y = dbscan.fit_predict(X)
# 聚类结果可视化
plt.figure(figsize=(20, 15))
plt.subplot(2, 2, 1)
for i in range(len(smile['smile'])):
    plt.scatter(smile['smile'][i][0], smile['smile'][i][1],
                color=colors[int(smile['smile'][i][2])])
    plt.title("原始数据")
plt.subplot(2, 2, 2)
for i in range(len(y)):
    plt.scatter(smile['smile'][i][0], smile['smile'][i][1], color=colors[y[i]])
    plt.title("聚类后数据")
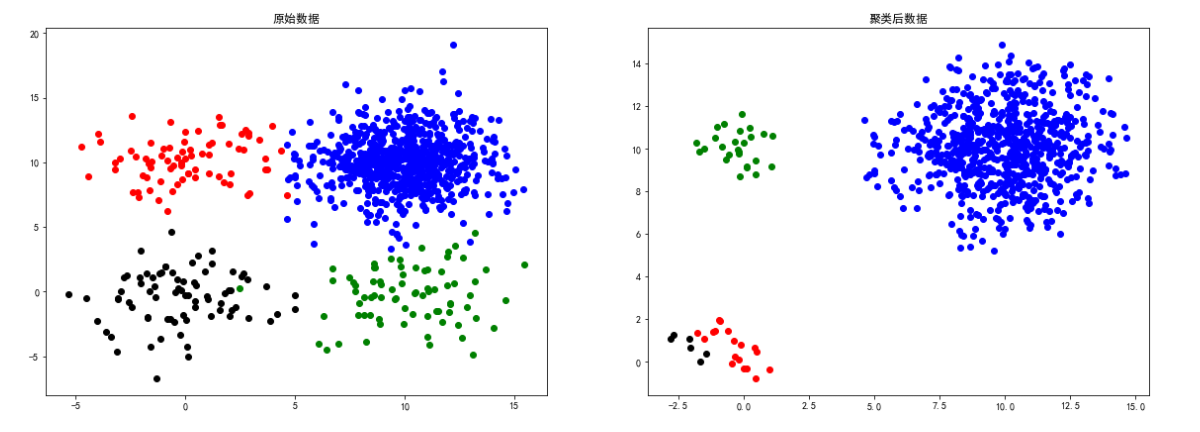
sizes5数据
# 导入数据
colors = ['blue', 'green', 'red', 'black', 'yellow']
sizes5 = loadmat('data-密度聚类/sizes5.mat')
X = sizes5['sizes5']
eps, min_samples = search_best_parameter(4, X)
dbscan = DBSCAN(eps=eps, min_samples=min_samples)
y = dbscan.fit_predict(X)
# 聚类结果可视化
plt.figure(figsize=(20, 15))
plt.subplot(2, 2, 1)
for i in range(len(sizes5['sizes5'])):
    plt.scatter(sizes5['sizes5'][i][0], sizes5['sizes5']
                [i][1], color=colors[int(sizes5['sizes5'][i][2])])
    plt.title("原始数据")
plt.subplot(2, 2, 2)
for i in range(len(y)):
    if y[i] != -1:
        plt.scatter(sizes5['sizes5'][i][0], sizes5['sizes5']
                    [i][1], color=colors[y[i]])
        plt.title("聚类后数据")
square1数据
# 导入数据
colors = ['green', 'red', 'blue', 'black']
square1 = loadmat('data-密度聚类/square1.mat')
X = square1['square1']
eps, min_samples = search_best_parameter(4, X)
dbscan = DBSCAN(eps=eps, min_samples=min_samples)
y = dbscan.fit_predict(X)
# 聚类结果可视化
plt.figure(figsize=(20, 15))
plt.subplot(2, 2, 1)
for i in range(len(square1['square1'])):
    plt.scatter(square1['square1'][i][0], square1['square1']
                [i][1], color=colors[int(square1['square1'][i][2])])
    plt.title("原始数据")
plt.subplot(2, 2, 2)
for i in range(len(y)):
    plt.scatter(square1['square1'][i][0], square1['square1']
                [i][1], color=colors[y[i]])
    plt.title("聚类后数据")

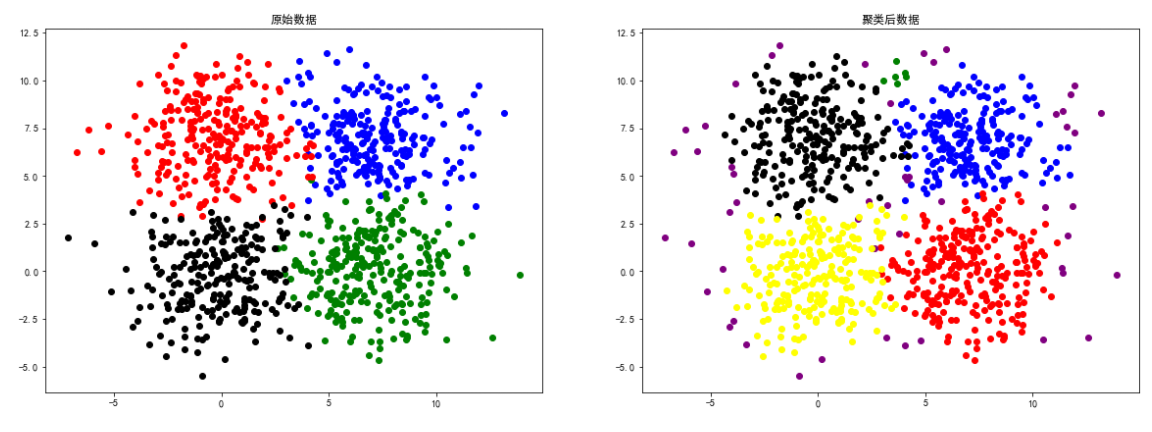
square4数据
# 导入数据
colors = ['blue', 'green', 'red', 'black',
          'yellow', 'brown', 'orange', 'purple']
square4 = loadmat('data-密度聚类/square4.mat')
X = square4['b']
eps, min_samples = search_best_parameter(5, X)
dbscan = DBSCAN(eps=eps, min_samples=min_samples)
y = dbscan.fit_predict(X)
# 聚类结果可视化
plt.figure(figsize=(20, 15))
plt.subplot(2, 2, 1)
for i in range(len(square4['b'])):
    plt.scatter(square4['b'][i][0], square4['b']
                [i][1], color=colors[int(square4['b'][i][2])])
    plt.title("原始数据")
plt.subplot(2, 2, 2)
for i in range(len(y)):
    plt.scatter(square4['b'][i][0], square4['b']
                [i][1], color=colors[y[i]])
    plt.title("聚类后数据")
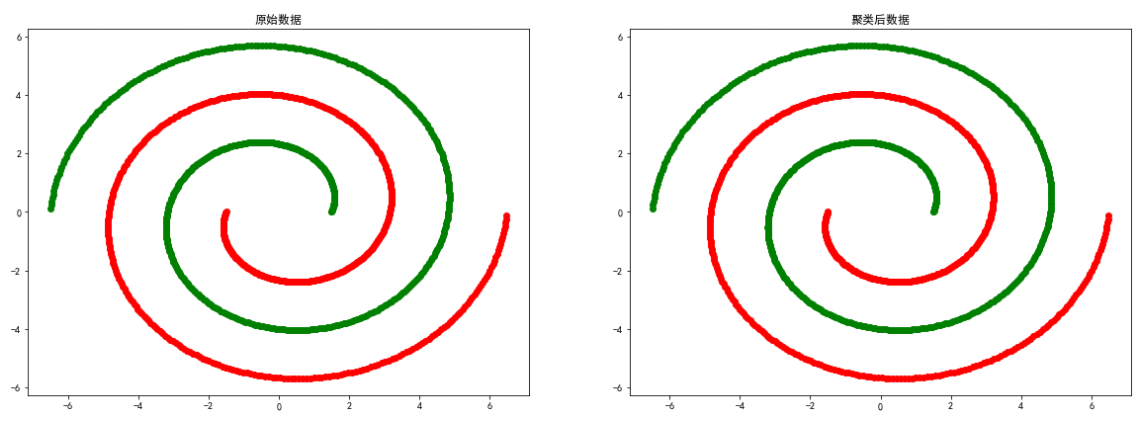
spiral数据
# 导入数据
colors = ['green', 'red']
spiral = loadmat('data-密度聚类/spiral.mat')
X = spiral['spiral']
eps, min_samples = search_best_parameter(2, X)
dbscan = DBSCAN(eps=eps, min_samples=min_samples)
y = dbscan.fit_predict(X)
# 聚类结果可视化
plt.figure(figsize=(20, 15))
plt.subplot(2, 2, 1)
for i in range(len(spiral['spiral'])):
    plt.scatter(spiral['spiral'][i][0], spiral['spiral']
                [i][1], color=colors[int(spiral['spiral'][i][2])])
    plt.title("原始数据")
plt.subplot(2, 2, 2)
for i in range(len(y)):
    plt.scatter(spiral['spiral'][i][0], spiral['spiral']
                [i][1], color=colors[y[i]])
    plt.title("聚类后数据")
moon数据
# 导入数据
colors = ['green', 'red']
moon = loadmat('data-密度聚类/moon.mat')
X = moon['a']
eps, min_samples = search_best_parameter(2, X)
dbscan = DBSCAN(eps=eps, min_samples=min_samples)
y = dbscan.fit_predict(X)
# 聚类结果可视化
plt.figure(figsize=(20, 15))
plt.subplot(2, 2, 1)
for i in range(len(moon['a'])):
    plt.scatter(moon['a'][i][0], moon['a']
                [i][1], color=colors[int(moon['a'][i][2])])
    plt.title("原始数据")
plt.subplot(2, 2, 2)
for i in range(len(y)):
    plt.scatter(moon['a'][i][0], moon['a']
                [i][1], color=colors[y[i]])
    plt.title("聚类后数据")

long数据
# 导入数据
colors = ['green', 'red']
long = loadmat('data-密度聚类/long.mat')
X = long['long1']
eps, min_samples = search_best_parameter(2, X)
dbscan = DBSCAN(eps=eps, min_samples=min_samples)
y = dbscan.fit_predict(X)
# 聚类结果可视化
plt.figure(figsize=(20, 15))
plt.subplot(2, 2, 1)
for i in range(len(long['long1'])):
    plt.scatter(long['long1'][i][0], long['long1']
                [i][1], color=colors[int(long['long1'][i][2])])
    plt.title("原始数据")
plt.subplot(2, 2, 2)
for i in range(len(y)):
    plt.scatter(long['long1'][i][0], long['long1']
                [i][1], color=colors[y[i]])
    plt.title("聚类后数据")

2d4c数据
# 导入数据
colors = ['green', 'red', 'blue', 'black']
d4c = loadmat('data-密度聚类/2d4c.mat')
X = d4c['a']
eps, min_samples = search_best_parameter(4, X)
dbscan = DBSCAN(eps=eps, min_samples=min_samples)
y = dbscan.fit_predict(X)
# 聚类结果可视化
plt.figure(figsize=(20, 15))
plt.subplot(2, 2, 1)
for i in range(len(d4c['a'])):
    plt.scatter(d4c['a'][i][0], d4c['a']
                [i][1], color=colors[int(d4c['a'][i][2])])
    plt.title("原始数据")
plt.subplot(2, 2, 2)
for i in range(len(y)):
    plt.scatter(d4c['a'][i][0], d4c['a']
                [i][1], color=colors[y[i]])
    plt.title("聚类后数据")

总结
上述实验证明了DBSCAN聚类方法比较依赖数据点位置上的关联度,对于smile、spiral等分布的数据聚类效果较好。
边栏推荐
- 2022 cable crane driver examination registration and cable crane driver certificate examination
- [机缘参悟-36]:鬼谷子-飞箝篇 - 面对捧杀与诱饵的防范之道
- 海量数据冷热分离方案与实践
- 【C语言】指针与数组笔试题详解
- 按鍵精靈打怪學習-多線程後臺坐標識別
- Give you an array numbers that may have duplicate element values. It was originally an array arranged in ascending order, and it was rotated once according to the above situation. Please return the sm
- Leetcode 6103 - minimum fraction to delete an edge from the tree
- MySQL basic usage 02
- Mathematical knowledge: divisible number inclusion exclusion principle
- Kivy tutorial - example of using Matplotlib in Kivy app
猜你喜欢
Arduino dy-sv17f automatic voice broadcast

leetcode 2097 — 合法重新排列数对
【QT】自定义控件的封装

【我的OpenGL学习进阶之旅】关于欧拉角、旋转顺序、旋转矩阵、四元数等知识的整理
每日一题之干草堆的移动

Expérience de recherche d'emploi d'un programmeur difficile

Androd gradle's substitution of its use module dependency
After reading this article, I will teach you to play with the penetration test target vulnhub - drivetingblues-9
Leetcode 6103 - minimum fraction to delete an edge from the tree

传输层 TCP主要特点和TCP连接
随机推荐
d,ldc构建共享库
[flutter] icons component (fluttericon Download Icon | customize SVG icon to generate TTF font file | use the downloaded TTF icon file)
[shutter] animation animation (shutter animation type | the core class of shutter animation)
一比特苦逼程序員的找工作經曆
After reading this article, I will teach you to play with the penetration test target vulnhub - drivetingblues-9
CF1617B Madoka and the Elegant Gift、CF1654C Alice and the Cake、 CF1696C Fishingprince Plays With Arr
软考信息系统项目管理师_历年真题_2019下半年错题集_上午综合知识题---软考高级之信息系统项目管理师053
Mathematical knowledge: divisible number inclusion exclusion principle
How wide does the dual inline for bread board need?
Find a benchmark comrade in arms | a million level real-time data platform, which can be used for free for life
Druid database connection pool
dotConnect for PostgreSQL数据提供程序
对非ts/js文件模块进行类型扩充
Kivy tutorial - example of using Matplotlib in Kivy app
The meaning of wildcard, patsubst and notdir in makefile
[机缘参悟-36]:鬼谷子-飞箝篇 - 面对捧杀与诱饵的防范之道
【FPGA教程案例6】基于vivado核的双口RAM设计与实现
串口抓包/截断工具的安装及使用详解
看疫情之下服装企业如何顺势而为
MySQL