当前位置:网站首页>Using DLV to analyze the high CPU consumption of golang process
Using DLV to analyze the high CPU consumption of golang process
2022-07-03 08:52:00 【Clovemeo】
c++ adopt dbg Analyze memory and cpu, Maybe everyone will . This article mainly analyzes through delve analysis golang Program cpu High occupancy .
delve yes golang Recommended specialty go Language debugging tools , To replace gdb.golang Organizational theory delve Can better understand go Language .
First use vscode Write a simple demo,main.go The code is as follows :
package main

import (
	"fmt"
	"os"
	"os/signal"
)

func main() {
	fmt.Println("main start")

	msgList := make(chan int, 100)
	go func() {
		for {
			select {
			case <-msgList:
			default:

			}
		}
	}()

	c := make(chan os.Signal, 1)
	signal.Notify(c, os.Interrupt, os.Kill)
	s := <-c

	fmt.Println("main exit.get signal:", s)
}
go build -o cpudetect main.go Compile the generated cpudetect And put it on the server to run .
Next is the specific analysis steps :
One 、top Command to see which process :
top
Tasks: 168 total,   1 running, 166 sleeping,   1 stopped,   0 zombie
%Cpu(s): 94.4 us,  5.6 sy,  0.0 ni,  0.0 id,  0.0 wa,  0.0 hi,  0.0 si,  0.0 st
KiB Mem :   995684 total,    73064 free,   613904 used,   308716 buff/cache
KiB Swap:  2097148 total,  2093300 free,     3848 used.   200060 avail Mem

   PID USER      PR  NI    VIRT    RES    SHR S %CPU %MEM     TIME+ COMMAND
  7819 root      20   0  703020   1000    632 S 94.1  0.1   3:07.05 cpudetect
     1 root      20   0  128296   6704   3912 S  0.0  0.7   0:04.22 systemd
     2 root      20   0       0      0      0 S  0.0  0.0   0:00.01 kthreadd
     4 root       0 -20       0      0      0 S  0.0  0.0   0:00.00 kworker/0:0H
You can see cpudetect Process cpu Occupied 94.1.
Two 、top -H -p 7819 Command to view the process cpudetect Specific thread information :
./dlv attach 7819
top - 01:36:29 up  3:18,  2 users,  load average: 0.68, 0.18, 0.18
Threads:   5 total,   1 running,   4 sleeping,   0 stopped,   0 zombie
%Cpu(s):100.0 us,  0.0 sy,  0.0 ni,  0.0 id,  0.0 wa,  0.0 hi,  0.0 si,  0.0 st
KiB Mem :   995684 total,    73188 free,   613780 used,   308716 buff/cache
KiB Swap:  2097148 total,  2093300 free,     3848 used.   200184 avail Mem

   PID USER      PR  NI    VIRT    RES    SHR S %CPU %MEM     TIME+ COMMAND
  7823 root      20   0  703020   1000    632 R 99.3  0.1   0:50.62 cpudetect
  7819 root      20   0  703020   1000    632 S  0.0  0.1   0:00.00 cpudetect
  7820 root      20   0  703020   1000    632 S  0.0  0.1   0:00.06 cpudetect
  7821 root      20   0  703020   1000    632 S  0.0  0.1   0:00.01 cpudetect
  7822 root      20   0  703020   1000    632 S  0.0  0.1   0:00.00 cpudetect
You can see that the main reason is threads 7823 Occupy cpu Too high .
3、 ... and 、 adopt ./dlv attach 7819 Command start debugging :
./dlv attach 7819
# Use goroutines Command to view all collaboration information :
(dlv) goroutines
Goroutine 1 - User: E:/golang/cpuDetect/src/cpudetect/main.go:26 main.main (0x494212)
Goroutine 2 - User: c:/go/src/runtime/proc.go:305 runtime.gopark (0x431ae0)
Goroutine 3 - User: c:/go/src/runtime/proc.go:305 runtime.gopark (0x431ae0)
Goroutine 4 - User: c:/go/src/runtime/proc.go:305 runtime.gopark (0x431ae0)
Goroutine 5 - User: c:/go/src/runtime/proc.go:305 runtime.gopark (0x431ae0)
Goroutine 6 - User: E:/golang/cpuDetect/src/cpudetect/main.go:16 main.main.func1 (0x4942e4) (thread 7823)
Goroutine 7 - User: c:/go/src/runtime/sigqueue.go:147 os/signal.signal_recv (0x44559c)
Goroutine 8 - User: c:/go/src/runtime/proc.go:305 runtime.gopark (0x431ae0)
You can see the synergy 6 Hang on 7823 Under the thread of (7823 Just now cpu High thread occupancy ).
 # Switch to coroutine 6 And check the specific stack information :
 (dlv) goroutine 6
 Switched from 6 to 6 (thread 7823)
 (dlv) bt
 0  0x0000000000405a89 in runtime.chanrecv
   at c:/go/src/runtime/chan.go:451
 1  0x0000000000405dca in runtime.selectnbrecv
   at c:/go/src/runtime/chan.go:646
 2  0x00000000004942e4 in main.main.func1
   at E:/golang/cpuDetect/src/cpudetect/main.go:16
 3  0x000000000045dad1 in runtime.goexit
   at c:/go/src/runtime/asm_amd64.s:1373
From the stack information above , You can go to main.go 16 That's ok , Then analyze the corresponding code , You can be sure it's select Medium plus defualt But no treatment led to cpu Idle , Which leads to cpu Too high .
in addition ,dlv There are many other commands for debugging , Let's pass it by ourselves help Command to check .
边栏推荐
猜你喜欢

单调栈-84. 柱状图中最大的矩形
![[redis] redis persistent RDB vs AOF (source code)](/img/57/b6a86c49cedee31fc00dc5d1372023.jpg)
[redis] redis persistent RDB vs AOF (source code)

On the setting of global variable position in C language
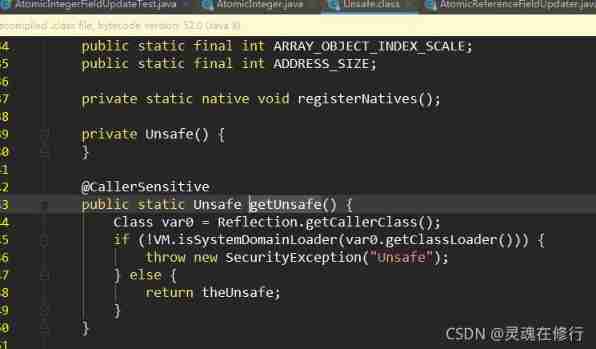
Concurrent programming (V) detailed explanation of atomic and unsafe magic classes
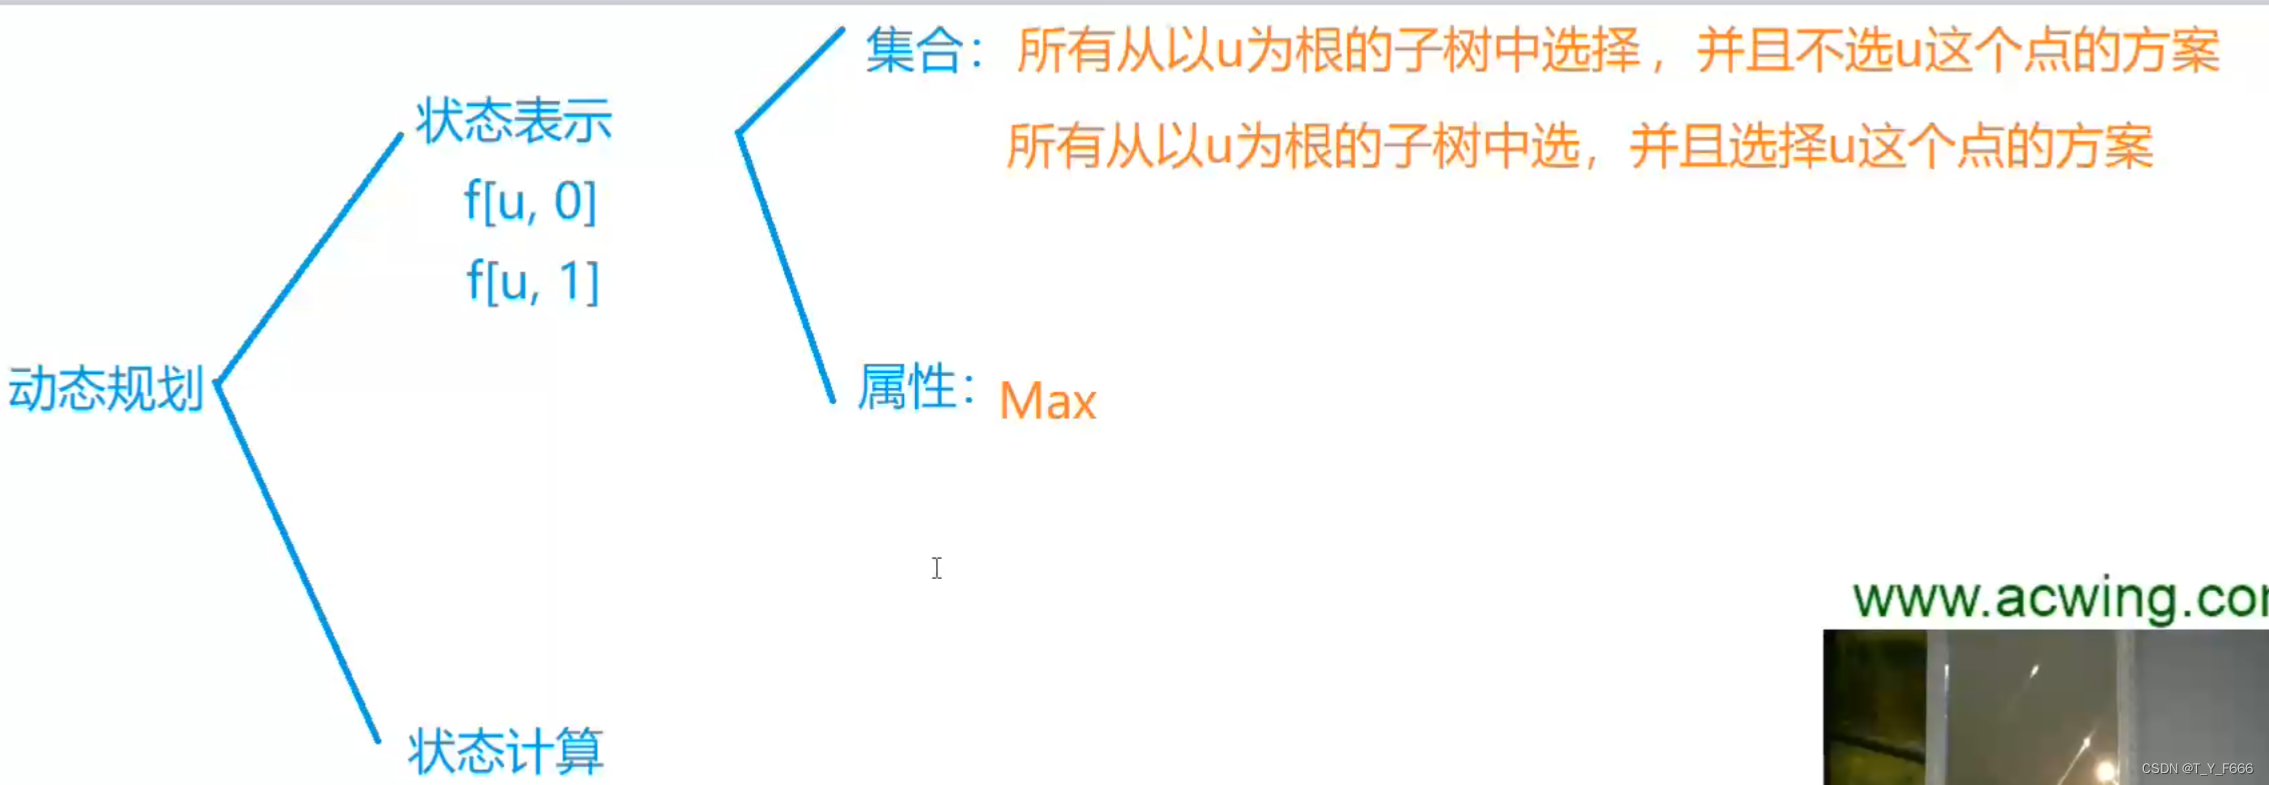
树形DP AcWing 285. 没有上司的舞会
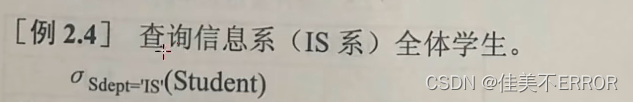
数据库原理期末复习
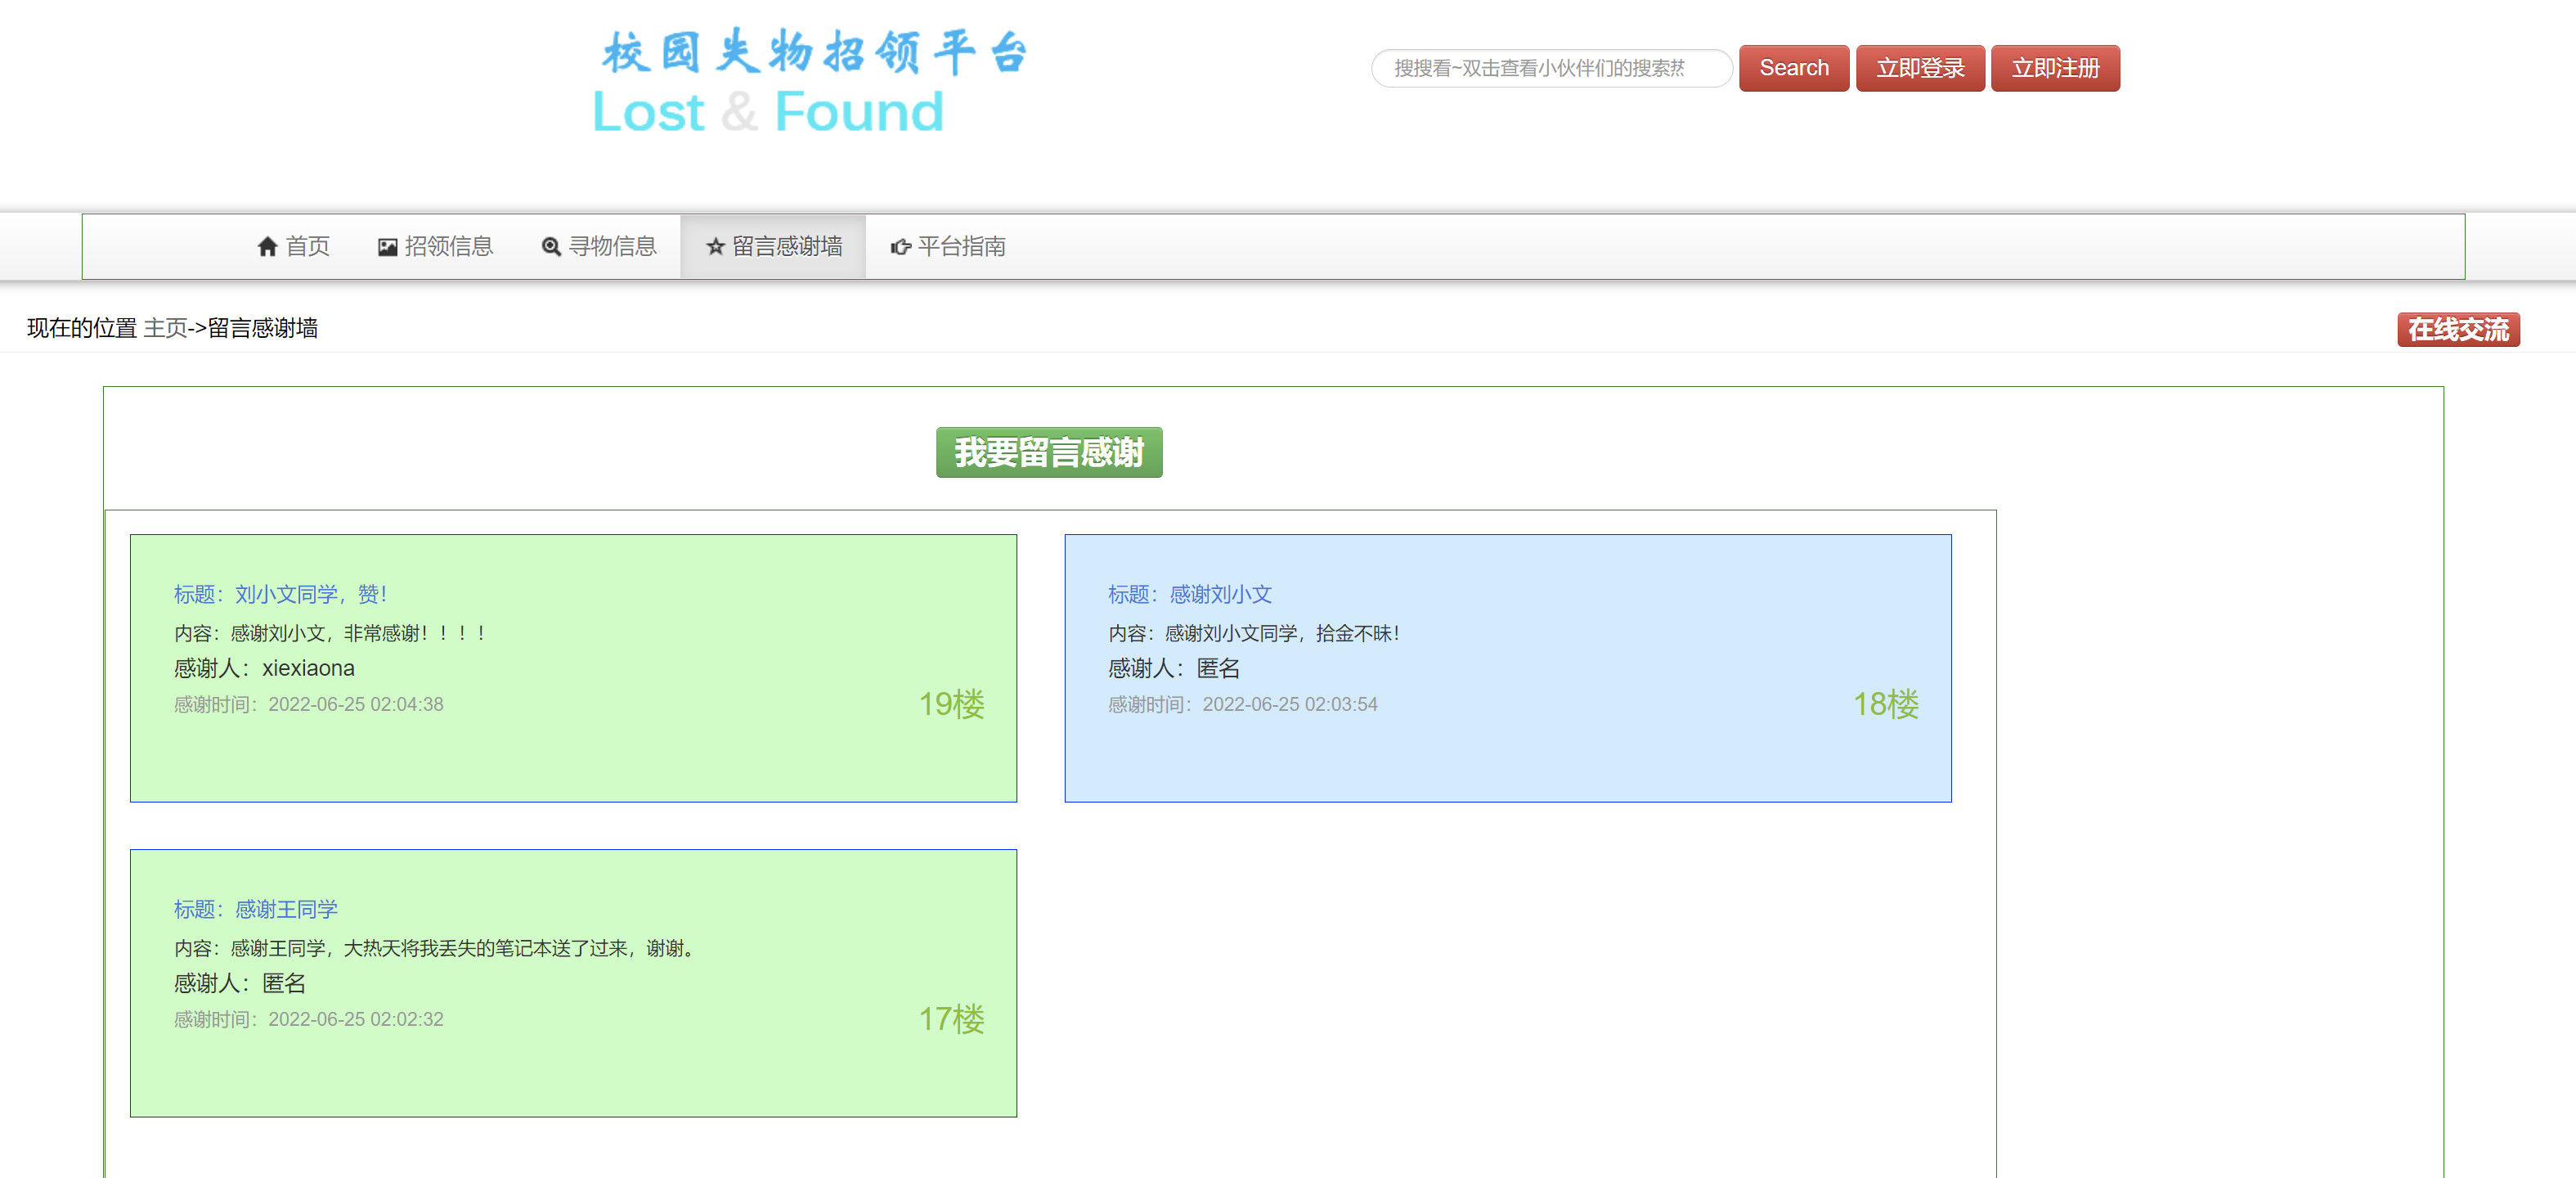
Campus lost and found platform based on SSM, source code, database script, project import and operation video tutorial, Thesis Writing Tutorial

【Rust笔记】02-所有权
![[concurrent programming] working mechanism and type of thread pool](/img/51/d21428a7c95c0a5177e8198742e78c.jpg)
[concurrent programming] working mechanism and type of thread pool
Dom4j traverses and updates XML
随机推荐
Unity editor expansion - the framework and context of unity imgui
【Rust笔记】06-包和模块
Unity interactive water ripple post-treatment
Dom4j traverses and updates XML
TP5 multi condition sorting
Gradle's method of dynamically modifying APK package name
I made mistakes that junior programmers all over the world would make, and I also made mistakes that I shouldn't have made
Solution of 300ms delay of mobile phone
Dealing with duplicate data in Excel with xlwings
Unity learning notes
UE4 source code reading_ Bone model and animation system_ Animation process
Collection interface
【Rust 笔记】09-特型与泛型
MySQL index types B-tree and hash
Binary tree traversal (first order traversal. Output results according to first order, middle order, and last order)
Divide candy (circular queue)
Markdown directory generation
Find the intersection of line segments
[concurrent programming] Table hopping and blocking queue
Convert video to GIF