当前位置:网站首页>Microservice system design -- microservice monitoring and system resource monitoring design
Microservice system design -- microservice monitoring and system resource monitoring design
2022-06-27 04:22:00 【Zhuangxiaoyan】
Abstract
Each micro service module is basically in place , But how is the system running , Is there any way to check it ? This article will take you to see how to view some information about the system runtime . Help development engineers sort problems , At the same time, it is also the protection of data monitoring and services provided by operation and maintenance engineers . This blog will introduce the monitoring function design of microservices .
One 、Actuator plug-in unit
The careful little friend found , Every microservice's pom There are the following in the file configuration jar quote , This is a Spring Boot Provides a series of additional feature components to help you monitor and manage running system applications .
<dependency>
            <groupId>org.springframework.boot</groupId>
            <artifactId>spring-boot-starter-actuator</artifactId>
</dependency>
In addition to introducing corresponding jar Outside the package , You also need to specify the configuration . Because only by default health、info Two API, Other API Use it normally , Need to exposure The configuration item is set to *, For normal use Actuator Exposed interfaces .
management.endpoints.web.exposure.include=*The picture below is Actuator All external interfaces provided , The four in the upper left corner are Web Application unique .

After starting any application , Enter web address in browser http://localhost:10065/actuator/ You can view all interface addresses , All response messages are in the form of JSON In the form of output . give an example , visit http://localhost:10065/actuator/metrics, The browser response information is as follows :
By visiting different addresses , You can get relevant information about the service , more Actuator Refer to for the component related documentation Spring Boot Actuator Introduction to official documents . But all the information returned by the plug-in is text information , Not intuitive enough , It takes a lot of energy for the monitor to interpret the information behind it .
Two 、Spring Boot Admin
Introduce here Spring Boot Admin, It's a Web application , Official website address :
GitHub - codecentric/spring-boot-admin: Admin UI for administration of spring boot applications,
It is based on Actutor, On top of it UI beautify , Usability is greatly improved for users , Let's experience it intuitively .


2.1 Create a new monitoring server
be based on Spring Boot Quickly build parking-admin Sub module ,pom.xml Add dependency in :
<properties>
        <spring.boot.admin.version>2.1.2</spring.boot.admin.version>
</properties>

<dependencies>
    <dependency>
        <groupId>de.codecentric</groupId>
        <artifactId>spring-boot-admin-starter-server</artifactId>
        <version>${spring.boot.admin.version}</version>
    </dependency>
    <dependency>
        <groupId>org.springframework.boot</groupId>
        <artifactId>spring-boot-starter-web</artifactId>
    </dependency>
</dependencies>
application.yml The configuration file :
server:
  port: 10090

management:
  endpoints:
    web:
      exposure:
        include: \\*
  security:
    enabled: false
  endpoint:
    health:
      show-details: ALWAYS

spring:
  application:
    name: parking-admin
Applying the main class is also very simple , increase @EnableAdminServer Annotations can be :
@EnableAdminServer
@SpringBootApplication
public class BootAdminApplication {

    public static void main(String[] args) {
        SpringApplication.run(BootAdminApplication.class, args);
    }

}
After the application starts , The server is finished , Browser open localhost:8081 see Spring Boot Admin The main page : The page has been in Loading state , Directly to the monitored end application .

2.2 Add monitoring end application
Directly in the corresponding modules to be monitored , Introduce the corresponding client jar that will do .( Version suggestions and spring-boot-admin-starter-server bring into correspondence with )
<dependency>
            <groupId>de.codecentric</groupId>
            <artifactId>spring-boot-admin-starter-client</artifactId>
</dependency>
Corresponding application.properties Add configuration :
# Must be exposed , Otherwise admin-server Can't get health data
management.endpoints.web.exposure.include=*
management.security.enabled=false
management.endpoint.health.show-details=ALWAYS

#admin server address
spring.boot.admin.client.url=http://localhost:10090
Just two steps , Others do not need to be changed too much , Start the main program class , We serve resources as an example , Return to the monitoring page , You will find that the resource service instance has been monitored , And listed in the interface :

Click the application instance , Go to the more detailed information view , So far through Spring Boot Admin The application monitoring implemented can be used normally . Although monitoring has stepped out of the ranks of code development , But now DevOps、SRE Prevalence of concepts , The boundary between development and operation and maintenance becomes more and more blurred , Closer and closer cooperation , It is necessary to know some monitoring knowledge . in addition , Monitoring microservices is an indispensable part of any microservice architecture . but Spring Boot Admin Only the information of the application itself can be monitored , The host information to which the application belongs cannot be monitored , Do you know any way to monitor ?
3、 ... and 、grafana+prometheus Monitoring system resources
Blog reference
边栏推荐
猜你喜欢

文旅灯光秀打破时空限制,展现景区夜游魅力
真xx相来了?测试/开发程序员为什么不愿意加班,这是个疯狂的状态......

Agile development - self use

Kotlin compose implicitly passes the parameter compositionlocalprovider
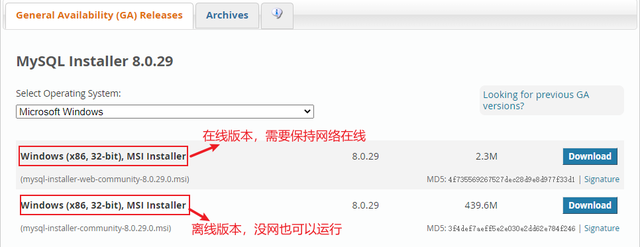
MySql最详细的下载教程

日志收集系统
渗透测试-目录遍历漏洞

低代码开发平台NocoBase的安装
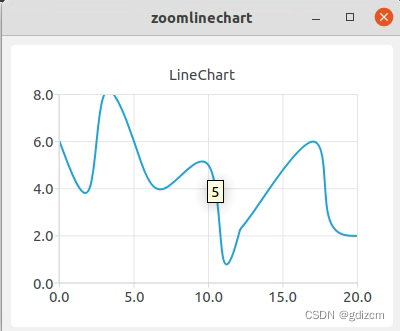
QChart笔记2: 添加鼠标悬停显示

JMeter takes the result of the previous request as the parameter of the next request
随机推荐
文旅灯光秀打破时空限制,展现景区夜游魅力
微服务系统设计——统一鉴权服务设计
静态时序分析-OCV和time derate
MySQL development environment
Kotlin Compose 隐式传参 CompositionLocalProvider
Kotlin compose custom compositionlocalprovider compositionlocal
Description of replacement with STM32 or gd32
021 C语言基础:递归,可变参数
Fplan power planning
Further exploration of handler (I) (the most complete analysis of the core principle of handler)
halcon常用仿射变换算子
微服务系统设计——分布式定时服务设计
使用promise的基本功能【四、Promise源码】
Promise source code class version [III. promise source code] [detailed code comments / complete test cases]
007 C语言基础:C运算符
promise源码-class版本【三、Promise源码】【代码详细注释/测试案例完整】
Matlab | drawing of three ordinate diagram based on block diagram layout
IOS development: understanding of dynamic library shared cache (dyld)
Nacos调用微服务两个问题:1.Load balancer does not contain an instance for the service 2.Connection refused
MATLAB | 基于分块图布局的三纵坐标图绘制