当前位置:网站首页>VMD combined with ISSA to optimize LSSVM power prediction
VMD combined with ISSA to optimize LSSVM power prediction
2022-08-04 07:02:00 【Doraemon 001】
0, Preface
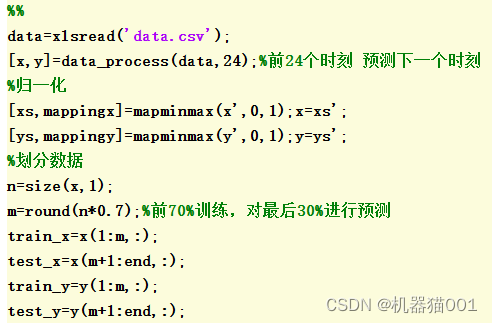
This paper tests the power prediction method of VMD combined with ISSA to optimize LSSVM: ①VMD realizes multi-scale decomposition to obtain detailed information; ②The improved SSA algorithm (ISSA algorithm) is used to optimize the parameters of LSSVM to achieve power prediction.
Introduction to ISSA: The article "Improved Sparrow Search Optimization Algorithm and Its Application" aims at the sparrow search algorithm (SSA) when solving the optimal solution of the objective function, the population diversity is not rich, and it is easy to fall into local optimum and multi-dimensional function solution accuracyTo solve the problem of poor quality, an improved sparrow search algorithm (ISSA) is proposed.First, use the reverse learning strategy to initialize the population to increase the diversity of the population; then, the step factor is dynamically adjusted to improve the solution accuracy of the algorithm; finally, the Levy flight is introduced into the sparrow position update formula for detection and early warning to improve the algorithm's ability to search for optimization.and the ability to jump out of local extrema.
This paper reproduces the improved sparrow search algorithm (ISSA) proposed in this paper and applies it to LSSVM parameter optimization.
1. Implementation process
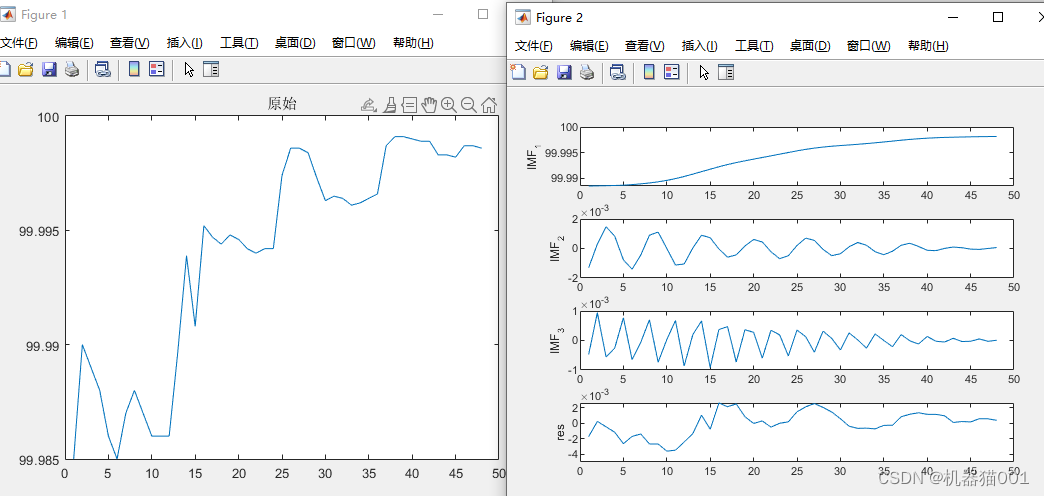
1.1 VMD decomposition
The left side of Figure 1 is the original data (sequential power data), and the right side is the VMD decomposition diagram
1.2 LSSVM prediction results
Construct sample data as shown in the figure above (each sample has a length of 24), and predict the next moment based on the data of the previous 24 moments.The prediction results of LSSVM alone are as follows:
1.3 VMD+LSSVM prediction results
Use VMD to decompose sample data (each sample length is 24), decompose the number of IMFs to 4, establish LSSVM prediction model for each component separately, and finally superimpose the prediction results of the four component models to form the final prediction result.
1.3 SSA optimized LSSVM prediction results
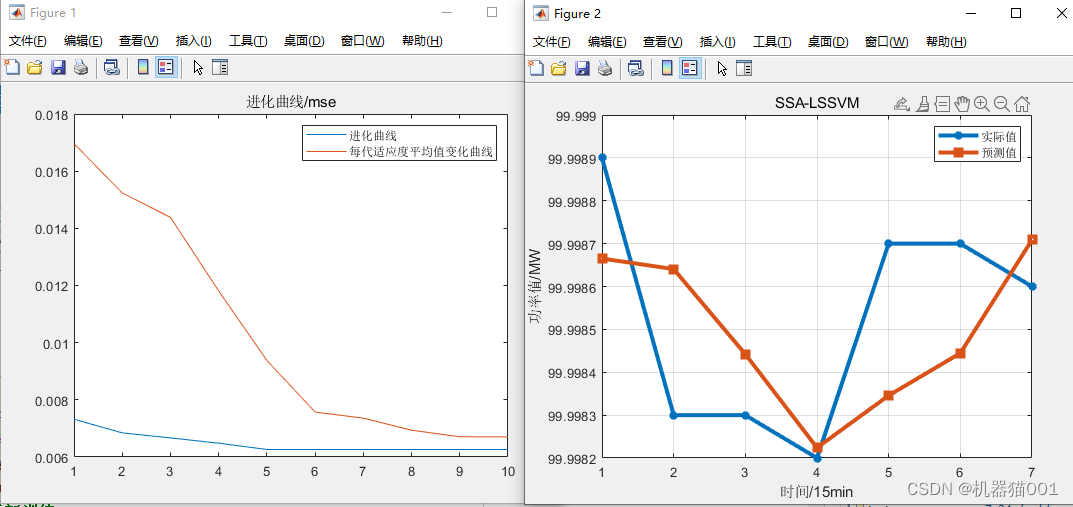
The SSA algorithm is used to optimize the parameters of LSSVM: gam and sig2, the fitness curve is shown on the left side of the figure below, and the final prediction result is shown on the right side of the figure below
1.4 ISSA optimized LSSVM prediction results
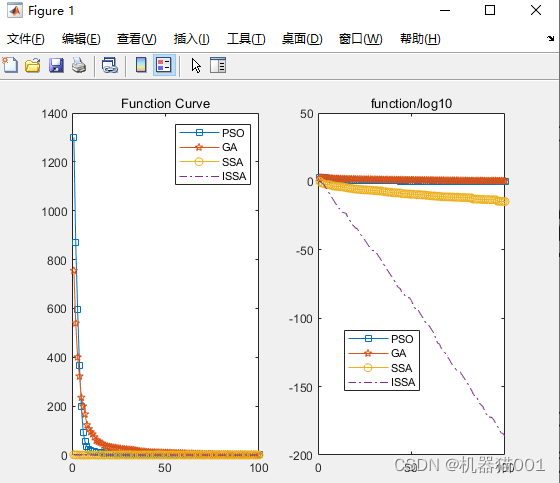
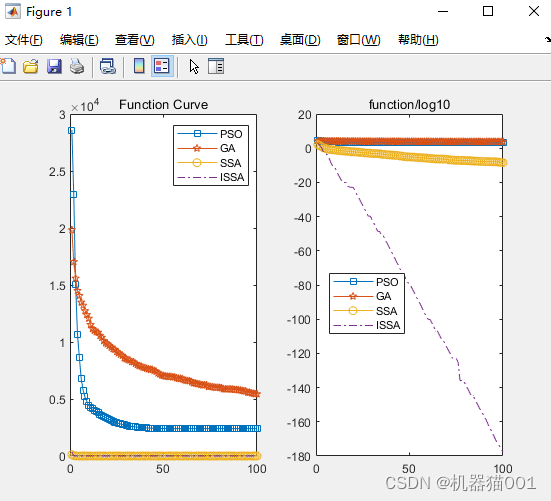
First, compare ISSA with SSA, GA, PSO and other optimization algorithms. The optimization effect on F1 and F3 is shown in Figure 1 and Figure 2 below
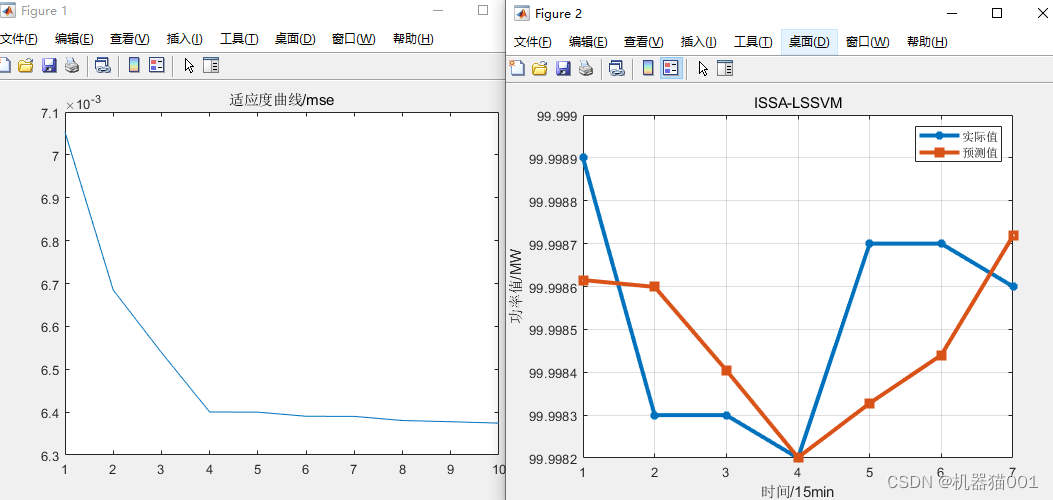
The ISSA algorithm is used to optimize the parameters of LSSVM: gam and sig2, the fitness curve is shown on the left side of the figure below, and the final prediction result is shown on the right side of the figure below
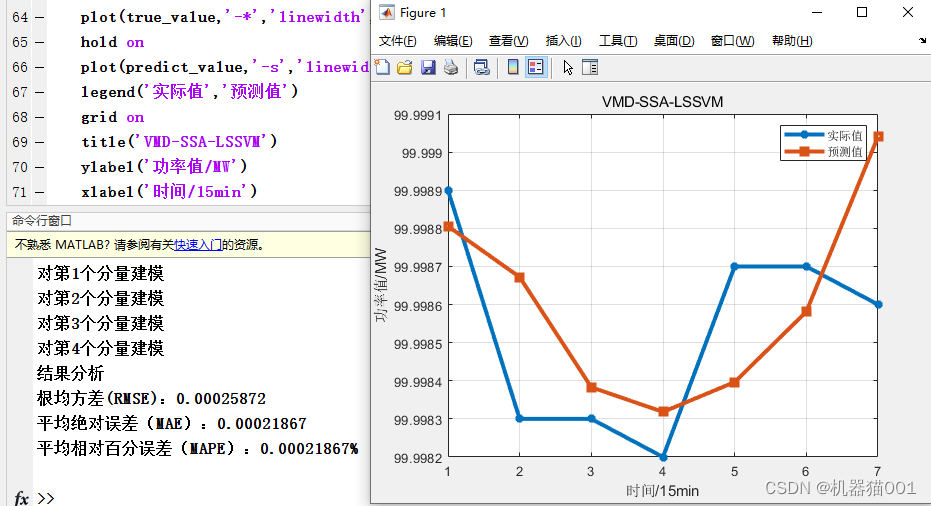
1.5 VMD+SSA+LSSVM effect
Use VMD to decompose the sample data (the length of each sample is 24), the number of decomposed IMFs is 4, the prediction model of SSA+LSSVM is established for each component separately, and finally the prediction results of the four component models are superimposed to form the final predictionresult.
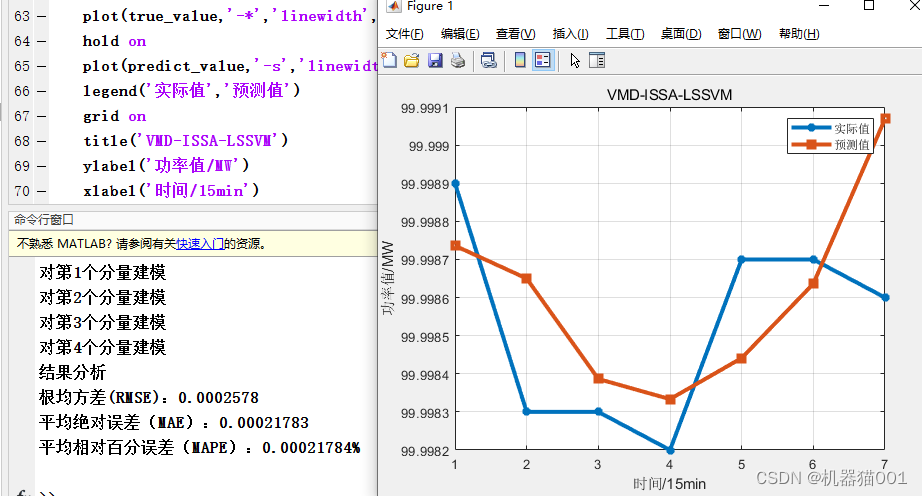
1.6 VMD+ISSA+LSSVM
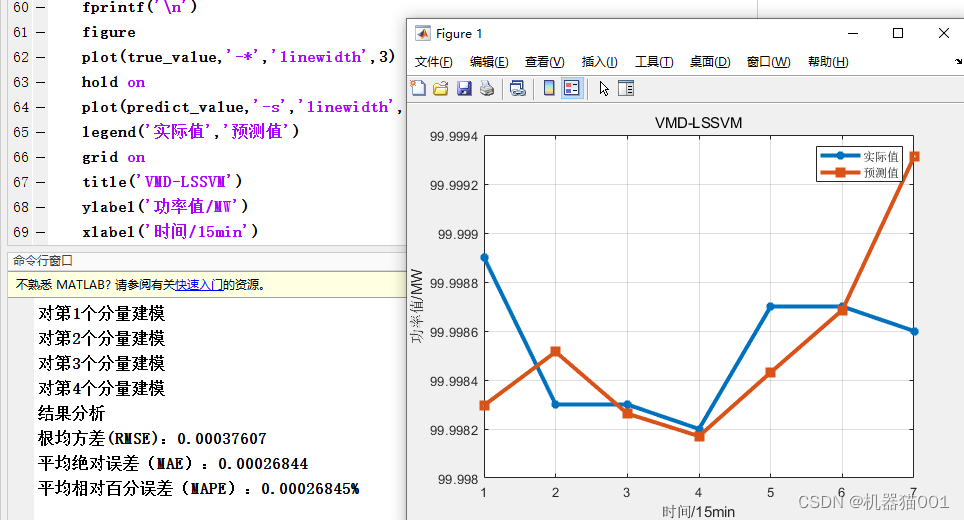
Use VMD to decompose the sample data (each sample length is 24), decompose the number of IMFs to 4, establish the ISSA+LSSVM prediction model for each component separately, and finally superimpose the prediction results of the four component models to form the final predictionresult.
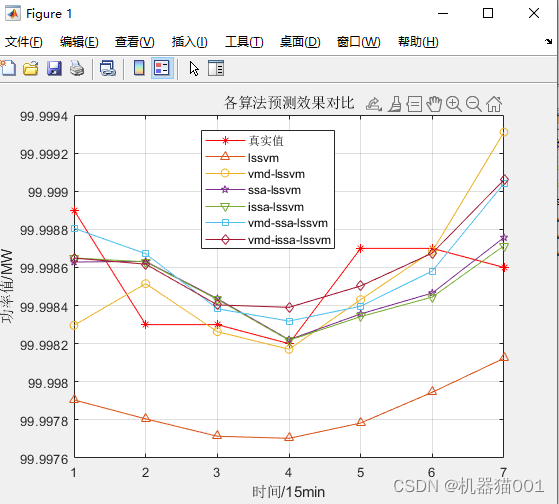
2 Method comparison
The comparison results of the above methods are as follows:
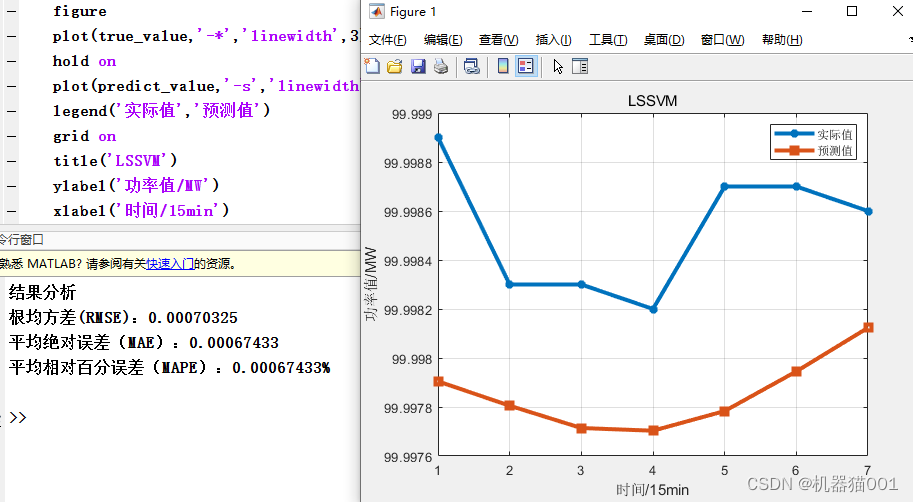
1-Analysis of Results-lssvm
Root Mean Square Error (RMSE): 0.00070325
Mean Absolute Error (MAE): 0.00067433
Mean Relative Percent Error (MAPE): 0.00067433%
2-Analysis of Results-vmd-lssvm
Root Mean Square Error (RMSE): 0.00037607
Mean Absolute Error (MAE): 0.00026844
Mean Relative Percent Error (MAPE): 0.00026845%
3-Analysis of Results-ssa-lssvm
Root Mean Square Error (RMSE): 0.00027739
Mean Absolute Error (MAE): 0.00025854
Mean Relative Percent Error (MAPE): 0.00025854%
4-Analysis of Results-issa-lssvm
Root Mean Square Error (RMSE): 0.00025952
Mean Absolute Error (MAE): 0.00023569
Mean Relative Percent Error (MAPE): 0.0002357%
5-Analysis of Results-vmd-ssa-lssvm
Root Mean Square Error (RMSE): 0.00025872
Mean Absolute Error (MAE): 0.00021867
Mean Relative Percent Error (MAPE): 0.00021867%
6-Analysis of Results-vmd-issa-lssvm
Root Mean Square Error (RMSE): 0.0002578
Mean Absolute Error (MAE): 0.00021783
Mean Relative Percent Error (MAPE): 0.00021784%
Description: This result is the result of one run, and the result will change after each run of the model.
边栏推荐
猜你喜欢


随机推荐
硬件知识:RTMP和RTSP传统流媒体协议介绍
数据库sql的基础语句
C#找系统文件夹路径
U-Net详解:为什么它适合做医学图像分割?(基于tf-Kersa复现代码)
关于gopher协议的ssrf攻击
软件:给大家推荐一款国产非常好用的效率软件uTools
第九篇 ApplicationContext初始化
CMDB 阿里云部分实现
YOLOv3详解:从零开始搭建YOLOv3网络
JUC并发容器——阻塞队列
DropBlock: 卷积层的正则化方法及复现代码
关于网络安全行业你知道多少?
Uos统信系统 本地APT源配置
基于时序模式注意力机制(TPA)的长短时记忆(LSTM)网络TPA-LSTM的多变量输入风电功率预测
EL expression
并发概念基础:线程安全与线程间通信
以太网 ARP
JUC锁框架——CountDownLatch、CyclicBarrier和Semaphore
FCN——语义分割的开山鼻祖(基于tf-Kersa复现代码)
LeetCode刷题