当前位置:网站首页>Prediction of COVID-19 by RNN network
Prediction of COVID-19 by RNN network
2022-06-12 08:07:00 【HNU_ Liu Yuan】
Catalog
Global epidemic visualization :
Dataset sequence data generation :
Forecast daily new cases in the United States
Daily new and cumulative Infection Prediction difficulty comparison
summary :
This experiment deals with the new crown data from Hopkinson University , Visualize new cases in various countries , And use LSTM、GRUNet The time series prediction model is used to train and fit the data , The influence of different sequence length on network prediction is discussed , And predict the daily new cases in the United States , To predict the cumulative confirmed cases in China , Take Russia as an example to analyze the prediction difficulty of daily new and accumulated confirmed cases , And analyze the results .
To analyze problems :
The new coronavirus is spreading all over the world , The number of new infections per day in the United States is approaching 100 ten thousand people , from 19 Since then , The momentum of the new crown has not decreased , Can reasonably 、 Correctly predict the trend of novel coronavirus , For arranging the resumption of production 、 life , It is of great significance and value .
The daily new cases belong to time series data , The number of new cases per day is not only related to the infectivity of the virus , And the population of the region 、 National epidemic prevention measures 、 Vaccination status 、 The type of virus, etc . So it is a very complicated problem , For simplicity , Just think of it as time series data , Since no case data of different kinds of novel coronavirus can be found , So treat them as the same virus , Use the typical RNN A series of networks are used to predict and solve .
Methods to introduce :
RNN The Internet :
A recurrent neural network is a neural network that changes over time , Recurring structures . In natural language processing (NLP), Voice and image are widely used in many fields .RNN The biggest difference between network and other networks is RNN Can achieve some kind of “ Memory function ”, It is the best choice for time series analysis . Just as human beings can better understand the world with their past memories .RNN It also realizes this mechanism similar to the human brain , Retain a certain memory of the processed information , Unlike other types of memory, neural networks cannot retain information .
The recurrent neural network uses neurons with self feedback , Can handle any length of time ordinal numbers . Given an input sequence x1:T=x1,x2,…,xt,…,xT, The recurrent neural network updates the active value of the hidden layer with feedback edge by the following formula ht
ht=fht-1,xt

Cyclic neural network
LSTM:
Long Short Term The Internet , It's usually called LSTM —— It's a kind of RNN Special type , You can learn to rely on information for a long time .LSTM from Hochreiter & Schmidhuber (1997) Put forward , And was recently Alex Graves It has been improved and popularized . On a lot of questions ,LSTM They have been very successful , And has been widely used .
LSTM Avoid long-term dependency problems through deliberate design . Remember that long-term information in practice is LSTM Default behavior of , Rather than the ability to pay a lot of money to acquire .
Compared with ordinary RNN,LSTM Be able to perform better in longer sequences . In primitive RNN On the basis of ,LSTM The network is mainly improved in the following two aspects :
The new internal state .LSTM The network introduces a new internal state ct∈RD Specifically for linear circular information transfer , meanwhile ( Nonlinearly ) Output information to the external state of the hidden layer ht∈RD, Internal state ct Calculate by the following formula :
ct=ft⊙ct-1+it⊙ct#2
ht=ot⊙tanhct#3
among ft∈[0,1]D、it∈[0,1]D and ot∈[0,1]D Control the path of information transmission for three gates ;⊙ Is the product of vector elements ;ct-1 For the memory unit of the last moment ;ct∈RD Is a candidate state obtained by a nonlinear function :
ct=tanhWcxt+Ucht-1+bc#4
At every moment 𝑡,LSTM Internal state of network ct Records historical information up to the current moment .
The gating mechanism . In digital circuits , The gate is a binary variable {0, 1},0 Represents the closed state , No information is allowed through ;1 Represents an open state , Allow all information to pass through .
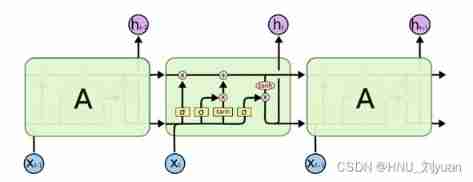
LSTM Cyclic cell structure of network
GRU:
GRU yes LSTM A good variety of network , It is better than LSTM The structure of the network is simpler , And the effect is very good , Therefore, it is also a very popular network .GRU Since it is LSTM A variation of the , So it can be solved RNN The problem of long dependence in the network .GRU and LSTM In many cases, the actual performance is almost the same , But it's easier to calculate .GRU The structure of input and output is the same as that of ordinary RNN be similar , The internal thoughts and LSTM be similar . And LSTM comparison ,GRU One is missing from the inside “ gating ”, Parameter ratio LSTM Less , But it can also reach the goal of LSTM Quite a function .
among h' The updated formula is as follows :
ht=1-z*ht-1+z*h'

GRU structure
New crown data :
The data set comes from GitHub According to the statistics of Hopkinson University in the United States, the number of new coronal infections in the world , Links are as follows :COVID-19/csse_covid_19_data at master · CSSEGISandData/COVID-19 · GitHub
By visualizing the daily new data of several countries :


In some countries and regions, the number of people newly diagnosed in a single day
The blue line is the number of new people per day , The red line is the smoothed value . It can be seen that , The daily new data is volatile , Not so smooth , And there may be several peaks . For most countries , stay 2021 At the end of the year, the number of newly diagnosed patients has increased significantly , Presumably, it is due to the influence of the mutated virus Omicron , The infection rate is higher .
Global epidemic visualization :
Use pyecharts The database visualizes the global epidemic situation to get :

Global epidemic visualization
Look at the map , Almost all countries have been affected by the epidemic , The United States has the largest number of confirmed cases , Brazil 、 Russia and India , The number of confirmed cases was second , Also more serious . A few countries have no statistics , So it's blank .
The experimental model :
Two models are used for prediction , namely LSTM and GRUNet, Contrast :
LSTM:
- class LSTMNet(nn.Module):
- def __init__(self, input_size = 1):
- super(LSTMNet, self).__init__()
- self.rnn = nn.LSTM(
- input_size=input_size,
- hidden_size=64,
- num_layers=1,
- batch_first=True,
- )
- self.out = nn.Sequential(
- nn.Linear(64, 1)
- )
- self.relu = nn.ReLU()
- def forward(self, x):
- r_out, (h_n, h_c) = self.rnn(x.view(len(x), seq_length, -1), None)
- out = self.out(r_out[:, -1])
- out = self.relu(out)
- return out
GRUNet:
- class GRUNet(nn.Module):
- def __init__(self, input_size = 1):
- super(GRUNet, self).__init__()
- self.rnn = nn.GRU(
- input_size=input_size,
- hidden_size=64,
- num_layers=1,
- batch_first=True,
- bidirectional=True
- )
- self.out = nn.Sequential(
- nn.Linear(128, 1)
- )
- self.avgpool = nn.AdaptiveAvgPool2d((1,128))
- def forward(self, x):
- r_out, (h_n, h_c) = self.rnn(x, None)
- out = self.avgpool(r_out.unsqueeze(0))
- out = out.squeeze(2).squeeze(0)
- out = self.out(out)
- return out
LSTM Generally, it is used to predict the sequence data , The data set is divided into training data and test data according to a certain proportion , Send in LSTM The data has a fixed length , namely seq_length, according to seq_length Unit length data , Predict the next data . First, the training data should be divided into training data and labels , Use the following functions to partition :
- def create_sequences(data, seq_length):
- xs = []
- ys = []
- for i in range(len(data)-seq_length-1):
- x = data[i:(i+seq_length)]
- y = data[i+seq_length]
- xs.append(x)
- ys.append(y)
return np.array(xs), np.array(ys)
Dataset sequence data generation :
If seq_length by 5, The training data is [1,2,3,4,5,6,7,8,9] when , The following training data division can be obtained :
Schematic diagram of training set sequence data generation
Training data | Forecast data | ||||
1 | 2 | 3 | 4 | 5 | 6 |
2 | 3 | 4 | 5 | 6 | 7 |
3 | 4 | 5 | 6 | 7 | 8 |
4 | 5 | 6 | 7 | 8 | 9 |
Generally speaking , When seq_length The bigger it is , The greater the computational complexity , At the same time, the prediction accuracy will be higher .
Make your own 1-1000 Linetype data for , As a test , Divide the data of different proportions into training set and test set , To explore the seq_length Influence on fitting data . The scale of the fixed test set is 0.3, When seq_length by 5 when , That is to use 5 One data predicts the next , The predicted data is used as input to predict the next data . obtain :

Seq_length=5, Fit the line
Normalize it and calculate the square difference of the real data , Error evaluation value :0.565. As you can see from the diagram , The forecast data has a downward trend in the second half .
When seq_length by 15 when , That is to use 15 One data predicts the next , The predicted data is used as input to predict the next data . obtain :
 Seq_length=15, Fit the line
It is also normalized and the square difference of the real data is calculated , Error evaluation value :0.105. As you can see from the diagram , and seq_length by 5 When compared with , The prediction effect is much better , But there is also a downward trend .
Use the daily new data in the original data as the training set ( It may be easier to predict the total number of patients ), Use GRUNet Train to get :
Use GRUNet Predict the original data
You can see that the jitter of the original data is very large , Not conducive to prediction , So the length used is 5 The sequence of “ Mean filtering ” Handle , The processed data is slightly smoothed , The predicted results are as follows :

Use GRUNet Predict the smoothed data
What makes people very surprised is , The model can actually predict the arrival of the next wave peak , Although there are some deviations .
Then change the network to LSTM, The prediction sequence length is 30, After training, the predicted results are as follows :

Use LSTM Predict the smoothed data
As can be seen from the result graph , Forecast trends and GRUNet There's a big difference , according to LSTM The prediction given , In the later stage, there should be no new cases , This trend is also more in line with the intuitive feeling of the change trend on the left , But there was a small peak in the later period . Different types of networks , The prediction of epidemic situation varies greatly .
Forecast daily new cases in the United States
Visualize the daily new data in the United States to get :
Visualization of new cases in a single day in the United States
The number of new confirmed cases per day in the United States was before 20 About ten thousand floating , But here we are 21 end of the year , The number of confirmed cases surged , Guess it should be the effect of virus mutation , Novel coronavirus mutated to produce a highly infectious beta virus , Recently, there has been Omicron , Omicron brought the number of new people to the United States in a single day 100 All around , The number of infections has increased by four 、 Five times as much . It can be seen that the infection ability of the mutant virus is strong .
LSTM Make predictions about the United States :
Use of data for us models LSTM Training 1500 individual epoch, The initial learning rate is 1e-3, The learning rate adjustment strategy is cosine attenuation , The loss function is set to MSE, During the training lr attenuation 、loss The change diagram and prediction diagram are shown in the following figure :
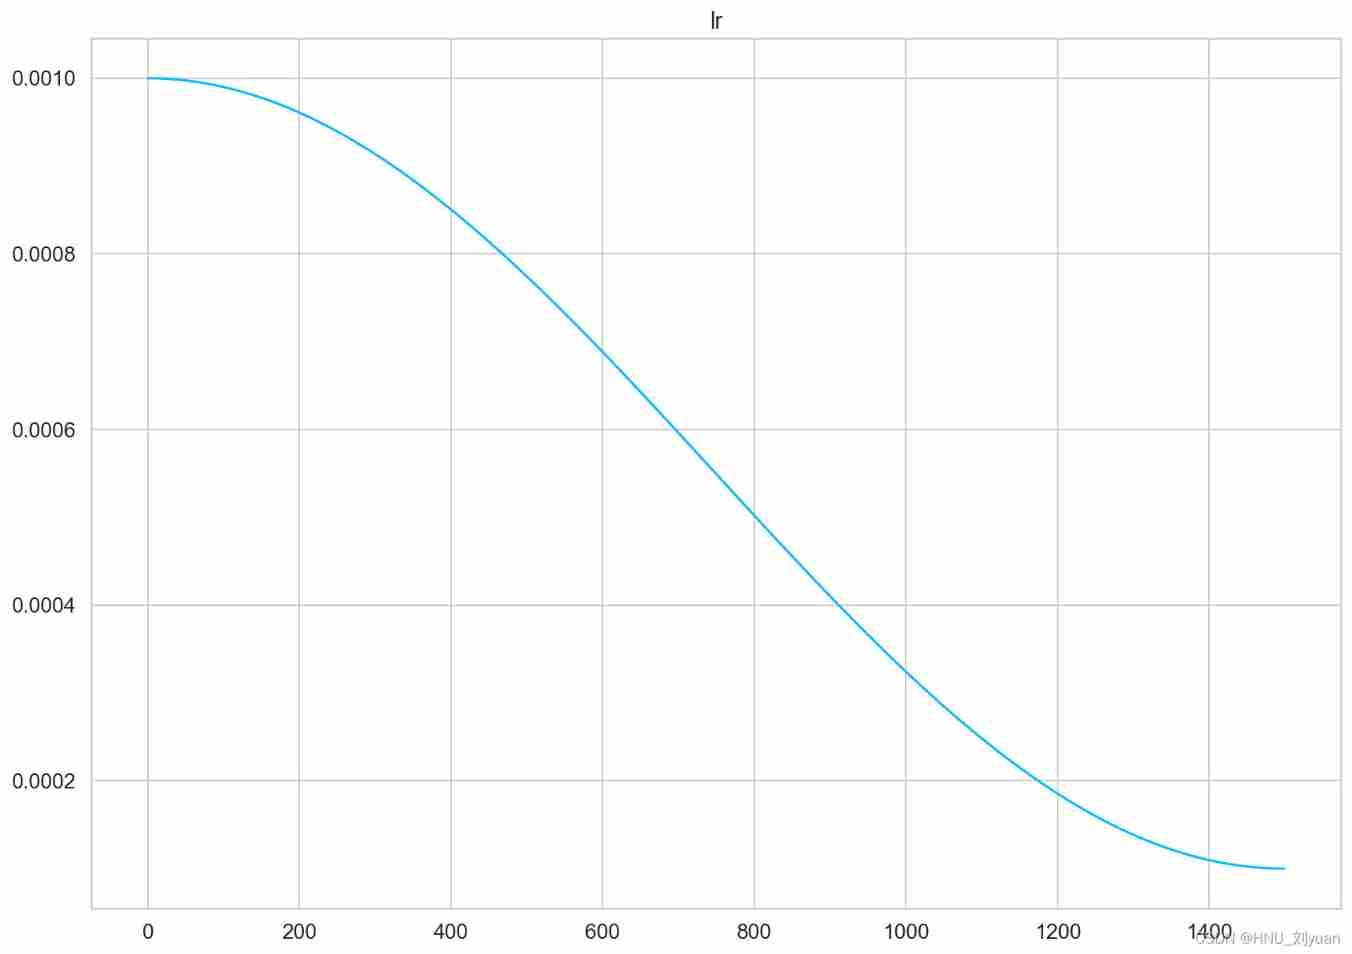
Changes in learning rates

Use LSTM During training in the United States loss The change of
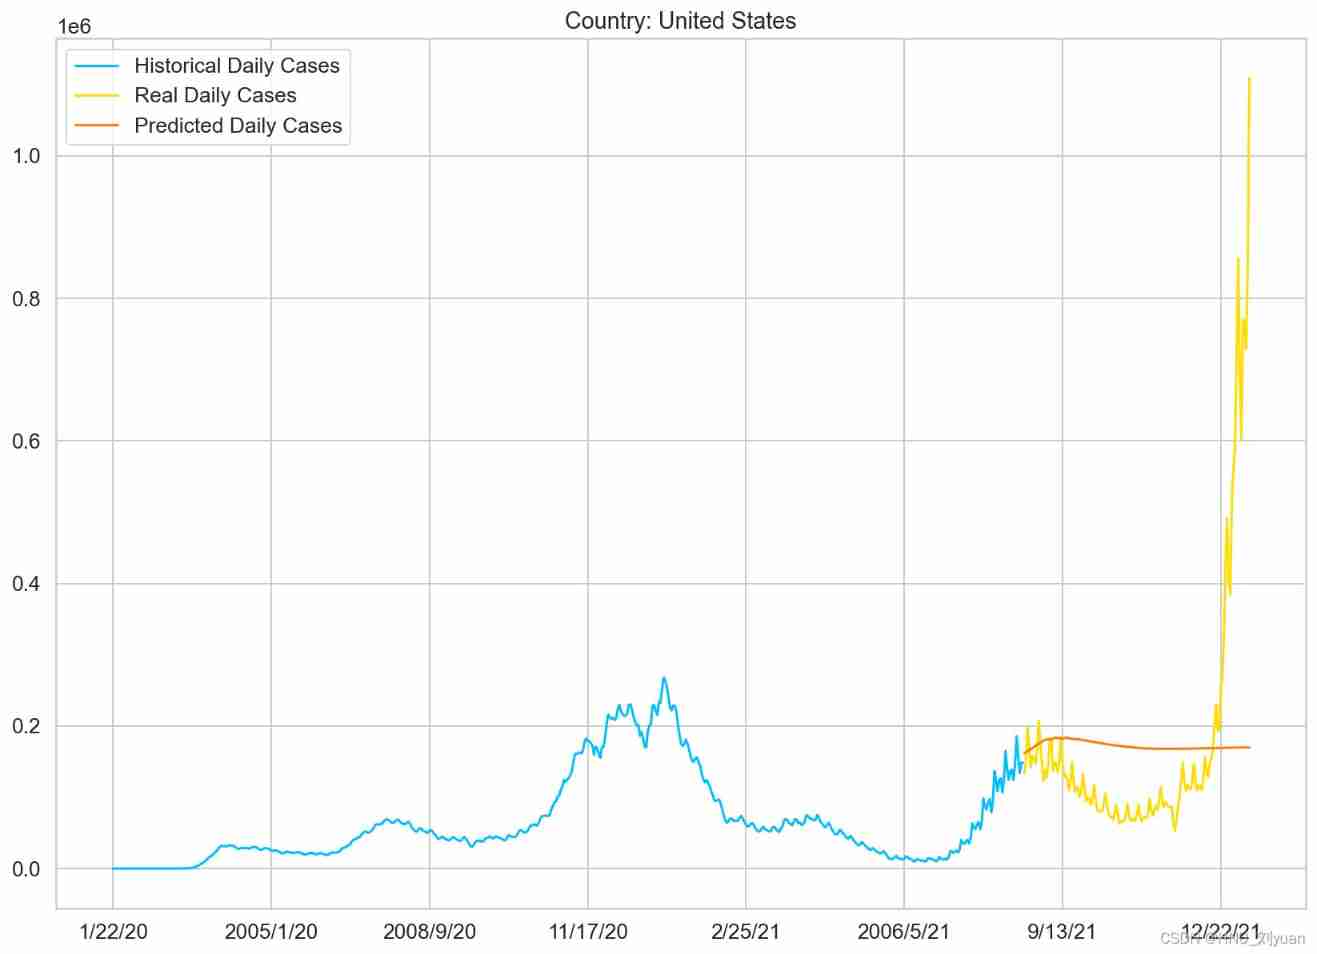
Use LSTM The prediction of new outbreaks in the United States every day
GRUNet Make predictions about the United States :
Use the same workout settings to train GRUNet obtain :

Use GRUNet During training in the United States loss The change of

Use GRUNet The prediction of new outbreaks in the United States every day
It can be seen from the forecast results that the model can not well predict the number of new people in a single day in the United States in the future , Because the virus is mutating , The back is more contagious , This information cannot be inferred from the previous sequence data , So the United States did not fight the epidemic well , Let the virus develop , Plus the mutation of the virus , Therefore, neither of the two models can well predict the future trend .
Daily new and cumulative Infection Prediction difficulty comparison
Take Russia , Two models are used to predict the daily number of new cases and the cumulative number of new cases , obtain :


Use LSTM、GRUNet Prediction of the cumulative number of infections in Russia


Use LSTM、GRUNet Prediction of the number of new infections per day in Russia
As you can see from the diagram , The prediction error for the number of new infections per day is greater than that for the cumulative number of confirmed infections , So in terms of prediction difficulty , It is difficult to predict the number of new people per day , The number of new arrivals per day fluctuates , It may increase or decrease , Prediction of the cumulative number of confirmed cases , It can be obtained by fitting based on the previous data trend .
summary
Sequence data is very common in daily life , Such as the stock 、 The temperature 、 Humidity, etc , Can accurately predict , It plays a very important role in production and life . This use LSTM、GRUNet To predict the number of infected people in COVID-19 , Make me understand and master RNN Related principles and applications . Judging from the prediction results , Some prediction results are not satisfactory , But some are less effective , More factors may need to be taken into account . The following implications can be drawn from the prediction results : It is simpler to predict the cumulative number of infections than to predict the daily number of new infections ; The longer the forecast results , The less accurate the later ; The longer the prediction sequence is used, the more accurate the result is ; Recent viral mutations have led to a surge in the number of infections that models cannot predict ; And correct anti epidemic measures are very important .
If you need code , Please leave a message .
边栏推荐
- 20220524 backbone deep learning network framework
- Fundamentals of Mathematics - Taylor Theorem
- N-order nonzero matrix AB, matrix ab=0, then the rank of a and B is less than n
- 2021.10.26 scientific research log
- [redistemplate method details]
- Topic 1 Single_ Cell_ analysis(3)
- Uni app screenshot with canvas and share friends
- Xiaomi mobile phone recording data set software operation
- Cmake can't find the solution of sophus
- Compiling principle on computer -- functional drawing language (V): compiler and interpreter
猜你喜欢

模型压缩 | TIP 2022 - 蒸馏位置自适应:Spot-adaptive Knowledge Distillation

从AC5到AC6转型之路(1)——补救和准备

Vision Transformer | CVPR 2022 - Vision Transformer with Deformable Attention
20220526 yolov1-v5

Talk about the four basic concepts of database system

Vision Transformer | Arxiv 2205 - LiTv2: Fast Vision Transformers with HiLo Attention

离散 第一章

PPP agreement

Meter Reading Instrument(MRI) Remote Terminal Unit electric gas water

Cookies and sessions
随机推荐
Process terminated
Parameter estimation of Weibull distribution
Literature reading: raise a child in large language model: rewards effective and generalizable fine tuning
Procedure execution failed 1449 exception
Derivation of Poisson distribution
EasyExcel导出Excel表格到浏览器,并通过Postman测试导出Excel【入门案例】
Search and rescue strategy of underwater robot (FISH)
电脑连接上WiFi但是上不了网
Meter Reading Instrument(MRI) Remote Terminal Unit electric gas water
The Poisson regression model (posion) is constructed by GLM function of R language, and the poisgof function of epidisplay package is used to test the goodness of fit of the fitted Poisson regression
2021.10.31-11.1 scientific research log
『Three.js』辅助坐标轴
OpenMP task 原理與實例
How to standardize the creation of a pytorch project
Record the treading pit of grain Mall (I)
R language uses the sum function of epidisplay package to calculate the descriptive statistical summary information of the specified variables in dataframe under different grouping variables, visualiz
Interview questions on mobile terminal, Android and IOS compatibility
2.2 链表---设计链表(Leetcode 707)
AJ project: online bank project summary
Symfony 2: multiple and dynamic database connections