当前位置:网站首页>Seriation in R: How to Optimally Order Objects in a Data Matrice
Seriation in R: How to Optimally Order Objects in a Data Matrice
2022-07-02 09:38:00 【小宇2022】
library(seriation)
# Load the data
data("iris")
df <- iris
head(df, 2)
# Remove the column `species` (column 5)
df <- df[, -5]
# Reorder the objects randomly
set.seed(123)
df <- df[sample(seq_len(nrow(df))),]
head(df, 2)
# Compute dissimilarity matrix
dist_result <- dist(df)
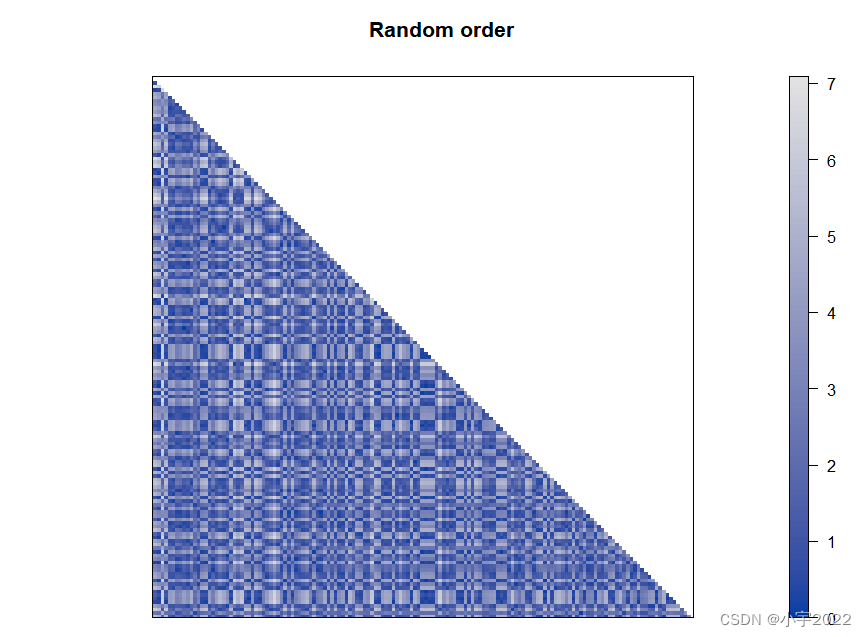
# Seriate objects, reorder rows based on their similarity
object_order <- seriate(dist_result)
# Extract object orders
head(get_order(object_order), 15)
pimage(dist_result, main = "Random order")
library(seriation)
# Load the data
data("iris")
df <- iris
head(df, 2)
# Remove the column `species` (column 5)
df <- df[, -5]
# Reorder the objects randomly
set.seed(123)
df <- df[sample(seq_len(nrow(df))),]
head(df, 2)
# Compute dissimilarity matrix
dist_result <- dist(df)
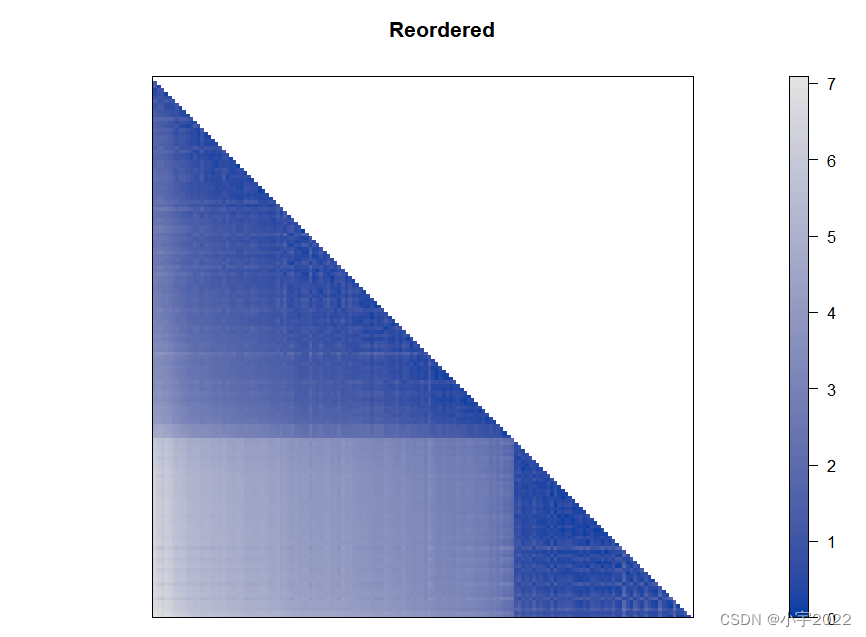
# Seriate objects, reorder rows based on their similarity
object_order <- seriate(dist_result)
# Extract object orders
head(get_order(object_order), 15)
pimage(dist_result, order = object_order, main = "Reordered")
library(seriation)
# Data preparation
# Load the dataset
data("USArrests")
# Replace original values by their ranks
df <- head(apply(USArrests, 2, rank), 30)
# Perform seriation on row and columns
row_order <- seriate(dist(df, "minkowski", p = 1), method ="TSP")
col_order <- seriate(dist(t(df), "minkowski", p = 1), method ="TSP")
orders <- c(row_order, col_order)
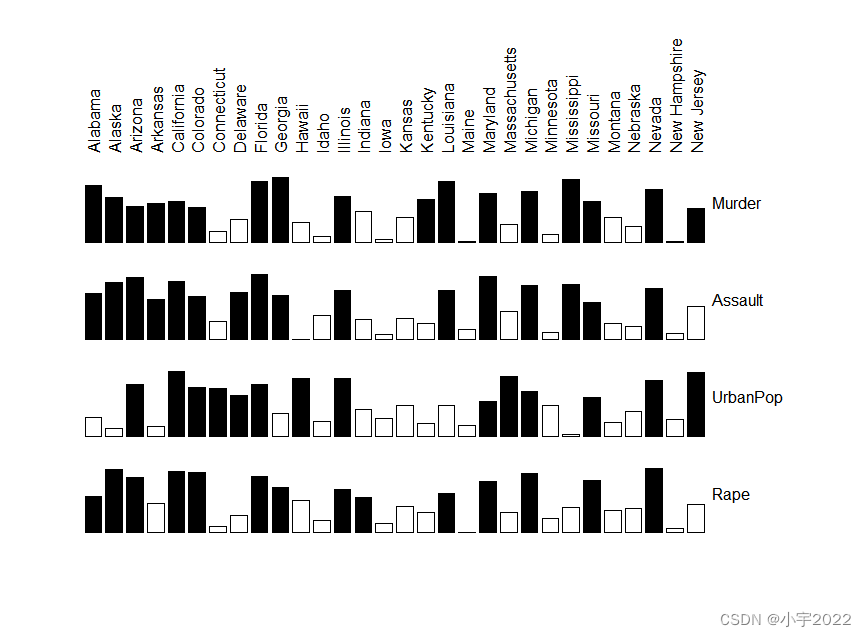
# Visualization: matrix of bars
# Original matrix
bertinplot(df)
library(seriation)
# Data preparation
# Load the dataset
data("USArrests")
# Replace original values by their ranks
df <- head(apply(USArrests, 2, rank), 30)

# Perform seriation on row and columns
row_order <- seriate(dist(df, "minkowski", p = 1),  method ="TSP")
col_order <- seriate(dist(t(df), "minkowski", p = 1),  method ="TSP")
orders <- c(row_order, col_order)

# Visualization: matrix of bars
# Original matrix
bertinplot(df, orders)

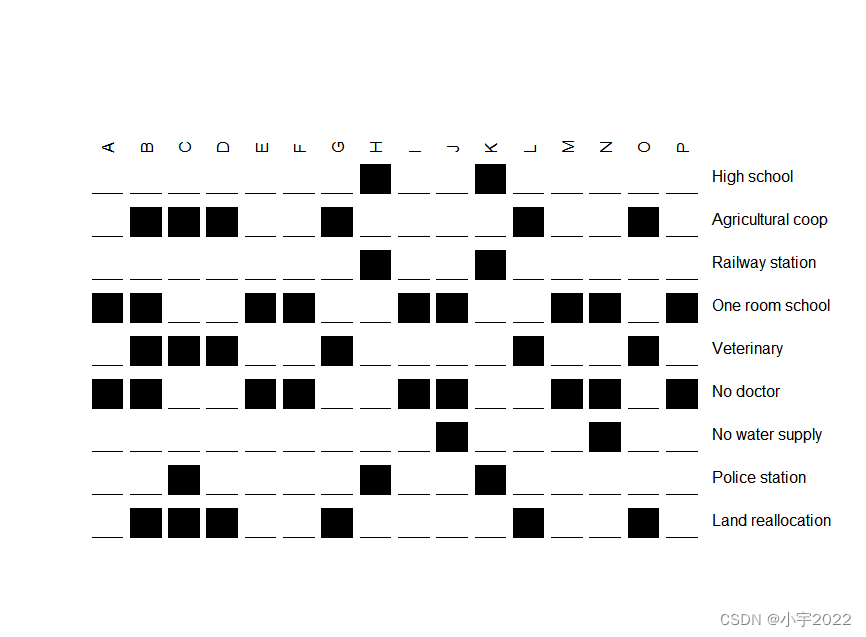
library(seriation)
# Load demo data
data("Townships")
# Visualize the original data
bertinplot(
  Townships,
  options = list(panel = panel.circles)
)
library(seriation)
# Load demo data
data("Townships")
# Seriate rows and columns using the bond energy algorithm (BEA)
set.seed(1234)
orders <- seriate(Townships, method = "BEA", control = list(rep = 10))
bertinplot(
  Townships, order = orders,
  options = list(panel = panel.circles)
)

边栏推荐
- Homer预测motif
- bedtools使用教程
- Win11 arm system configuration Net core environment variable
- Is it safe to open a stock account online? I'm a novice, please guide me
- 基于Hardhat编写合约测试用例
- 6方面带你认识LED软膜屏 LED软膜屏尺寸|价格|安装|应用
- 电脑无缘无故黑屏,无法调节亮度。
- mysql链表数据存储查询排序问题
- I STM32 development environment, keil5/mdk5.14 installation tutorial (with download link)
- Redis超出最大内存错误OOM command not allowed when used memory &gt; 'maxmemory'
猜你喜欢
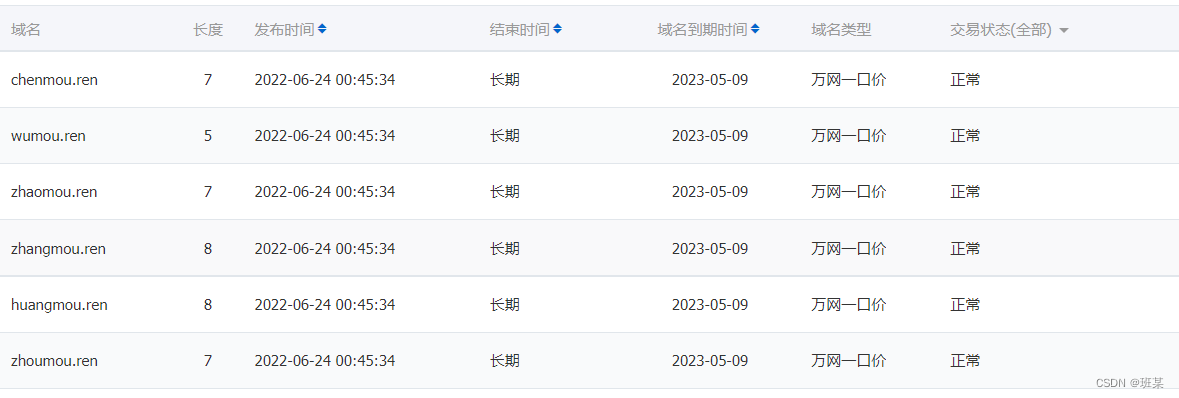
Is the Ren domain name valuable? Is it worth investing? What is the application scope of Ren domain name?
enumrate的start属性的坑

八大排序汇总

PowerBI中导出数据方法汇总

MTK full dump抓取

MySQL比较运算符IN问题求解
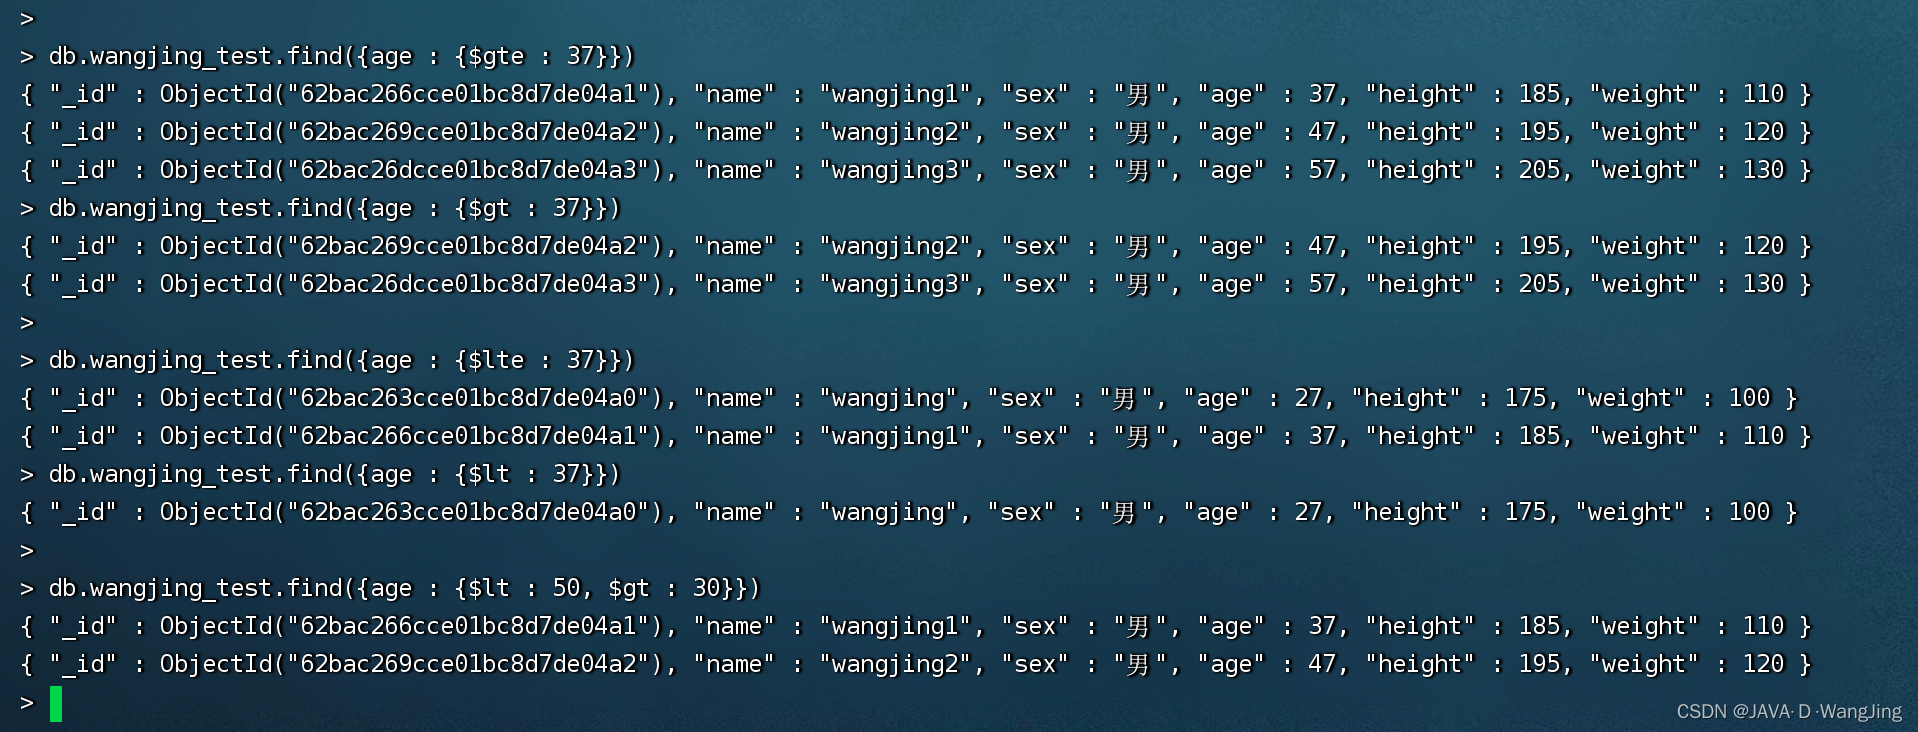
Mongodb learning and sorting (condition operator, $type operator, limit() method, skip() method and sort() method)
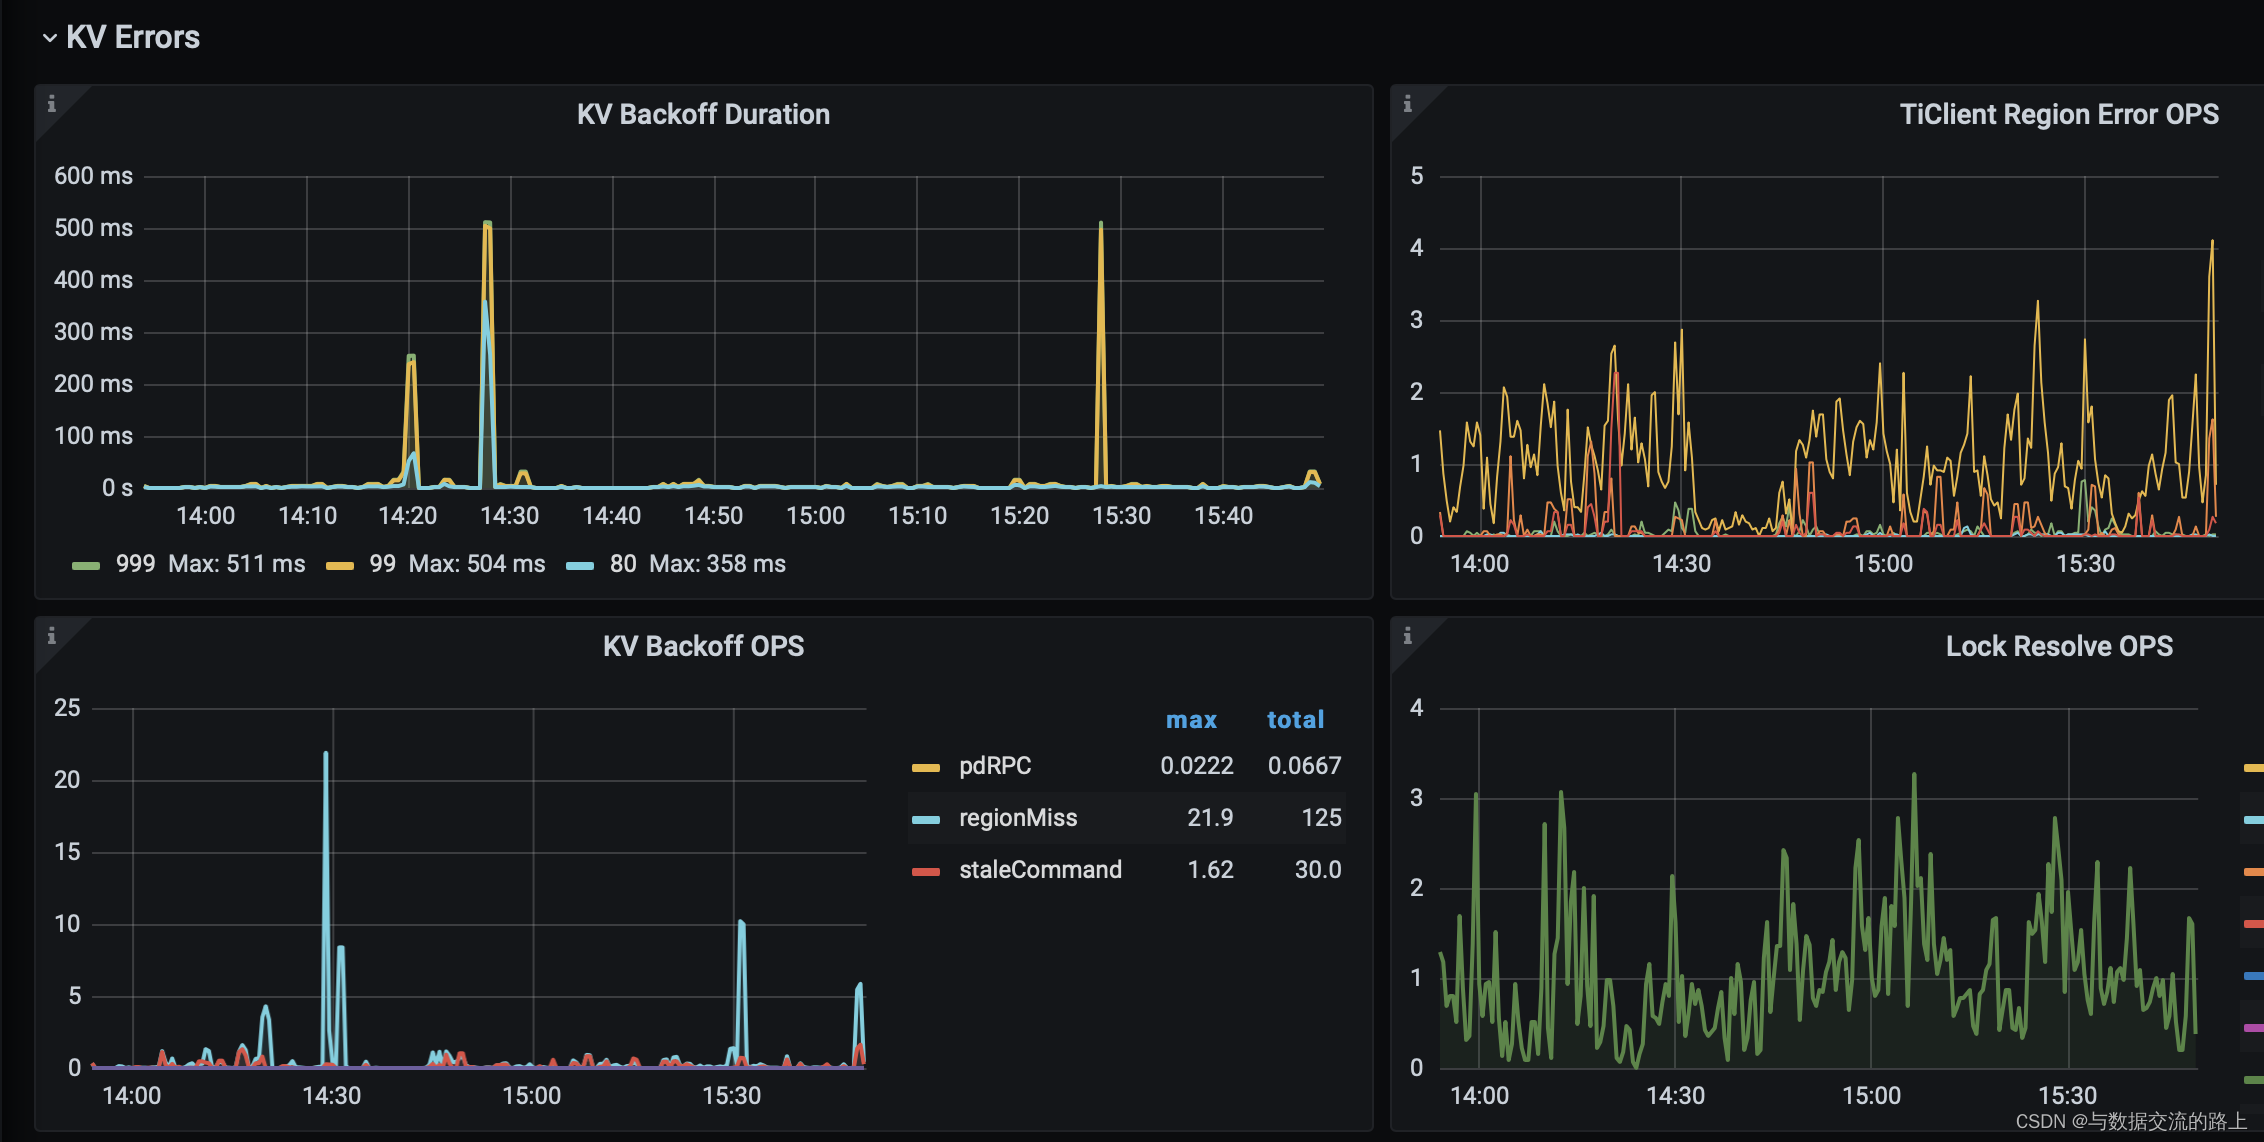
Tidb DM alarm DM_ sync_ process_ exists_ with_ Error troubleshooting

Develop scalable contracts based on hardhat and openzeppelin (II)

Internship report skywalking distributed link tracking?
随机推荐
Redis超出最大内存错误OOM command not allowed when used memory &gt; 'maxmemory'
原生方法合并word
预言机链上链下调研
webauthn——官方开发文档
可昇級合約的原理-DelegateCall
MySQL comparison operator in problem solving
Verilog and VHDL signed and unsigned number correlation operations
Webauthn - official development document
Eight sorting summaries
js中给数组添加元素的方法有哪些
对毕业季即将踏入职场的年轻人的一点建议
Homer forecast motif
Tick Data and Resampling
Some suggestions for young people who are about to enter the workplace in the graduation season
程序员成长第六篇:如何选择公司?
由粒子加速器产生的反中子形成的白洞
ESP32音频框架 ESP-ADF 添加按键外设流程代码跟踪
Multi line display and single line display of tqdm
TIPC Service and Topology Tracking4
Is the stock account given by qiniu business school safe? Can I open an account?