当前位置:网站首页>Visualization of chip SEQ data by deeptools
Visualization of chip SEQ data by deeptools
2022-07-02 11:36:00 【qq_ twenty-seven million three hundred and ninety thousand and 】
deepTools: tools for exploring deep sequencing data
deepTools It's a set python Tools , Especially developed for efficient analysis of high-throughput sequencing data , Such as ChIP-seq、RNA-seq or MNase-seq.
##  Before and after calculating transcription start sites 1K Of peaks Distribution situation , It can be processed in parallel , Speed up
computeMatrix reference-point -p 2 --referencePoint TSS -b 1000 -a 1000 -R UCSC_GRCH38_refGene.bed -S chip_coverage.bw control_coverage.bw --skipZeros  -out ./TSS.computeMatrix.gz --outFileSortedRegions ./test.genes.bed

#  notes :chip_coverage.bw control_coverage.bw   come from Macs2 result
plotHeatmap -m TSS.computeMatrix.gz -o heatmap_TSS.pdf --zMin 0 --zMax 8 --colorMap coolwarm --missingDataColor 1

# -o (-out)  The output file , It can be  ".png", ".eps", ".pdf" and ".svg"

computeMatrix scale-regions -p 2 -S chip_coverage.bw control_coverage.bw -R UCSC_GRCH38_refGene.bed -a 1000 -b 1000 -o gene_region.computeMatrix.gz

plotHeatmap -m gene_region.computeMatrix.gz -o heatmap_gene_region.pdf --zMin 0 --zMax 8 --colorMap coolwarm --missingDataColor 1

# Parameter description :-m Input matrix ;-o Output pdf file ;-zMin 0 --zMax 8 Are the maximum and minimum values of the heat map ;--colorMap It's a choice # Choose the heat map color type (RdBu, coolwarm  etc. , See the help document for details ). Made pdf The heat map can be directly displayed in Ai Editor .

##  Drawing only  profile
plotProfile -m TSS.computeMatrix.gz -out TSSProfile.png --numPlotsPerRow 2 --plotTitle "TSS data profile"
#  Set up profile style
plotProfile -m TSS.computeMatrix.gz -out ExampleProfile2.png --plotType=fill --perGroup --colors red yellow blue --plotTitle "Test data profile"

##  Drawing only heatmap
plotHeatmap -m TSS.computeMatrix.gz -out TSSHeatmap.png --colorMap RdBu --whatToShow 'heatmap and colorbar' --zMin -3 --zMax 3 --kmeans 4

##  Draw at the same time profile and heatmap
plotHeatmap -m TSS.computeMatrix.gz -o heatmap_profile.pdf --zMin 0 --zMax 8 --colorMap coolwarm --missingDataColor 1 --kmeans 4

###  Parameters  --kmeans  Number of clusters
Reference resources :
http://deeptools.readthedocs.org/en/latest/content/example_gallery.html#normalized-chip-seq-signals-and-peak-regions
https://deeptools.readthedocs.io/en/develop/content/tools/computeMatrix.html
边栏推荐
- SQLite modify column type
- 预言机链上链下调研
- Skills of PLC recorder in quickly monitoring multiple PLC bits
- 微信小程序利用百度api达成植物识别
- Astparser parsing class files with enum enumeration methods
- Programmer growth Chapter 6: how to choose a company?
- PLC-Recorder快速监控多个PLC位的技巧
- mysql链表数据存储查询排序问题
- Is the Ren domain name valuable? Is it worth investing? What is the application scope of Ren domain name?
- 三.芯片啟動和時鐘系統
猜你喜欢

RPA advanced (II) uipath application practice

C#多维数组的属性获取方法及操作注意

Never forget, there will be echoes | hanging mirror sincerely invites you to participate in the opensca user award research
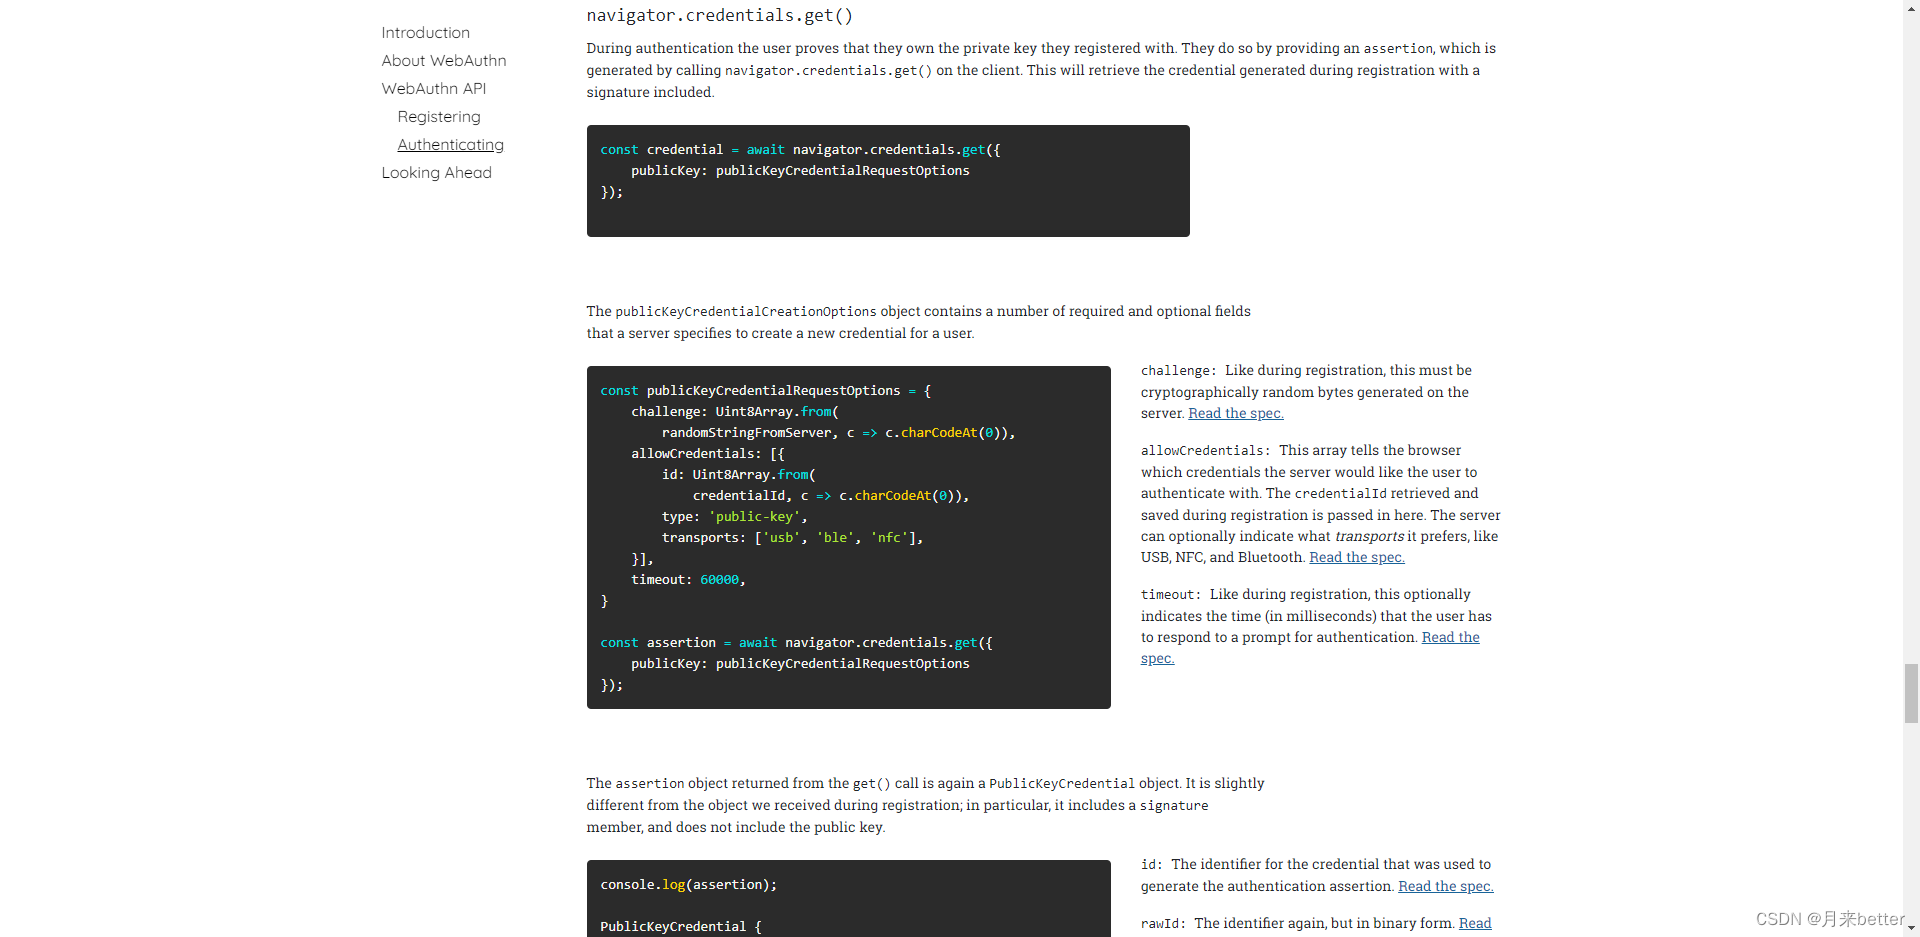
Webauthn - official development document

2022年4月17日五心红娘团队收获双份喜报
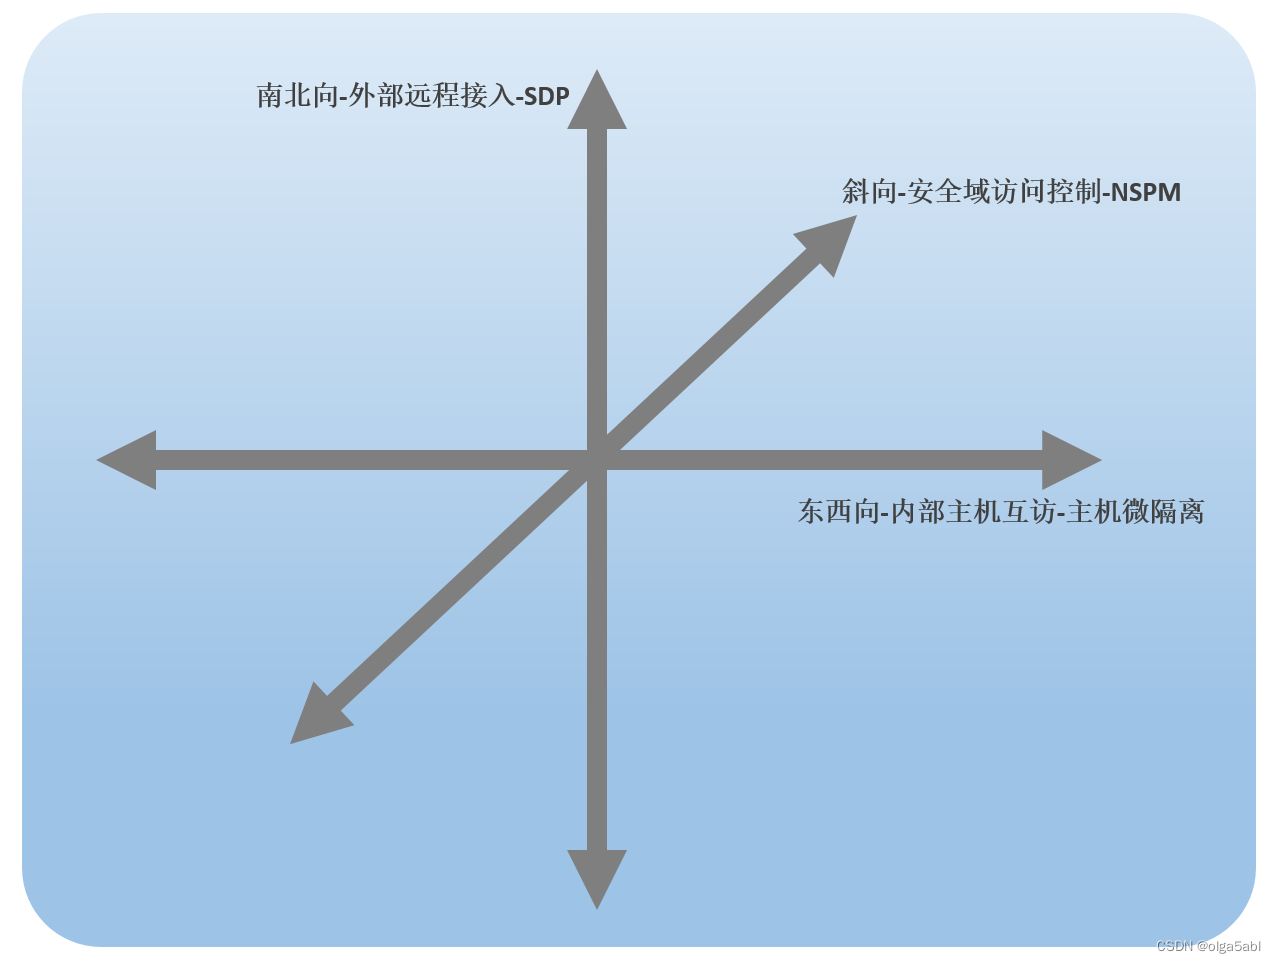
From the perspective of attack surface, see the practice of zero trust scheme of Xinchuang
念念不忘,必有回响 | 悬镜诚邀您参与OpenSCA用户有奖调研

解决uniapp列表快速滑动页面数据空白问题

制造业数字化转型和精益生产什么关系

Amazon cloud technology community builder application window opens
随机推荐
预言机链上链下调研
Homer forecast motif
Regular and common formulas
函数式接口和方法引用
MTK full dump grab
制造业数字化转型和精益生产什么关系
TIPC Getting Started6
Is bond fund safe? Does the bond buying foundation lose principal?
deepTools对ChIP-seq数据可视化
TIPC protocol
Liftover for genome coordinate conversion
map集合赋值到数据库
Basic usage of MySQL in centos8
ESP32存储配网信息+LED显示配网状态+按键清除配网信息(附源码)
Writing contract test cases based on hardhat
PYQT5+openCV项目实战:微循环仪图片、视频记录和人工对比软件(附源码)
Never forget, there will be echoes | hanging mirror sincerely invites you to participate in the opensca user award research
What are the methods of adding elements to arrays in JS
Webauthn - official development document
TIPC messaging3