当前位置:网站首页>机器学习之支持向量机实例,线性核函数 多项式核函数 RBF高斯核函数 sigmoid核函数
机器学习之支持向量机实例,线性核函数 多项式核函数 RBF高斯核函数 sigmoid核函数
2022-08-04 18:41:00 【51CTO】
支持向量机实例
1.线性核函数
       def

       test_SVC_linear():


       '''


        测试 SVC 的用法。这里使用的是最简单的线性核


        :param data: 可变参数。它是一个元组,这里要求其元素依次为训练样本集、测试样本集、训练样本的标记、测试样本的标记


        :return: None


        '''


       iris

       =

       datasets.

       load_iris()


       X_train,

       X_test,

       y_train,

       y_test

       =

       train_test_split(

       iris.

       data,

       iris.

       target,

       test_size

       =

       0.25,


       random_state

       =

       0,

       stratify

       =

       iris.

       target)


       cls

       =

       SVC(

       kernel

       =

       'linear')


       cls.

       fit(

       X_train,

       y_train)


       print(

       'Coefficients:%s, intercept %s'

       %(

       cls.

       coef_,

       cls.

       intercept_))


       print(

       'Score: %.2f'

       %

       cls.

       score(

       X_test,

       y_test))
- 1.
- 2.
- 3.
- 4.
- 5.
- 6.
- 7.
- 8.
- 9.
- 10.
- 11.
- 12.
- 13.
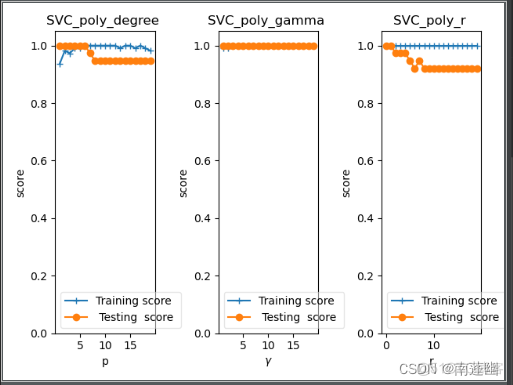
2.多项式核函数
       def

       test_SVC_poly():


       '''


        测试多项式核的 SVC 的预测性能随 degree、gamma、coef0 的影响.


        :param data: 可变参数。它是一个元组,这里要求其元素依次为训练样本集、测试样本集、训练样本的标记、测试样本的标记


        :return: None


        '''


       iris

       =

       datasets.

       load_iris()


       X_train,

       X_test,

       y_train,

       y_test

       =

       train_test_split(

       iris.

       data,

       iris.

       target,

       test_size

       =

       0.25,


       random_state

       =

       0,

       stratify

       =

       iris.

       target)


       fig

       =

       plt.

       figure()


       ### 测试 degree ####


       degrees

       =

       range(

       1,

       20)


       train_scores

       =[]


       test_scores

       =[]


       for

       degree

       in

       degrees:


       cls

       =

       SVC(

       kernel

       =

       'poly',

       degree

       =

       degree,

       gamma

       =

       'auto')


       cls.

       fit(

       X_train,

       y_train)


       train_scores.

       append(

       cls.

       score(

       X_train,

       y_train))


       test_scores.

       append(

       cls.

       score(

       X_test,

       y_test))


       ax

       =

       fig.

       add_subplot(

       1,

       3,

       1)

       # 一行三列


       ax.

       plot(

       degrees,

       train_scores,

       label

       =

       "Training score ",

       marker

       =

       '+' )


       ax.

       plot(

       degrees,

       test_scores,

       label

       =

       " Testing score ",

       marker

       =

       'o' )


       ax.

       set_title(

       "SVC_poly_degree ")


       ax.

       set_xlabel(

       "p")


       ax.

       set_ylabel(

       "score")


       ax.

       set_ylim(

       0,

       1.05)


       ax.

       legend(

       loc

       =

       "best",

       framealpha

       =

       0.5)


       ### 测试 gamma ,此时 degree 固定为 3####


       gammas

       =

       range(

       1,

       20)


       train_scores

       =[]


       test_scores

       =[]


       for

       gamma

       in

       gammas:


       cls

       =

       SVC(

       kernel

       =

       'poly',

       gamma

       =

       gamma,

       degree

       =

       3)


       cls.

       fit(

       X_train,

       y_train)


       train_scores.

       append(

       cls.

       score(

       X_train,

       y_train))


       test_scores.

       append(

       cls.

       score(

       X_test,

       y_test))


       ax

       =

       fig.

       add_subplot(

       1,

       3,

       2)


       ax.

       plot(

       gammas,

       train_scores,

       label

       =

       "Training score ",

       marker

       =

       '+' )


       ax.

       plot(

       gammas,

       test_scores,

       label

       =

       " Testing score ",

       marker

       =

       'o' )


       ax.

       set_title(

       "SVC_poly_gamma ")


       ax.

       set_xlabel(

       r"$\gamma$")


       ax.

       set_ylabel(

       "score")


       ax.

       set_ylim(

       0,

       1.05)


       ax.

       legend(

       loc

       =

       "best",

       framealpha

       =

       0.5)


       ### 测试 r ,此时 gamma固定为10 , degree 固定为 3######


       rs

       =

       range(

       0,

       20)


       train_scores

       =[]


       test_scores

       =[]


       for

       r

       in

       rs:


       cls

       =

       SVC(

       kernel

       =

       'poly',

       gamma

       =

       10,

       degree

       =

       3,

       coef0

       =

       r)


       cls.

       fit(

       X_train,

       y_train)


       train_scores.

       append(

       cls.

       score(

       X_train,

       y_train))


       test_scores.

       append(

       cls.

       score(

       X_test,

       y_test))


       ax

       =

       fig.

       add_subplot(

       1,

       3,

       3)


       ax.

       plot(

       rs,

       train_scores,

       label

       =

       "Training score ",

       marker

       =

       '+' )


       ax.

       plot(

       rs,

       test_scores,

       label

       =

       " Testing score ",

       marker

       =

       'o' )


       ax.

       set_title(

       "SVC_poly_r ")


       ax.

       set_xlabel(

       r"r")


       ax.

       set_ylabel(

       "score")


       ax.

       set_ylim(

       0,

       1.05)


       ax.

       legend(

       loc

       =

       "best",

       framealpha

       =

       0.5)


       plt.

       show()
- 1.
- 2.
- 3.
- 4.
- 5.
- 6.
- 7.
- 8.
- 9.
- 10.
- 11.
- 12.
- 13.
- 14.
- 15.
- 16.
- 17.
- 18.
- 19.
- 20.
- 21.
- 22.
- 23.
- 24.
- 25.
- 26.
- 27.
- 28.
- 29.
- 30.
- 31.
- 32.
- 33.
- 34.
- 35.
- 36.
- 37.
- 38.
- 39.
- 40.
- 41.
- 42.
- 43.
- 44.
- 45.
- 46.
- 47.
- 48.
- 49.
- 50.
- 51.
- 52.
- 53.
- 54.
- 55.
- 56.
- 57.
- 58.
- 59.
- 60.
- 61.
- 62.
- 63.
- 64.
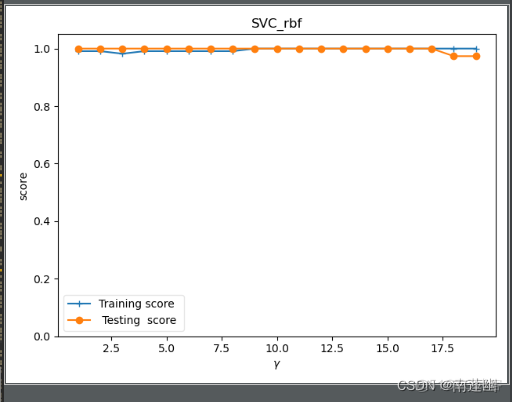
3.RBF高斯核函数
       ef

       test_SVC_rbf():


       '''


        测试 高斯核的 SVC 的预测性能随 gamma 参数的影响


        :param data: 可变参数。它是一个元组,这里要求其元素依次为训练样本集、测试样本集、训练样本的标记、测试样本的标记


        :return: None


        '''


       iris

       =

       datasets.

       load_iris()


       X_train,

       X_test,

       y_train,

       y_test

       =

       train_test_split(

       iris.

       data,

       iris.

       target,

       test_size

       =

       0.25,


       random_state

       =

       0,

       stratify

       =

       iris.

       target)


       gammas

       =

       range(

       1,

       20)


       train_scores

       =[]


       test_scores

       =[]


       for

       gamma

       in

       gammas:


       cls

       =

       SVC(

       kernel

       =

       'rbf',

       gamma

       =

       gamma)


       cls.

       fit(

       X_train,

       y_train)


       train_scores.

       append(

       cls.

       score(

       X_train,

       y_train))


       test_scores.

       append(

       cls.

       score(

       X_test,

       y_test))


       fig

       =

       plt.

       figure()


       ax

       =

       fig.

       add_subplot(

       1,

       1,

       1)


       ax.

       plot(

       gammas,

       train_scores,

       label

       =

       "Training score ",

       marker

       =

       '+' )


       ax.

       plot(

       gammas,

       test_scores,

       label

       =

       " Testing score ",

       marker

       =

       'o' )


       ax.

       set_title(

       "SVC_rbf")


       ax.

       set_xlabel(

       r"$\gamma$")


       ax.

       set_ylabel(

       "score")


       ax.

       set_ylim(

       0,

       1.05)


       ax.

       legend(

       loc

       =

       "best",

       framealpha

       =

       0.5)


       plt.

       show()
- 1.
- 2.
- 3.
- 4.
- 5.
- 6.
- 7.
- 8.
- 9.
- 10.
- 11.
- 12.
- 13.
- 14.
- 15.
- 16.
- 17.
- 18.
- 19.
- 20.
- 21.
- 22.
- 23.
- 24.
- 25.
- 26.
- 27.
- 28.
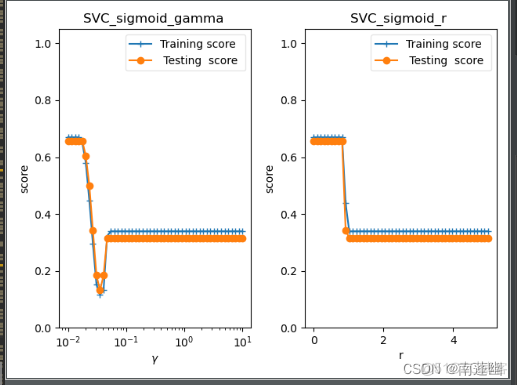
4.sigmoid核函数
       def

       test_SVC_sigmoid():


       '''


        测试 sigmoid 核的 SVC 的预测性能随 gamma、coef0 的影响.


        :param data: 可变参数。它是一个元组,这里要求其元素依次为训练样本集、测试样本集、训练样本的标记、测试样本的标记


        :return: None


        '''


       iris

       =

       datasets.

       load_iris()


       X_train,

       X_test,

       y_train,

       y_test

       =

       train_test_split(

       iris.

       data,

       iris.

       target,

       test_size

       =

       0.25,


       random_state

       =

       0,

       stratify

       =

       iris.

       target)


       fig

       =

       plt.

       figure()


       ### 测试 gamma ,固定 coef0 为 0 ####


       gammas

       =

       np.

       logspace(

       -

       2,

       1)


       train_scores

       =[]


       test_scores

       =[]


       for

       gamma

       in

       gammas:


       cls

       =

       SVC(

       kernel

       =

       'sigmoid',

       gamma

       =

       gamma,

       coef0

       =

       0)


       cls.

       fit(

       X_train,

       y_train)


       train_scores.

       append(

       cls.

       score(

       X_train,

       y_train))


       test_scores.

       append(

       cls.

       score(

       X_test,

       y_test))


       ax

       =

       fig.

       add_subplot(

       1,

       2,

       1)


       ax.

       plot(

       gammas,

       train_scores,

       label

       =

       "Training score ",

       marker

       =

       '+' )


       ax.

       plot(

       gammas,

       test_scores,

       label

       =

       " Testing score ",

       marker

       =

       'o' )


       ax.

       set_title(

       "SVC_sigmoid_gamma ")


       ax.

       set_xscale(

       "log")


       ax.

       set_xlabel(

       r"$\gamma$")


       ax.

       set_ylabel(

       "score")


       ax.

       set_ylim(

       0,

       1.05)


       ax.

       legend(

       loc

       =

       "best",

       framealpha

       =

       0.5)


       ### 测试 r,固定 gamma 为 0.01 ######


       rs

       =

       np.

       linspace(

       0,

       5)


       train_scores

       =[]


       test_scores

       =[]


       for

       r

       in

       rs:


       cls

       =

       SVC(

       kernel

       =

       'sigmoid',

       coef0

       =

       r,

       gamma

       =

       0.01)


       cls.

       fit(

       X_train,

       y_train)


       train_scores.

       append(

       cls.

       score(

       X_train,

       y_train))


       test_scores.

       append(

       cls.

       score(

       X_test,

       y_test))


       ax

       =

       fig.

       add_subplot(

       1,

       2,

       2)


       ax.

       plot(

       rs,

       train_scores,

       label

       =

       "Training score ",

       marker

       =

       '+' )


       ax.

       plot(

       rs,

       test_scores,

       label

       =

       " Testing score ",

       marker

       =

       'o' )


       ax.

       set_title(

       "SVC_sigmoid_r ")


       ax.

       set_xlabel(

       r"r")


       ax.

       set_ylabel(

       "score")


       ax.

       set_ylim(

       0,

       1.05)


       ax.

       legend(

       loc

       =

       "best",

       framealpha

       =

       0.5)


       plt.

       show()
- 1.
- 2.
- 3.
- 4.
- 5.
- 6.
- 7.
- 8.
- 9.
- 10.
- 11.
- 12.
- 13.
- 14.
- 15.
- 16.
- 17.
- 18.
- 19.
- 20.
- 21.
- 22.
- 23.
- 24.
- 25.
- 26.
- 27.
- 28.
- 29.
- 30.
- 31.
- 32.
- 33.
- 34.
- 35.
- 36.
- 37.
- 38.
- 39.
- 40.
- 41.
- 42.
- 43.
- 44.
- 45.
- 46.
- 47.
- 48.
- 49.
- 50.
代码:
import
numpy
as
np
from
sklearn
import
datasets
from
sklearn.
model_selection
import
train_test_split
from
sklearn.
svm
import
SVC
import
matplotlib.
pyplot
as
plt
def
test_SVC_linear():
'''
测试 SVC 的用法。这里使用的是最简单的线性核
:param data: 可变参数。它是一个元组,这里要求其元素依次为训练样本集、测试样本集、训练样本的标记、测试样本的标记
:return: None
'''
iris
=
datasets.
load_iris()
X_train,
X_test,
y_train,
y_test
=
train_test_split(
iris.
data,
iris.
target,
test_size
=
0.25,
random_state
=
0,
stratify
=
iris.
target)
cls
=
SVC(
kernel
=
'linear')
cls.
fit(
X_train,
y_train)
print(
'Coefficients:%s, intercept %s'
%(
cls.
coef_,
cls.
intercept_))
print(
'Score: %.2f'
%
cls.
score(
X_test,
y_test))
def
test_SVC_poly():
'''
测试多项式核的 SVC 的预测性能随 degree、gamma、coef0 的影响.
:param data: 可变参数。它是一个元组,这里要求其元素依次为训练样本集、测试样本集、训练样本的标记、测试样本的标记
:return: None
'''
iris
=
datasets.
load_iris()
X_train,
X_test,
y_train,
y_test
=
train_test_split(
iris.
data,
iris.
target,
test_size
=
0.25,
random_state
=
0,
stratify
=
iris.
target)
fig
=
plt.
figure()
### 测试 degree ####
degrees
=
range(
1,
20)
train_scores
=[]
test_scores
=[]
for
degree
in
degrees:
cls
=
SVC(
kernel
=
'poly',
degree
=
degree,
gamma
=
'auto')
cls.
fit(
X_train,
y_train)
train_scores.
append(
cls.
score(
X_train,
y_train))
test_scores.
append(
cls.
score(
X_test,
y_test))
ax
=
fig.
add_subplot(
1,
3,
1)
# 一行三列
ax.
plot(
degrees,
train_scores,
label
=
"Training score ",
marker
=
'+' )
ax.
plot(
degrees,
test_scores,
label
=
" Testing score ",
marker
=
'o' )
ax.
set_title(
"SVC_poly_degree ")
ax.
set_xlabel(
"p")
ax.
set_ylabel(
"score")
ax.
set_ylim(
0,
1.05)
ax.
legend(
loc
=
"best",
framealpha
=
0.5)
### 测试 gamma ,此时 degree 固定为 3####
gammas
=
range(
1,
20)
train_scores
=[]
test_scores
=[]
for
gamma
in
gammas:
cls
=
SVC(
kernel
=
'poly',
gamma
=
gamma,
degree
=
3)
cls.
fit(
X_train,
y_train)
train_scores.
append(
cls.
score(
X_train,
y_train))
test_scores.
append(
cls.
score(
X_test,
y_test))
ax
=
fig.
add_subplot(
1,
3,
2)
ax.
plot(
gammas,
train_scores,
label
=
"Training score ",
marker
=
'+' )
ax.
plot(
gammas,
test_scores,
label
=
" Testing score ",
marker
=
'o' )
ax.
set_title(
"SVC_poly_gamma ")
ax.
set_xlabel(
r"$\gamma$")
ax.
set_ylabel(
"score")
ax.
set_ylim(
0,
1.05)
ax.
legend(
loc
=
"best",
framealpha
=
0.5)
### 测试 r ,此时 gamma固定为10 , degree 固定为 3######
rs
=
range(
0,
20)
train_scores
=[]
test_scores
=[]
for
r
in
rs:
cls
=
SVC(
kernel
=
'poly',
gamma
=
10,
degree
=
3,
coef0
=
r)
cls.
fit(
X_train,
y_train)
train_scores.
append(
cls.
score(
X_train,
y_train))
test_scores.
append(
cls.
score(
X_test,
y_test))
ax
=
fig.
add_subplot(
1,
3,
3)
ax.
plot(
rs,
train_scores,
label
=
"Training score ",
marker
=
'+' )
ax.
plot(
rs,
test_scores,
label
=
" Testing score ",
marker
=
'o' )
ax.
set_title(
"SVC_poly_r ")
ax.
set_xlabel(
r"r")
ax.
set_ylabel(
"score")
ax.
set_ylim(
0,
1.05)
ax.
legend(
loc
=
"best",
framealpha
=
0.5)
plt.
show()
def
test_SVC_rbf():
'''
测试 高斯核的 SVC 的预测性能随 gamma 参数的影响
:param data: 可变参数。它是一个元组,这里要求其元素依次为训练样本集、测试样本集、训练样本的标记、测试样本的标记
:return: None
'''
iris
=
datasets.
load_iris()
X_train,
X_test,
y_train,
y_test
=
train_test_split(
iris.
data,
iris.
target,
test_size
=
0.25,
random_state
=
0,
stratify
=
iris.
target)
gammas
=
range(
1,
20)
train_scores
=[]
test_scores
=[]
for
gamma
in
gammas:
cls
=
SVC(
kernel
=
'rbf',
gamma
=
gamma)
cls.
fit(
X_train,
y_train)
train_scores.
append(
cls.
score(
X_train,
y_train))
test_scores.
append(
cls.
score(
X_test,
y_test))
fig
=
plt.
figure()
ax
=
fig.
add_subplot(
1,
1,
1)
ax.
plot(
gammas,
train_scores,
label
=
"Training score ",
marker
=
'+' )
ax.
plot(
gammas,
test_scores,
label
=
" Testing score ",
marker
=
'o' )
ax.
set_title(
"SVC_rbf")
ax.
set_xlabel(
r"$\gamma$")
ax.
set_ylabel(
"score")
ax.
set_ylim(
0,
1.05)
ax.
legend(
loc
=
"best",
framealpha
=
0.5)
plt.
show()
def
test_SVC_sigmoid():
'''
测试 sigmoid 核的 SVC 的预测性能随 gamma、coef0 的影响.
:param data: 可变参数。它是一个元组,这里要求其元素依次为训练样本集、测试样本集、训练样本的标记、测试样本的标记
:return: None
'''
iris
=
datasets.
load_iris()
X_train,
X_test,
y_train,
y_test
=
train_test_split(
iris.
data,
iris.
target,
test_size
=
0.25,
random_state
=
0,
stratify
=
iris.
target)
fig
=
plt.
figure()
### 测试 gamma ,固定 coef0 为 0 ####
gammas
=
np.
logspace(
-
2,
1)
train_scores
=[]
test_scores
=[]
for
gamma
in
gammas:
cls
=
SVC(
kernel
=
'sigmoid',
gamma
=
gamma,
coef0
=
0)
cls.
fit(
X_train,
y_train)
train_scores.
append(
cls.
score(
X_train,
y_train))
test_scores.
append(
cls.
score(
X_test,
y_test))
ax
=
fig.
add_subplot(
1,
2,
1)
ax.
plot(
gammas,
train_scores,
label
=
"Training score ",
marker
=
'+' )
ax.
plot(
gammas,
test_scores,
label
=
" Testing score ",
marker
=
'o' )
ax.
set_title(
"SVC_sigmoid_gamma ")
ax.
set_xscale(
"log")
ax.
set_xlabel(
r"$\gamma$")
ax.
set_ylabel(
"score")
ax.
set_ylim(
0,
1.05)
ax.
legend(
loc
=
"best",
framealpha
=
0.5)
### 测试 r,固定 gamma 为 0.01 ######
rs
=
np.
linspace(
0,
5)
train_scores
=[]
test_scores
=[]
for
r
in
rs:
cls
=
SVC(
kernel
=
'sigmoid',
coef0
=
r,
gamma
=
0.01)
cls.
fit(
X_train,
y_train)
train_scores.
append(
cls.
score(
X_train,
y_train))
test_scores.
append(
cls.
score(
X_test,
y_test))
ax
=
fig.
add_subplot(
1,
2,
2)
ax.
plot(
rs,
train_scores,
label
=
"Training score ",
marker
=
'+' )
ax.
plot(
rs,
test_scores,
label
=
" Testing score ",
marker
=
'o' )
ax.
set_title(
"SVC_sigmoid_r ")
ax.
set_xlabel(
r"r")
ax.
set_ylabel(
"score")
ax.
set_ylim(
0,
1.05)
ax.
legend(
loc
=
"best",
framealpha
=
0.5)
plt.
show()
if
__name__
==
"__main__":
test_SVC_linear()
test_SVC_poly()
test_SVC_rbf()
test_SVC_sigmoid()
- 1.
- 2.
- 3.
- 4.
- 5.
- 6.
- 7.
- 8.
- 9.
- 10.
- 11.
- 12.
- 13.
- 14.
- 15.
- 16.
- 17.
- 18.
- 19.
- 20.
- 21.
- 22.
- 23.
- 24.
- 25.
- 26.
- 27.
- 28.
- 29.
- 30.
- 31.
- 32.
- 33.
- 34.
- 35.
- 36.
- 37.
- 38.
- 39.
- 40.
- 41.
- 42.
- 43.
- 44.
- 45.
- 46.
- 47.
- 48.
- 49.
- 50.
- 51.
- 52.
- 53.
- 54.
- 55.
- 56.
- 57.
- 58.
- 59.
- 60.
- 61.
- 62.
- 63.
- 64.
- 65.
- 66.
- 67.
- 68.
- 69.
- 70.
- 71.
- 72.
- 73.
- 74.
- 75.
- 76.
- 77.
- 78.
- 79.
- 80.
- 81.
- 82.
- 83.
- 84.
- 85.
- 86.
- 87.
- 88.
- 89.
- 90.
- 91.
- 92.
- 93.
- 94.
- 95.
- 96.
- 97.
- 98.
- 99.
- 100.
- 101.
- 102.
- 103.
- 104.
- 105.
- 106.
- 107.
- 108.
- 109.
- 110.
- 111.
- 112.
- 113.
- 114.
- 115.
- 116.
- 117.
- 118.
- 119.
- 120.
- 121.
- 122.
- 123.
- 124.
- 125.
- 126.
- 127.
- 128.
- 129.
- 130.
- 131.
- 132.
- 133.
- 134.
- 135.
- 136.
- 137.
- 138.
- 139.
- 140.
- 141.
- 142.
- 143.
- 144.
- 145.
- 146.
- 147.
- 148.
- 149.
- 150.
- 151.
- 152.
- 153.
- 154.
- 155.
- 156.
- 157.
- 158.
- 159.
- 160.
- 161.
- 162.
- 163.
- 164.
- 165.
- 166.
- 167.
- 168.
- 169.
- 170.
- 171.
- 172.
- 173.
结果:
线性核函数

多项式核函数
RBF高斯核函数
sigmoid核函数
边栏推荐
- 方法的重写
- Scala105-Spark.sql中collect_list用法
- DOM Clobbering的原理及应用
- HCIA-R&S自用笔记(22)STP状态与计时器、STP拓扑变化、STP配置及实验
- How does EasyCVR call the double-speed playback of device recording through the interface?
- 单行、多行文本超出显示省略号
- win10 uwp slider 隐藏显示数值
- Nintendo won't launch any new hardware until March 2023, report says
- Route lazy loading
- EasyCVR calls the cloud recording API and returns an error and no recording file is generated. What is the reason?
猜你喜欢

Nintendo won't launch any new hardware until March 2023, report says

The CPU suddenly soars and the system responds slowly, what is the cause?Is there any way to check?

EasyCVR调用云端录像API接口返回错误且无录像文件生成,是什么原因?

Those things about the curl command
After EasyCVR is locally connected to the national standard device to map the public network, the local device cannot play and cascade the solution

基于 eBPF 的 Kubernetes 可观测实践

开篇-开启全新的.NET现代应用开发体验
自己经常使用的三种调试:Pycharm、Vscode、pdb调试
limux入门3—磁盘与分区管理
DOM Clobbering的原理及应用
随机推荐
win10 uwp slider 隐藏显示数值
ros2订阅esp32发布的电池电压数据
gbase8s创建RANGE分片表
Hezhou Cat1 4G module Air724UG is configured with RNDIS network card or PPP dial-up, and the development board is connected to the Internet through the RNDIS network card (taking the RV1126/1109 devel
Flask framework implementations registered encryption, a Flask enterprise class learning 】 【
Win10只读文件夹怎么删除
margin 塌陷和重合的理解
基于3D机器视觉的采血试管分拣系统
如何封装 svg
win10 uwp DataContext
c语言进阶篇:自定义类型--结构体
Nintendo won't launch any new hardware until March 2023, report says
[Distributed Advanced] Let's fill in those pits in Redis distributed locks.
"No title"
运力升级助力算力流转,中国数字经济的加速时刻
ERC721标准与加密猫
Literature Review on Involution of College Students
DOM Clobbering的原理及应用
2018年南海区小学生程序设计竞赛详细答案
合宙Cat1 4G模块Air724UG配置RNDIS网卡或PPP拨号,通过RNDIS网卡使开发板上网(以RV1126/1109开发板为例)