当前位置:网站首页>[matlab] 3D drawing summary
[matlab] 3D drawing summary
2022-06-30 14:57:00 【Nebula Programmer】
【Matlab】 3D drawing summary
Reference material :
《Matlab Programming and its application Lecture 3 》—— Lu Wei
《Matlab Help document 》
List of articles
1. Three dimensional curve
Draw three-dimensional curves : First there must be three 1 × n 1\times n 1×n Matrix , And then use plot3 function , Examples are as follows :
clear; clc;
t = 0 : pi/20 : 8*pi;
x = sin(t);
y = cos(t);
z = 1.5*t;
hp = plot3(x, y, z);
set(hp, 'linewidth', 2, 'color', 'r');
grid on;
axis square;
shg;
The result of the drawing :

2. Space surfaces
Draw a space surface , First, there must be two rows corresponding to the same two-dimensional matrix X X X and Y Y Y( The number of rows and columns can be different ), And then there's a function Z = f ( X , Y ) Z=f(X, Y) Z=f(X,Y), With these three arrays, you can use the following drawing function .
But before that , Given first meshgrid Function usage :
% Format :[X, Y] = meshgrid(a, b); a  and  b  It's all line vectors
% notes :[X, Y] = meshgrid(a)  Equivalent to [X, Y] = meshgrid(a, a);
%X It's a matrix , Each line is a Copy of ,Y It's a matrix , Each of these columns is y'(y Transposition ) Copy of .
% By coordinates X and Y The grid represented has length(y) Row sum length(x) Column .
clear; clc;
x = [1 2 3];
y = [1 2 3 4 5];
[X, Y] = meshgrid(x, y);
disp(X);
disp(Y);
% The output is as follows :
1     2     3
1     2     3
1     2     3
1     2     3
1     2     3

1     1     1
2     2     2
3     3     3
4     4     4
5     5     5
Here are some drawing functions .
2.1 mesh function
2.1.1 Use format
Use format :
mesh(X, Y, Z)
%{ Create a grid line with color 、 A three-dimensional surface grid with no color on the surface . The color of the gridlines depends on  Z  Specified height
 The gradient .%}

mesh(Z)
% Similar to the above , Just use Z The indexes of the columns and rows of the elements in are used as X and Y coordinate .

mesh(__, C) % here  C  be called  color array, Hereunder  2.1.3  Will be used in
%{ Input by including the fourth matrix  C  To specify the color of the grid . Grid diagram uses  Z  Said height ,C Color .
 Use 【 Color mapping 】 Assign colors ,【 Color mapping 】 Use a single number to represent the color on the spectrum . When you use 【 Yan
 Color mapping 】 when ,C And Z The dimensions of are the same . Add a... To the drawing < Color bar >( Use  colorbar  command ), To display
C How the data values in are related to 【 Color mapping 】 The colors in correspond to .%}
2.1.2 A few simple examples
Let's start using mesh Example :
% example 1
clear; clc;
[X, Y] = meshgrid(-3 : 0.1 : 3, -5 : 0.1 : 5);
Z = peaks(X, Y);
% notes :peaks yes matlab A more complex built-in function , Expression for :
%{
z =  3*(1-x).^2.*exp(-(x.^2) - (y+1).^2) ...
   - 10*(x/5 - x.^3 - y.^5).*exp(-x.^2-y.^2) ...
   - 1/3*exp(-(x+1).^2 - y.^2)
%}
mesh(X, Y, Z); % All three matrices are 101 ride 61 Matrix
example 1 Drawing results of :

% example 2
clear; clc;

[X, Y] = meshgrid(-8 : 0.1 : 8);
% What's generated here X and Y It's all one 61 ride 61 Matrix of

r = sqrt(X.^2+Y.^2);
% Sometimes at the end of the above formula  + eps,eps Is a very small double precision number , To make the denominator not 0, But it's OK not to add it

Z = sin(r)./r;
% Notice the './' Is to operate on each element in the array , Use '/' Will report a mistake

mesh(X, Y, Z); % All three matrices are one 161 ride 161 Matrix of
example 2 Drawing results of ( This picture is commonly known as Mexican hat ):

% example 3, In case 2 Add a color map based on , And use colorbar Display color and C The corresponding relationship between the values in
clear; clc;

[X, Y] = meshgrid(-8 : 0.1 : 8);
r = sqrt(X.^2+Y.^2);

C = X.*Y;
% '.*' representative X and Y The elements in are multiplied by each other , and '*' It means matrix multiplication

Z = sin(r)./r;
% Notice the './' Is to operate on each element in the array , Use '/' Will report a mistake

mesh(X, Y, Z, C);% All four matrices are one 161 ride 161 Matrix of
colorbar;
% notes : If not C, It can also be used  colorbar  Ordered
example 3 Drawing results of :

2.1.3 Add additional properties
1)EdgeColor attribute
Examples of use :
% All edges use only one color
mesh(X, Y, Z, 'EdgeColor', 'r');

% According to the matrix  C  Value , Use different colors for each edge .
mesh(X, Y, Z, 'EdgeColor', 'flat');

% According to the matrix  C  Values of use interpolated shading for each edge .
mesh(X, Y, Z, 'EdgeColor', 'interp');
2)FaceColor attribute
Examples of use :
% All mesh faces use only one color
mesh(X, Y, Z, 'FaceColor', 'b');

% According to the matrix  C  Value , Use different colors for each mesh face .
mesh(X, Y, Z, 'FaceColor', 'flat');

% According to the matrix  C  Value , Use interpolated shading for each mesh face .
mesh(X, Y, Z, 'FaceColor', 'interp');
3)LineStyle attribute
Examples of use :
% Remove the gridlines from the graph
mesh(X, Y, Z, 'LineStyle', 'none');% In this case, it is suggested to add 'FaceColor' attribute , Otherwise, the picture will be pure white ( Because mesh faces are not shaded by default )

% Use other linetypes . This is the same as the previous two-dimensional drawing , Let's take an example of point line type
mesh(X, Y, Z, 'LineStyle', '-.');% Note here '.-' Will report a mistake
4)FaceAlpha attribute
This can be used to adjust the transparency of the image , The smaller the value given , The more transparent the picture is . The default value is 1, For opacity . Only the most common uses are listed here :
% Property is followed by a 0 To 1 Between the value of the , The default is 1
mesh(X, Y, Z, 'FaceAlpha', '0.2');
2.2 meshc function
Create a grid diagram , Here's an outline ( Can be seen as x-y There is a contour map on the plane ).
The format and attributes used are the same as mesh The function is almost , I won't repeat , Just give me an example .
% Example
clear; clc;
[X, Y] = meshgrid(-3 : 0.1 : 3);
Z = peaks(X, Y);
meshc(X, Y, Z);
The result of the drawing :

2.3 meshz function
Draw with curtain ( It is equivalent to adding a curtain to the boundary ) Grid graph of .
The format and attributes used are the same as mesh The function is almost , I won't repeat , Just give me an example .
% Example
clear; clc;
[X, Y] = meshgrid(-3 : 0.1 : 3);
Z = peaks(X, Y);
meshz(X, Y, Z);
The result of the drawing :

2.4 waterfall function
Draw a waterfall , This is one along Y Grid diagram with partial curtain in dimension . This produces “ The waterfall ” effect !
The format and attributes used are the same as mesh The function is almost , I won't repeat , Just give me an example .
% Example
clear; clc;
[X, Y] = meshgrid(-3 : 0.1 : 3);
Z = peaks(X, Y);
waterfall(X, Y, Z);
The result of the drawing :

2.5 surf function
Created a 3D surface , Different from the previous ones , The edges and faces of the graph it creates have colors . namely mesh Draw a grid ,surf Draw a shaded 3D surface .
The format and attributes used are the same as mesh The function is almost , I won't repeat , Just give me an example .
% Example
clear; clc;
[X, Y] = meshgrid(-3 : 0.1 : 3);
Z = peaks(X, Y);
surf(X, Y, Z);
The result of the drawing :

2.6 colormap function
2.6.1 Use format
Here are two common uses :
The first one is :
colormap mapname;
%{ The above statement is equivalent to
colormap('mapname');
%}
here ,mapname yes matlab Preset color map , As shown in the following table :
| mapname | explain |
|---|---|
| hsv | HSV The color comparison table of |
| hot | representative ” heat “ The color comparison table of |
| cool | representative ” cold “ The color comparison table of |
| spring | representative ” spring “ The color comparison table of |
| summer | representative ” summer “ The color comparison table of |
| autumn | representative ” autumn “ The color comparison table of |
| winter | representative ” winter “ The color comparison table of |
| gray | representative ” gray “ The color comparison table of |
| copper | representative ” coppery “ The color comparison table of |
| bone | representative ” X Photo chip “ The color comparison table of |
| pink | representative ” pink “ The color comparison table of |
| flag | representative ” The flag “ The color comparison table of |
The second kind :
colormap(map);
here ,map It's a n × 3 n\times 3 n×3 Matrix , Each line represents a RGB The ingredients of , A color .matlab When drawing , Match the color of the first row to the highest point of the surface , The last line of colors corresponds to the lowest point of the surface , Other height colors are given by linear interpolation .
2.6.2 A few simple examples
% example 1, Use the first method
clear; clc;
[X, Y] = meshgrid(-3 : 0.1 : 3);
Z = peaks(X, Y);
mesh(X, Y, Z);
colormap hot;
The result of the drawing :

% example 2, Still use the first method , In another form
clear; clc;
[X, Y] = meshgrid(-3 : 0.1 : 3);
Z = peaks(X, Y);
mesh(X, Y, Z);
colormap('copper');
The result of the drawing :

% example 3, Use the second method
clear; clc;
[X, Y] = meshgrid(-3 : 0.1 : 3);
Z = peaks(X, Y);

mesh(X, Y, Z);

colormap(rand(100, 3));
% notes :rand(m, n) Function to generate a  m  ride  n  Matrix
The result of the drawing :

3. Contour map
Draw contour map , First, there must be two rows corresponding to the same two-dimensional matrix X X X and Y Y Y( The number of rows and columns can be different ), And then there's a function Z = f ( X , Y ) Z=f(X, Y) Z=f(X,Y), With these three arrays, you can use the following drawing function .
3.1 contour function
Draw contour lines on a plane .
3.1.1 Use format
contour(X, Y, Z);
% Draw contour lines on a plane

contour(Z);
% This is the same thing as contour(X, Y, Z), among [X, Y] = meshgrid(x, y)
%x The default is Z A matrix of row indexes ,y The default is Z A matrix composed of column indexes of

contour(__, levels);
% Specify the level ,levels The bigger it is , The finer the height , The more contour lines there are
3.1.2 A few simple examples
% example 1
clear; clc;
[X, Y] = meshgrid(-3 : 0.1 : 3);
Z = peaks(X, Y);
contour(X, Y, Z, 20);
The result of the drawing :
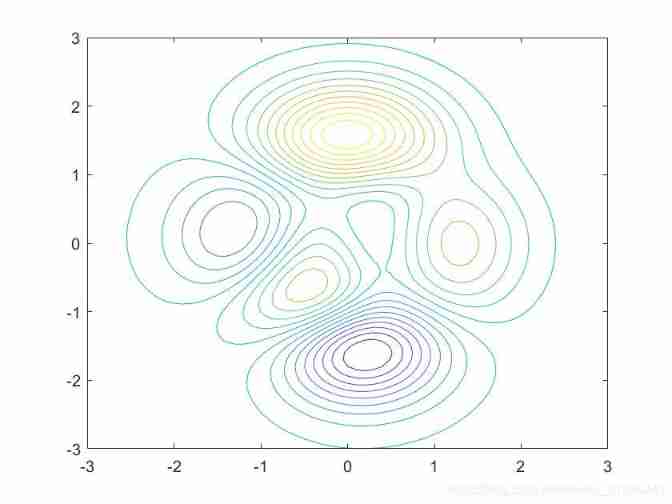
% example 2
clear; clc;
[X, Y] = meshgrid(-5 : 0.1 : 5);
Z = peaks(X, Y);
contour(Z, 50);
The result of the drawing :

3.1.3 Add additional properties
1)LineSpec attribute
This does not need to add keywords , Directly specify the type . Examples of use :
% And two-dimensional drawing plot The function is the same

% The color is specified as blue , The linetype is specified as a dashed line
contour(X, Y, Z, '--b');
2)ShowText attribute
Examples of use :
% The default value is 'off', Set to 'on' after , Contour labels will be displayed in the figure
contour(X, Y, Z, 'ShowText', 'on');
There is another way to display contour labels , Use clabel function . Examples of use :
M = contour(X, Y, Z);
clabel(M);
% notes :M  Is the contour matrix , It contains the vertices of each layer (x, y) coordinate .
3)LineWidth attribute
Examples of use :
% The default value is 0.5
contour(X, Y, Z, 'LineWidth', 1.2);
3.2 contour3 function
Create a 3D contour map .
The format and attributes used are the same as contour The function is almost , I won't repeat , Just give me an example .
% Example
clear; clc;
[X, Y] = meshgrid(-3 : 0.1 : 3);
Z = peaks(X, Y);
contour3(X, Y, Z, 20);
The result of the drawing :

3.3 contourf function
Draw a plane contour map of fill color .
The format and attributes used are the same as contour The function is almost , I won't repeat , Just give me an example .
% Example
clear; clc;
[X, Y] = meshgrid(-3 : 0.1 : 3);
Z = peaks(X, Y);
contourf(X, Y, Z, 20);
The result of the drawing :

4. v = f(x, y, z) Visualization
The commonly used method is to slice the three-dimensional volume , At the cross section, different colors are used to represent the size of the function value at this point . It uses slice function .
4.1 Use format
Use format :
slice(X, Y, Z, V, sx, sy, sz)
X, Y, Z It is three three-dimensional matrices with the same length in each dimension ,V It's about X, Y, Z A function of .sx For a row vector , Each element represents a x section ( Parallel to the yoz Plane ),sy And sz It has the same meaning sx Be the same in essentials while differing in minor points .
4.2 Example
Examples of use :
% Example
clear; clc;
[X, Y, Z] = meshgrid(-2 : 0.1 : 2);
V = X.*exp(-X.^2 - Y.^2 - Z.^2);
xslice = [-1, 1];
yslice = 2;
zslice = [-2, 0];
slice(X, Y, Z, V, xslice, yslice, zslice);
The result of the drawing :

5. At the end
If there is any mistake, please point it out , Learning together , Common progress !
If there are any questions , Welcome to ask questions !
thank you !
The next article predicts :【Matlab】 Audio signal processing
Welcome to continue to pay attention
Links show the way :
Last one :【Matlab】 Two dimensional drawing summary
边栏推荐
- Matlab finds a prime number that is greater than a given integer and follows this integer
- 1136: password translation
- Matlab draws the image of the larger function value of the two functions (super simple)
- Bucket sorting (C language)
- 1130: find the first character that appears only once
- Sorting by character frequency
- Non decreasing column
- 机械工程师面试的几个问题,你能答上来几个?
- For loop and promise to solve the problem of concurrent callback
- 【BUUCTF】[GXYCTF2019]Ping Ping Ping1
猜你喜欢

V3 03_ Getting started

CCF numerical sorting (Full Score code + problem solving ideas + skill summary) 201503-2

PS cutting height 1px, Y-axis tiling background image problem

val_ Loss decreases first and then increases or does not decrease but only increases

CCF Z-scan (full mark code + problem solving ideas) 201412-2

CCF image rotation (Full Score code + problem solving idea) 201503-01

2021-07-14 mybaitsplus
 [email protected][])"/>
NoViableAltException([email protected][])

CCF elimination games (Full Score code + problem solving ideas + skill summary) February 2, 2015

【BUUCTF】 Have Fun
随机推荐
2021-08-05 leetcode notes
浅析卧式加工中心上不规则台阶孔存在问题
[extensive reading of papers] multimodal joint attribute prediction and value extraction for e-commerce product
MV3 04_ Introducing Manifest V3
Machine learning feature selection
Hbuilder most commonly used and full shortcut key set
ThinkPHP show method parameter controllable command execution
1031 Hello world for u (20 points)
PS cutting height 1px, Y-axis tiling background image problem
[extensive reading of papers] sentimental analysis of online reviews with a hierarchical attention network
PS dynamic drawing
How to realize selective screen recording for EV screen recording
Programming exercises: special numbers (problem solving ideas + code implementation)
day02
CCF adjacent number pairs (Full Score code + problem solving ideas + skill summary) 201409-1
Color classification of sorting
Binary rotation array (1)
CCF command line options (Full Score code + problem solving ideas + skill summary) March 3, 2014
IO interview questions
[extensive reading of papers] multi modal sarcasm detection and human classification in code mixed conversations