当前位置:网站首页>设计人员拿到的工程坐标系等高线CAD图如何加载进图新地球
设计人员拿到的工程坐标系等高线CAD图如何加载进图新地球
2022-06-26 14:46:00 【三维GIS那点事_王跃军】
序:
一个朋友拿到了一份CAD格式的图纸,里面有等高线,想把它作为三维地形底图加载到图新地球。让其他同事帮忙转换,同事用Arcgis给他输出了一份tif格式的地形,但这个数据实际检查发现是【影像】
这里给出cad格式的数据,转换为tif格式地形的教程,并在lsv里面加载。
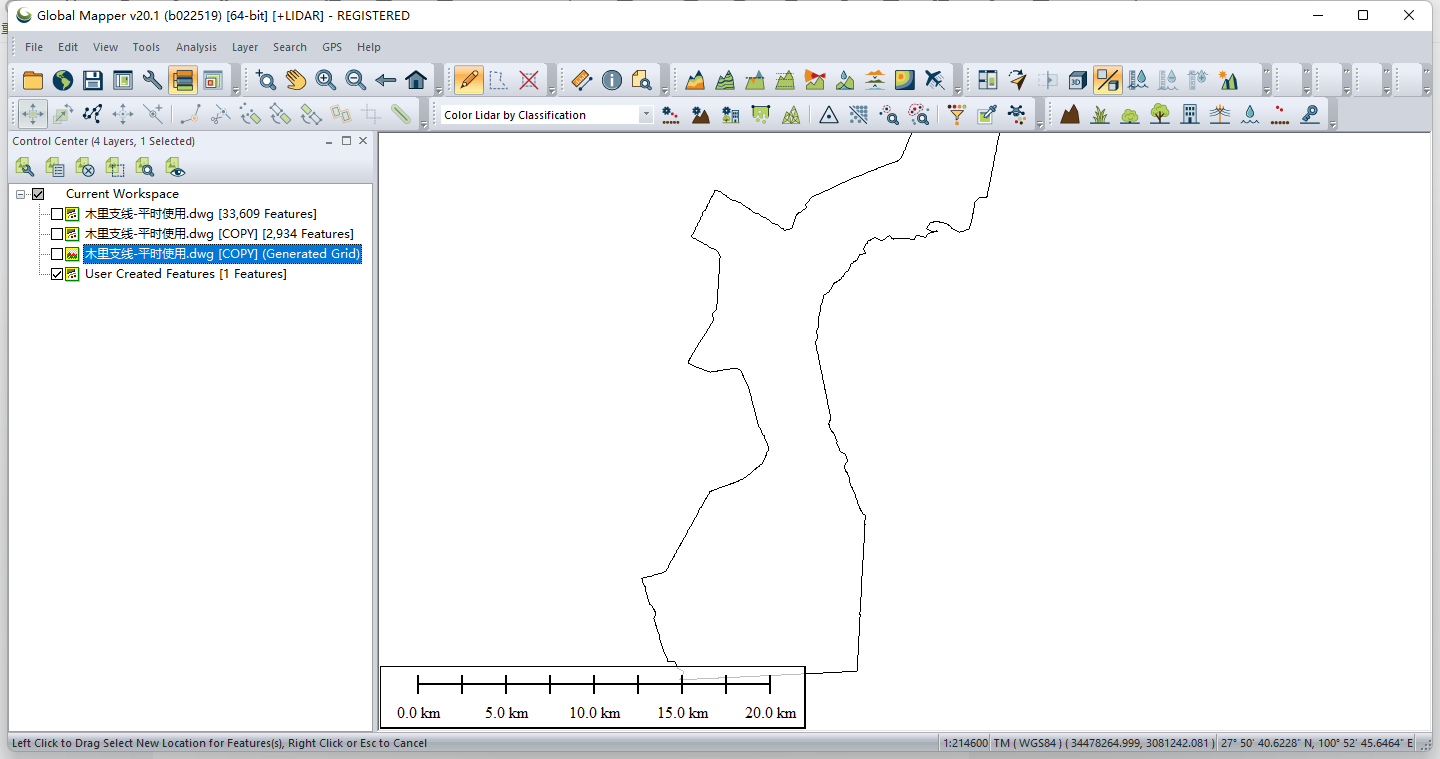
一、GlobalMapper打开CAD图纸
注意,GlobalMapper打开CAD一定要知道它对应的投影文件,打开之后效果如图
注:此处最开始用错了投影,导致坐标范围越界,本数据坐标是带带号的

二、筛选出用于生成地形的等高线

属性表如下图:


筛选出了2934条等高线
ctrl+A全选,右键复制

直接ctrl+V粘贴


三、生成等高线


四、生成图层的范围:


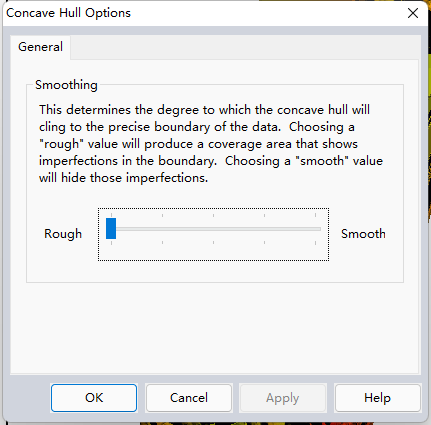
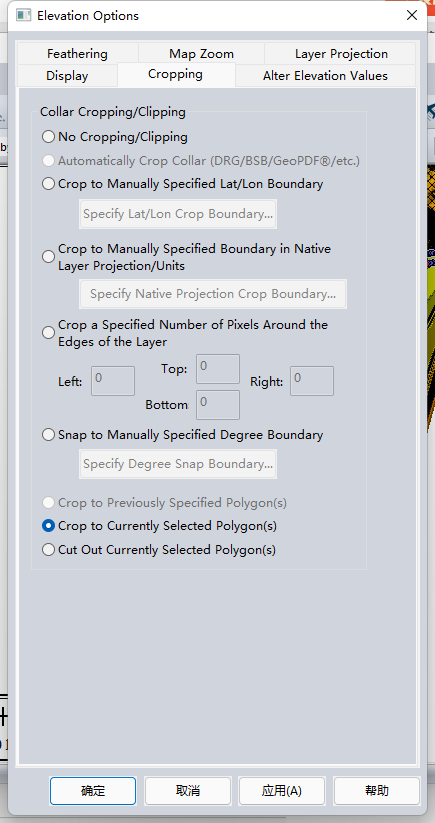
五、按范围对生成的地形进行精确裁剪

六、输出地形


七、图新地球加载生成的tif
注:投影信息正确的直接加载地形就可以了(建议使用地形批处理转为lrp)
如果投影信息是地方坐标系,请使用【导入tif】配置工程坐标系进行导入

边栏推荐
- R语言epiDisplay包的tableStack函数制作统计汇总表格(分组的描述性统计、假设检验等)、不设置by参数计算基础描述性统计信息、指定对于大多数样本负相关的变量进行反序
- 这才是优美的文件系统挂载方式,亲测有效
- Transformers datacollatorwithpadding class
- Question bank and answers of the latest Guizhou construction eight (Mechanics) simulated examination in 2022
- Stream常用操作以及原理探索
- Complimentary Book Cognitive Control: how does our brain accomplish tasks?
- Mathematical modeling of war preparation 30 regression analysis 2
- fileinput. js php,fileinput
- [cloud native] codeless IVX editor programmable by "everyone"
- 'coach, I want to play basketball!'—— AI Learning Series booklet for system students
猜你喜欢
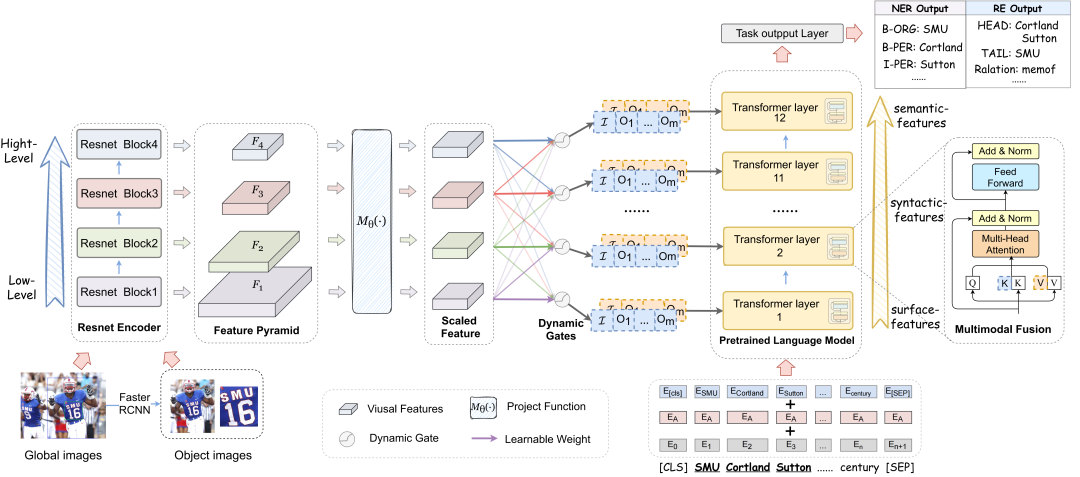
NAACL2022:(代码实践)好的视觉引导促进更好的特征提取,多模态命名实体识别(附源代码下载)...

JVM 输出 GC 日志导致 JVM 卡住,我 TM 人傻了
这才是优美的文件系统挂载方式,亲测有效

One copy ten, CVPR oral was accused of plagiarizing a lot, and it was exposed on the last day of the conference!

备战数学建模30-回归分析2

使用宝塔面板部署flask环境

Keil4打开单片机工程一片空白,cpu100%程序卡死的问题解决

Electron

Talk about the RPA direction planning: stick to simple and valuable things for a long time

Notes on writing questions in C language -- table tennis competition
随机推荐
R语言dplyr包bind_rows函数把两个dataframe数据的行纵向(竖直)合并起来、最终行数为原来两个dataframe行数的加和(Combine Data Frames)
印尼投资部长:鸿海考虑在其新首都建立电动公交系统、城市物联网
程序分析与优化 - 8 寄存器分配
一篇抄十篇,CVPR Oral被指大量抄袭,大会最后一天曝光!
Mathematical modeling of war preparation 30 regression analysis 2
15 bs对象.节点名称.节点名称.string 获取嵌套节点内容
Get the intersection union difference set of two dataframes
15 BS object Node name Node name String get nested node content
R语言caTools包进行数据划分、scale函数进行数据缩放、class包的knn函数构建K近邻分类器
BM3D in popular language
Bank of Beijing x Huawei: network intelligent operation and maintenance tamps the base of digital transformation service
Document 1
NAACL2022:(代码实践)好的视觉引导促进更好的特征提取,多模态命名实体识别(附源代码下载)...
在云服务器中云磁盘如何挂载
子查询的使用
Talk about the RPA direction planning: stick to simple and valuable things for a long time
fileinput. js php,fileinput
券商经理给的开户二维码安全吗?找谁可以开户啊?
Electron
2022年最新贵州建筑八大员(机械员)模拟考试题库及答案