当前位置:网站首页>Convolution neural network -- Application of CNN model (ore prospecting prediction)
Convolution neural network -- Application of CNN model (ore prospecting prediction)
2022-06-27 06:07:00 【Mango is very bright~】
One 、CNN Structure
The prospecting prediction model of convolutional neural network is mainly composed of data input layer 、 Convolution layer 、 Pooling layer 、 Full connection layer and output layer 5 Network layer .
The data input layer writes the gridded geochemical and aeromagnetic data into the neural unit as input data , Convolution layer and pooling layer select appropriate activation functions to complete data feature extraction and down sampling , The full connection layer realizes the mapping and classification of features at the end of the network , The output layer can be used for result output or feature visualization . The convolution neural network model used in this paper is composed of 4 Convolution layers 、4 Pool layers and 1 Full connection layer composition .

Convolution layer (convolution): The core of convolutional neural network , It embodies the local connection and weight sharing characteristics of convolutional neural network . Let's start with a convolution kernel of a certain size ( A weight matrix ) Extract the local features of the whole data , Then the data features of different positions are extracted by step translation . Convolution kernel is equivalent to filter , Used to extract data features , After feature extraction, a feature map will be obtained . After convolution , Usually introduced Nonlinear activation function ( Also called nonlinear mapping function ), Learning the neural network model 、 It is important to understand very complex target domains . The activation function used in this article is RuLU function . This function can speed up the training while ensuring the training effect .
Pooling layer (pooling): Compress the input characteristic data , Simplify network complexity , Extract the main features . Pooling is equivalent to dimensionality reduction , There are maximum pooling and average pooling , This article uses maximum pooling . The feature space extracted by convolution operation , Adjacent areas will have similar feature information , If all are retained, there will be information redundancy , Increase the difficulty of calculation . The data space is continuously reduced through the pooling layer , The number of parameters and the amount of calculation will be reduced accordingly , Over fitting is controlled to some extent .
Fully connected layer (fully connected layers): Every node in the full connection layer is connected to all nodes in the upper layer , It is used to synthesize the previously extracted features .n-1 Any node of the layer is connected with the n All nodes of the layer are connected , That is to say n Each node of the layer is calculated , The input to the activation function is n-1 Weighting of all nodes in the layer .
Two 、CNN Prospecting prediction process
For element geochemical anomaly data 、 Aeromagnetic data is gridded , Using data enhancement technology to acquire training data and validate data sets , Then the model is trained and generated based on convolution neural network , The trained model is applied to predict the favorable prospecting position in the study area .

3、 ... and 、 Data collection and processing
Using geochemical anomaly data and aeromagnetic data , Extract known deposit information .
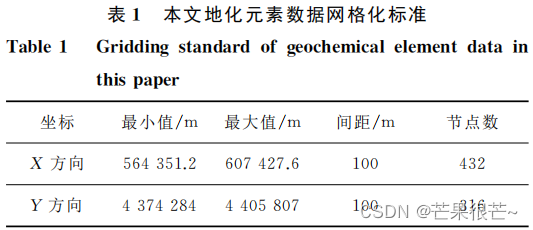
Because the collected data is not evenly distributed in space , We need to use interpolation method to transform it into regular grid data . In this paper, Kriging method is used to realize the grid of two-dimensional data , obtain 25 Element geochemical anomaly data and 3 A kind of grid data of aeromagnetic data . Each type of data passes through Surfer Software converted to 432×316 Grid data layer ( The size of each grid is 100×100).
(1) Geochemical data
Research District Yes Ag、As、Au、B、Be、Bi、Cd、Co、Cr、 Cu、Hg、La、Li、Mn、Mo、Nb、Ni、Pb、Sb、Sn、Th、Ti、U、W and Zn etc. 25 Geochemical survey data of element stream sediments , The geochemical survey data of stream sediment of each element reflect the different element characteristics of the region . utilize Surfer Software Yes 25 Three elements are meshed , Gridding data can convert spatially dispersed values into regular distributed grid values , Suppress local noise , And assign values to the blank grid according to the rules , Get a unified spatial structure , The spatial pattern that can fully reflect the object variables . Compare several interpolation methods , Kriging method It can reflect the distance relationship , And it can be analyzed by variogram and structure , Determine the spatial distribution of the known sample points and the spatial orientation relationship with the unknown sample points . In this paper, Kriging interpolation is used , Set the grid cell size to 100m×100 m( surface 1), obtain 25 Geochemical Gridding Data of stream sediments , The total number of grid cells is 432×316=136512 individual
Kriging interpolation method is used to Cu、Mo、Zn and As4 Elements , Press 100m×100m Mesh the cell size , draw 1:5 10000 contour map . Contrast figure 1, Find out 4 All the elements have obvious anomalies near Daqingshan ( The area contains the discovered Daqingshan copper mine ),Cu、 Mo There are anomalies in the north of Pantou mountain and Yaoquan : The abnormal range of Pan tou mountain is large , In the middle Hercynian granodiorite , It has certain prospecting potential ; Yaoquan North anomaly is located at the edge of the location , Tonalite is exposed , It has certain prospecting potential .Zn、As There are also abnormal reactions in the south of Fangjia mountain , There are abnormal intrusive rocks in this area , Mainly Caledonian acid rocks , Monzogranite and syenogranite areas are exposed , There is tonalite in the south of the area , The exposed area is small .


(2) Aeromagnetic data
The study area has 3 picture 1:5 Ten thousand aeromagnetic data , The aeromagnetic data are gridded by Kriging interpolation ,100m×100m Grid cell size of ( And watch 1 Same as ) utilize Geosoft Software pair Data processing , obtain ΔT Polar aeromagnetic anomaly map ( chart 6a), After that, aeromagnetic continuation data shall be used , Upward continuation is mainly to suppress or eliminate the interference of shallow geological bodies , To highlight and show the useful magnetic anomalies produced by deep and meaningful geological bodies . The data after gridding shall be upgraded respectively 50m( chart 6b)、100m( chart 6c) and 150m( chart 6d) Continuation of . What this article needs to use is ΔT Polar aeromagnetic anomaly map 、50m Upward continuation graph and 100m Upward continuation graph .
chart 6a You know : The extension direction of magnetic anomaly band is NW towards , It mainly exists in the north and south 2 A high magnetic anomaly zone ; Contrast figure 1, The northern high magnetic anomaly zone is located in Daqingshan in the north of the area — Tiancheng is northwest — East West zonal high magnetic anomaly zone , There is a huge magmatic belt dominated by intermediate acid intrusive rocks , Most of the anomalies are caused by intermediate acid intrusive rocks such as diorite , Copper deposits have been discovered along the magnetic anomaly belt in the north ( spot ).
chart 6b You know : The magnetic anomalies in this area are relatively concentrated , It is mainly concentrated in the Midwest and southwest of the study area . To further eliminate the impact , Keep going 100m Extension ( chart 6c) and 150m Extension ( chart 6d), Magnetic anomaly areas are mainly found in the central and western regions and the southwest , In the later stage, the delineation of favorable metallogenic areas should focus on magnetic anomaly areas as much as possible .
In order to show the change characteristics of aeromagnetic anomaly directivity in the study area , The derivation of the original data after gridding in the study area in different directions , Calculate the study area respectively 0°( chart 6e)、45°( chart 6f)、90°( chart 6g) and 135°( chart 6h) The direction of chart . It turns out that , After derivation , The aeromagnetic anomaly area in the study area mainly presents NW Spread to , also Show some NE To change characteristics .

(3) Metallogenic geological characteristics of ore occurrence
There are known copper occurrences in the study area 4 individual , Big green hill Ⅰ Copper mine No 、 Mount Daqing Ⅱ Copper mine No 、 Mount Daqing Ⅲ Copper mine No 、 Untitled Ⅳ Copper mine No . Copper deposits are mainly developed in Daqingshan area , The types of copper deposits are mainly porphyry copper deposits and fissure disseminated copper deposits .
Four 、 Generation of training and validation data sets
The number of known deposit points in the study area is small , It is difficult to meet the requirements of training sample size for deep learning , Constructing large training samples is a challenge in the modeling process of deep learning prospecting prediction model . In this paper, we use step shift data enhancement method to construct training sample set , So we can get a network with stronger generalization ability , Make the results more reliable .
Step shift data enhancement method : Use a certain window size ( The convolution kernel size , Such as 48*48=2304 Grid cells ), Move the window so that the deposit point is located in 1 Grid cells , All geophysical and geochemical grid data included in the extraction window , Traverse all window grid cells . about 1 Deposit points can be obtained 2304 Training units . If there is... In the study area n Ore deposit points , You can get 2304n Training units . Randomly select the number of known deposits in the study area 2 Times the grid cell as the unknown area , Use the same method to obtain the training unit of the unknown area .

5、 ... and 、 Construction of convolution neural network model 、 Training and verification
Train and verify the model with the prepared training data set , Then different parameters and super parameters are used for training , Select the optimal model by verifying the data set .
Input data layer 25 Geochemical anomaly data of elements +3 A kind of grid data of aeromagnetic data = 28 Species data , Each type of data passes through Surfer The software is transformed into 432×316 Grid data layer ( Division of study area , The actual coverage is equivalent to 43200m×31600m, Data gridding is to convert spatially dispersed numerical values into regularly distributed grid numerical values , Assign values to the blank grid according to the rules , Get a unified spatial structure ). For each type of data, the deviation standardization method is used for processing , Using principal component analysis (PCA) hold 28 The dimensional data layer is compressed into 24 dimension . The window size is set to 48×48 Grid cells ( A small area of the study area , Sliding , The actual coverage of the window is equivalent to 4800m×4800m), The number of input data channels per window is 28(? The dimension has been reduced to 24 Yeah. ), The size of the convolution kernel is 3×3, The number of convolution kernels in the first layer is 48(? How to determine the number of convolution kernels ), The step size is set to 1, The optimization algorithm of the model is Adam Algorithm , The learning rate is set as 0.001, The falloff rate is set to the default value .
The training data set and the validation data set are based on known 3 Copper occurrences , Data enhancement method is used to obtain 22934 Training data (2304*9=20736).70% The data is used to train the model , Include 16054 Training data ;30% For model validation , Include 6880 Training data .
Using the above parameters and data sets, the model is 200 Round training and verification . The results show that 50 After the training round , The model tends to be stable , The accuracy of the model is 98.1% about

6、 ... and 、 Determination of prospecting prediction area
With a trained model , The study area is predicted by sliding window , Circle a favorable forecast to , And according to the mineral geological data , Analyze the reliability of the prediction results , So as to determine the prospecting prediction area .
The trained model is used to predict the favorable copper prospecting areas in the study area . From the forecast result graph ( chart 8) It can be seen that ,CNN The model is obtained in the study area 5 A favorable prospecting area .P-1: Located in Shantou kiln — Yaoquan — North of Daqingshan , The forecast area contains known 4 Copper occurrences ;P-2: Located in the north east of Yaoquan ;P-3: Located near the pan tou mountain ;P-4: The main stratum is metamorphic sandstone of dunzigou group of Jixian system 、 Granulite ,.P-5: Located in the south of the study area ; There are Cu Abnormal high value of element geochemical exploration


7、 ... and 、 Analysis of influencing factors of prediction results
1. The influence of super parameters on the prediction results
(1)PCA Number of principal components
PCA The main idea : take n Dimension features map to k D on , In the original n Based on the characteristics of dimension, we reconstruct k Whitman's sign .28 Dimensional data is too cumbersome for computer operations , Compress the data dimension , The prediction results are different , contrast 4 Kind of PCA The influence of the number of principal components on the prediction results .
The higher the dimension , The more complex the resulting prediction area , But there are some similarities in general , take 28 Dimensional data is compressed into 24 The prediction results obtained from dimensional data are more in line with the actual geological conditions

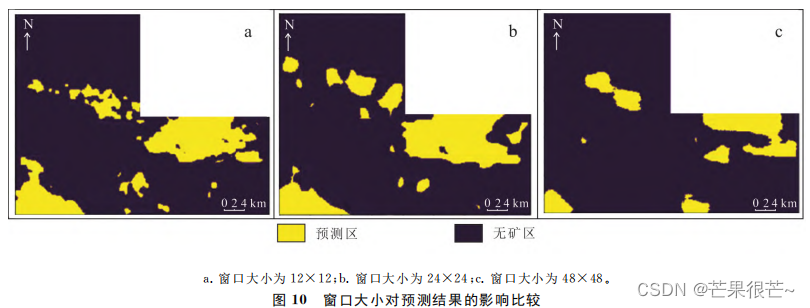
(2) Window size
The greater the window , The larger the training data set that can be extracted , When the window sizes are 12×12、24×24、48×48 when , The number of training samples that can be extracted is 3056、8048、22934. Use a larger window , There are many training sample data obtained , The prediction range obtained is relatively small .
contrast 3 Kinds of prediction results , The overall location of the forecast area is similar . When the window size is 48×48 when , The forecast area is relatively small , At this time, a large number of training samples are generated , The accuracy of the prediction area obtained by the model is high .
(3) The number of convolution kernels
The number of convolution kernels directly affects the local characteristics of the input , The more convolution kernels , The more local features are extracted .
Compare 3 Number of different convolution kernels , The overall location of the forecast area is similar , When the initial number of convolution kernels is 48 when , The forecast area is relatively small , And more in line with geological conditions .

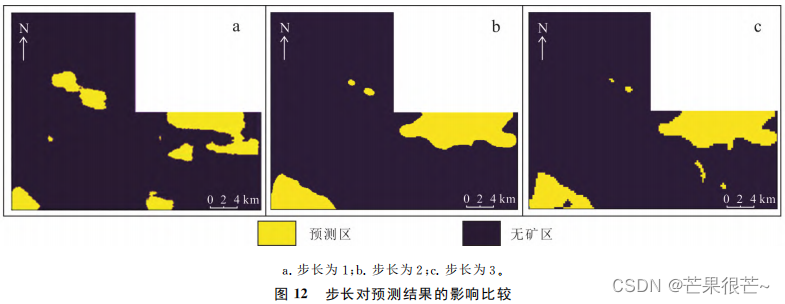
(4) step
The step size in the convolution layer indicates how many lattices the convolution kernel moves at a time . contrast 3 The prediction results of three steps , It is found that the step size increases , The precision of prediction results is reduced . Comparative geological map 、 Geochemical element anomaly map and aeromagnetic anomaly map can , When the step length is 1 It has more credibility .
(5) Number of samples captured
Batch_size Number of data samples captured for one training . proper Batch_size The gradient variance can be reduced , The gradient is more accurate , Make the prediction results more accurate .
contrast 3 Kind of No Same as Of Batch_size, If the sample size of data captured in each training is different , Although the predicted results are roughly the same , However, the predicted area changes slightly Big . Geochemical anomaly map of comparative elements 、 Aeromagnetic anomaly map and geological map , Found that when Batch_size by 64 when , The predicted results are reliable .

2. Influence of different data sets on prediction results
Select 25 Geochemical element data 、3 Aeromagnetic data 、 comprehensive 25 Geochemical element data and 3 Three kinds of aeromagnetic data are used as input data for experiments

3. The influence of different grid cell sizes on the prediction results
Set the window size to 48×48, The size of the convolution kernel is 3×3, The number of convolution kernels in the first layer is 48, The step size is set to 1,Batch_size by 64, The input data is compressed 24 Dimensional geochemical element data and aeromagnetic data , contrast 50m Grid input data and 100m Input data of grid .

reference : Intelligent prospecting based on convolution neural network ...— Take the copper mine in Longshoushan area of Gansu Province as an example _ Lizhongtan
边栏推荐
- 427- binary tree (617. merge binary tree, 700. search in binary search tree, 98. verify binary search tree, 530. minimum absolute difference of binary search tree)
- 代码即数据
- NLP-D62-nlp比赛D31&刷题D15
- 【QT小记】QT中正则表达式QRegularExpression的基本使用
- JVM常用指令
- [cocos creator 3.5.1] addition of coordinates
- Formation and release of function stack frame
- openstack实例重启状态就会变成错误处理方法,容器搭建的openstack重启计算节点compute服务方法,开机提示Give root password for maintenance处理方法
- QListWidget中的内容不显示
- Luogu p2939 [usaco09feb]revamping trails G
猜你喜欢

G1 and ZGC garbage collector

块级元素&行内元素
软件测试年终总结报告模板
Free SSH and telnet client putty

JVM overall structure analysis
Create a basic WDM driver and use MFC to call the driver

资深【软件测试工程师】学习线路和必备知识点

427-二叉树(617.合并二叉树、700.二叉搜索树中的搜索、98. 验证二叉搜索树、530.二叉搜索树的最小绝对差)

JVM garbage collection mechanism

树莓派4B上运行opcua协议DEMO接入kubeedge

随机推荐
【Cocos Creator 3.5.1】event. Use of getbutton()
Wholestagecodegen of spark
信息系统项目管理师---第七章 项目成本管理
【合辑】点云基础知识及点云催化剂软件功能介绍
JVM调优思路
卷积神经网络---CNN模型的应用(找矿预测)
Small program of C language practice (consolidate and deepen the understanding of knowledge points)
Dev++ environment setting C language keyword display color
Open the door small example to learn ten use case diagrams
QT using Valgrind to analyze memory leaks
Jump details of item -h5 list, and realize the function of not refreshing when backing up, and refreshing when modifying data (record scroll bar)
Using CSDN to develop cloud and build navigation websites
Proxy-Reflect使用详解
Go日志-Uber开源库zap使用
IAR systems fully supports Centrino technology 9 series chips
项目-h5列表跳转详情,实现后退不刷新,修改数据则刷新的功能(记录滚动条)
汇编语言-王爽 第8章 数据处理的两个基本问题-笔记
Senior [Software Test Engineer] learning route and necessary knowledge points
MATLAB快速将影像的二维坐标转换为经纬度坐标
How to check the frequency of memory and the number of memory slots in CPU-Z?