当前位置:网站首页>MATLAB signal processing [Q & a notes-1]
MATLAB signal processing [Q & a notes-1]
2022-07-02 23:50:00 【Goose feather is on the way】
1. About matlab frezq fir1 function
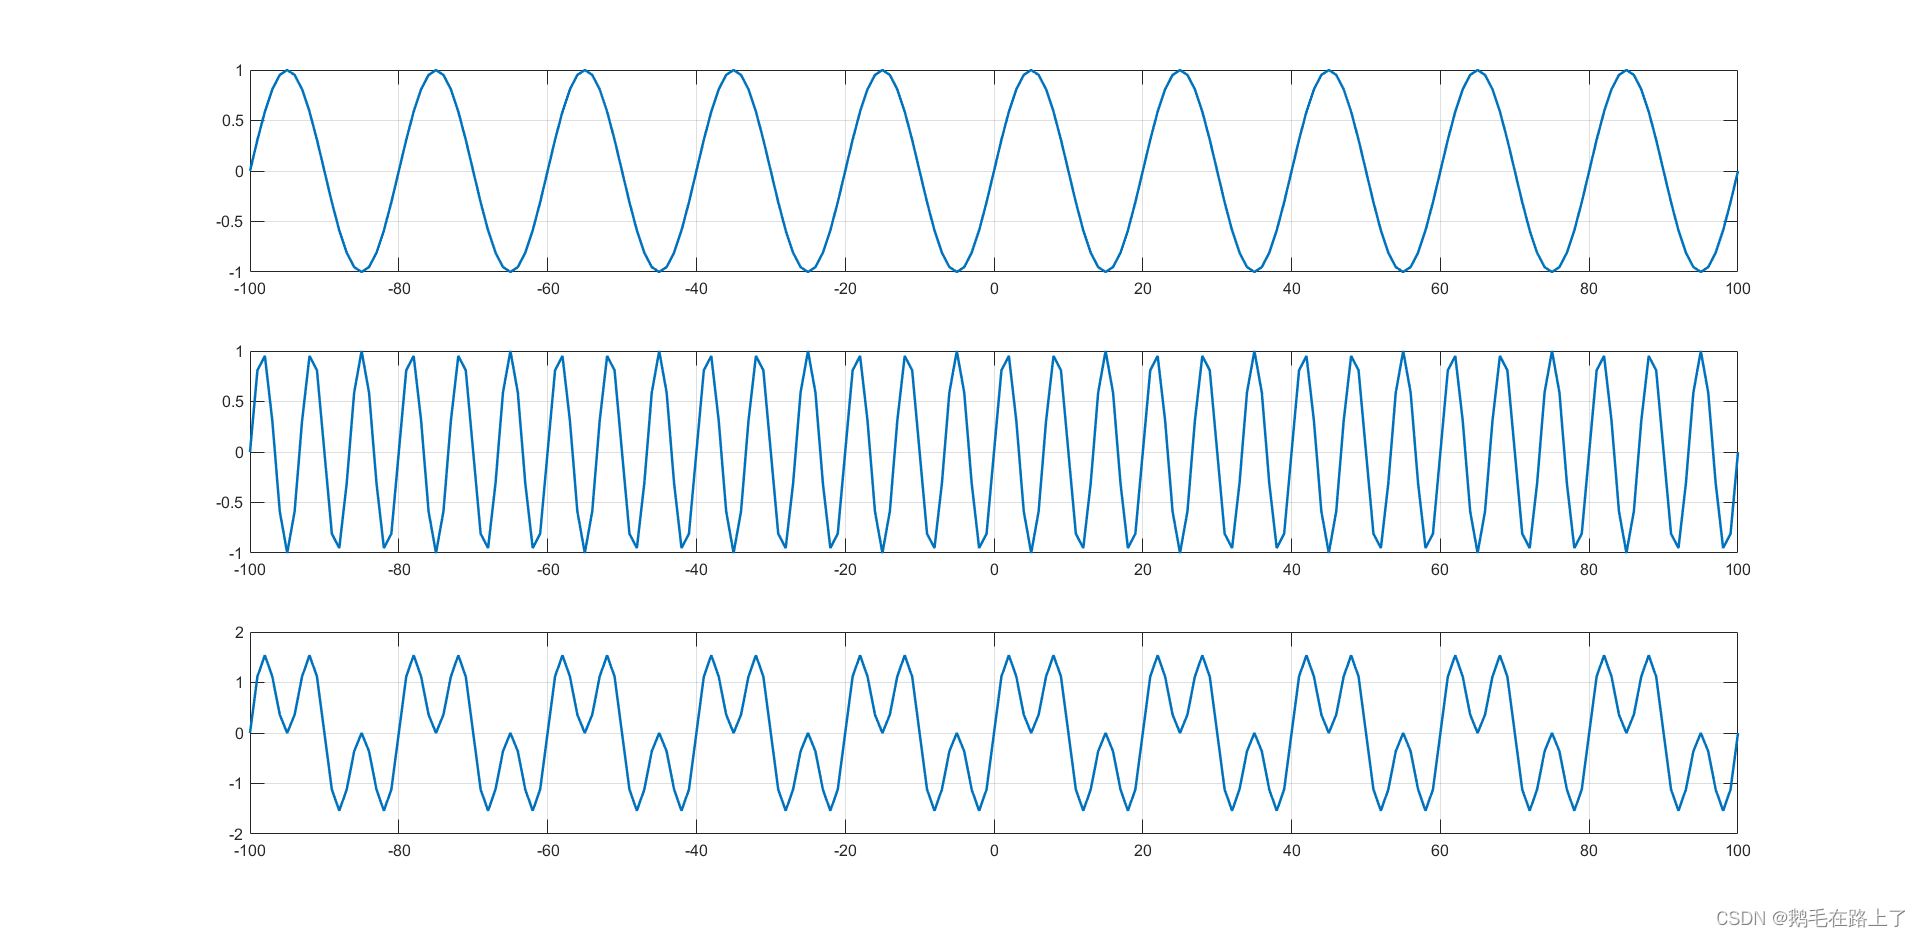
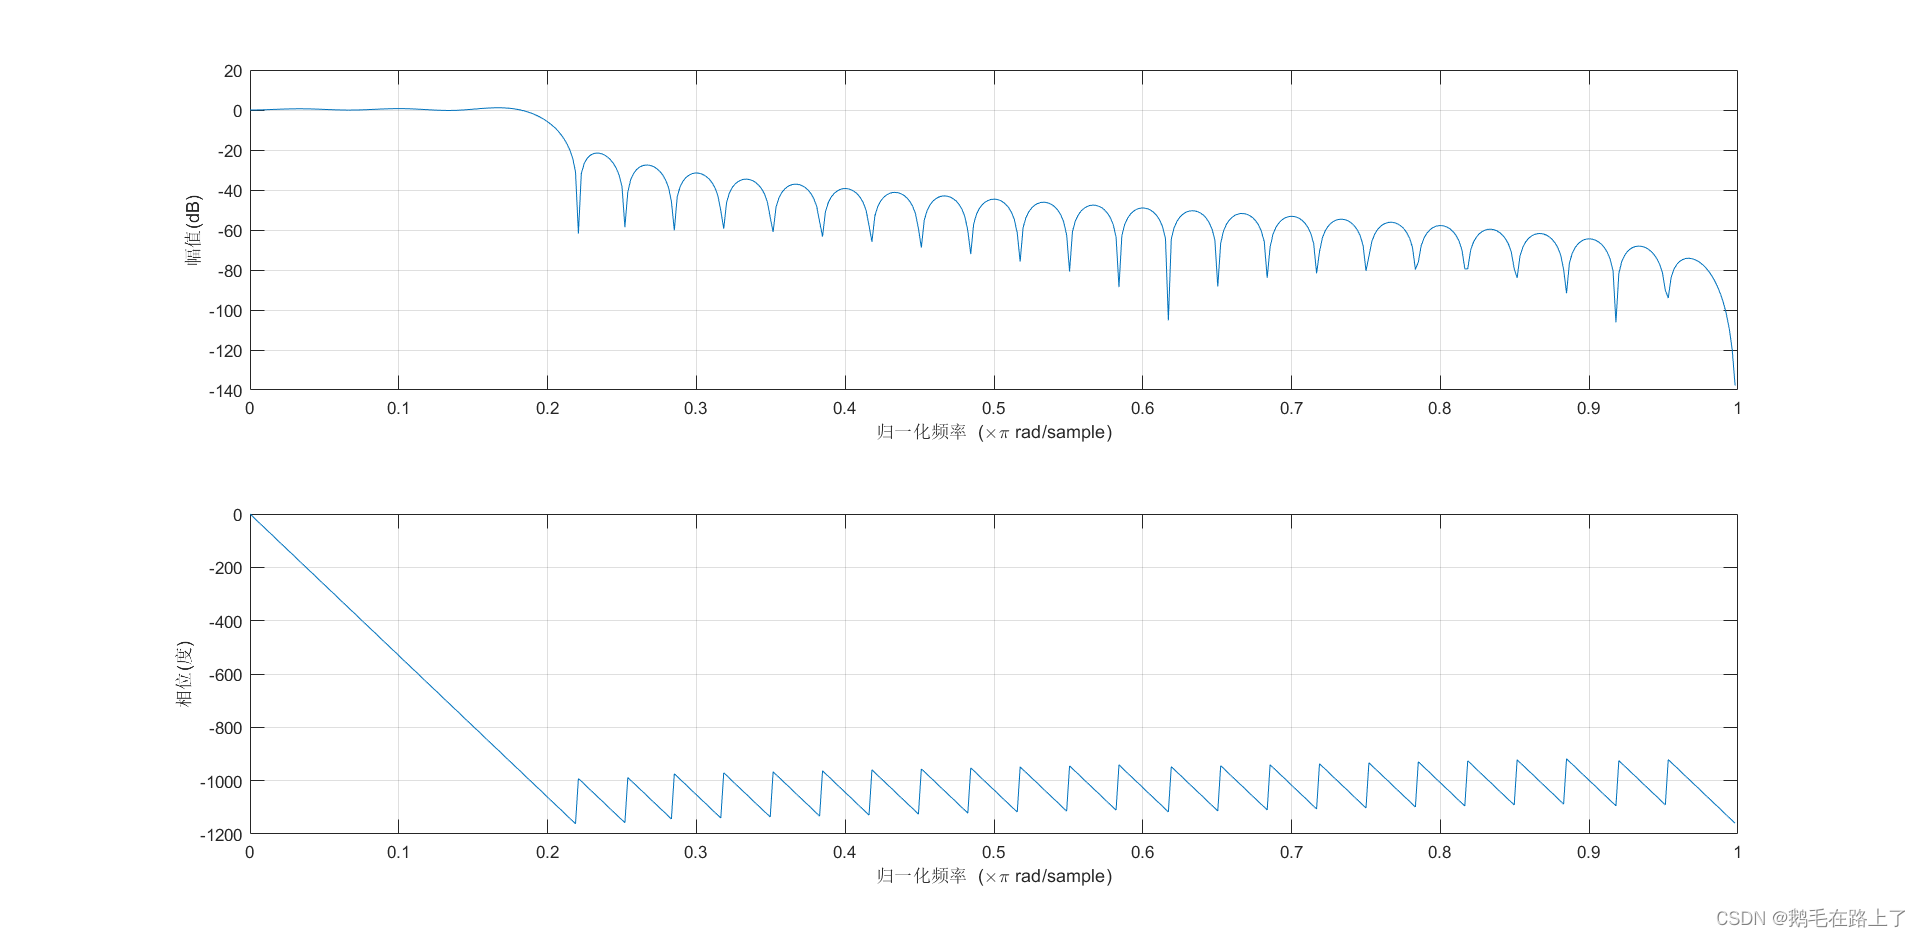
ask : Input signal x Is frequency 0.1 Hz and 0.3 Hz Sum of equal amplitude sine waves , utilize fir1 Function design filter h, Remove 0.3 Hz The sine signal of , Get the output signal y. use freqz Function observation filter h Frequency response of . Display the input signal x And output signal y Waveform of . use fft Function to do fast Fourier transform on the signal , And display the amplitude frequency curve of input and output signals .
answer : The specific steps are as follows , The accuracy can be adjusted by itself ; because 0.1Hz And 0.3Hz The frequency difference is too small , Prone to spectrum leakage :
clc,clear,close all;
t = -100:1:100;
L = length(t);
fs = 2;
x1 = sin(2*pi*0.1.*t/fs);
x2 = sin(2*pi*0.3.*t/fs);
x3 = x1 + x2;
% Time domain signal
figure(1)
subplot(311)
plot(t,x1,"LineWidth",1.5)
grid on
subplot(312)
plot(t,x2,"LineWidth",1.5)
grid on
subplot(313)
plot(t,x3,"LineWidth",1.5)
grid on
% Filter design
wn = 0.2;  % Cut off frequency wn by 0.2pi(0.2Hz),wn = 2pi*f/fs
N = 60;  % Order selection
hn = fir1(N-1,wn,boxcar(N));  %10 rank FIR low pass filter
figure(2)
freqz(hn,1);
figure(3)
y = fftfilt(hn,x3);  % after FIR The signal obtained after the filter
plot(t,y,"LineWidth",1.5)
grid on
% Spectrum analysis
Y = fft(y);  % Of the output signal fft
P2 = abs(Y/L);
P1 = P2(1:L/2+1);
P1(2:end-1) = 2*P1(2:end-1);
f = fs*(0:(L/2))/L;
plot(f,P1,"LineWidth",1.5)
title('Single-Sided Amplitude Spectrum of X(t)')
xlabel('f (Hz)')
ylabel('|P1(f)|')


2. use MATLAB Complete the Fourier transform and draw the transformed waveform
ask :
use MATLAB Calculate the Fourier transform and draw the image
What function tools are used , How to get the image ?
answer : Continuous aperiodic symbolic function sign(t) The result of Fourier transform is as follows :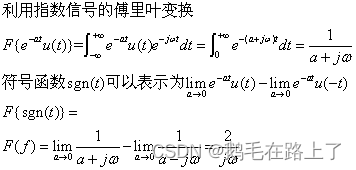
Images :
stay Matlab The images drawn in are actually the result of discrete-time signal processing ( There is no real analog quantity in the computer ), For continuous time signals ( analog signal ) Obtained by sampling approximation , The spectrum obtained here (DFT The obtained discrete spectrum in frequency domain is for continuous spectrum N Point equally spaced sampling ) Taking the continuous envelope is sign(t) After continuous time Fourier transform FT The image after , No longer add from FS、FT To DFS、DTFT、DFT(FFT) The process and relationship , Specific derivation, self reading and research , If you write here, you will spit blood .
clc,clear,close all;
Fs = 1000;                   % Sampling frequency
T = 1/Fs;                    % Sampling period
L = 1500;                    % Length of signal
t = (-1/2*L:1/2*L-1)*T;      % Time vector

% Time domain
y = sign(t);
figure(1)
plot(t,y)
ylim([-2 2])
grid on
title('Time-domain')

%fft Approximate representation ft
Y = fft(y);
P2 = abs(Y/L);
P0 = fftshift(P2);
P1 = P2(1:L/2+1);
P1(2:end-1) = 2*P1(2:end-1);
figure(2)
subplot(211)
plot(P0)
title('Frequency-domain')
xlabel('w')
ylabel('|P2(f)|')
% be based on  P2  And signal length  L  Calculate the unilateral spectrum  P1
subplot(212)
plot(P1)
title('Frequency-domain')
xlabel('w')
ylabel('|P1(f)|')


3. How to design butter worth Coefficients of band stop filter
ask :
The noise is 7000hz, Non noise yes 0-5000hz, Just look at the left half , How should I design it ? See the following design :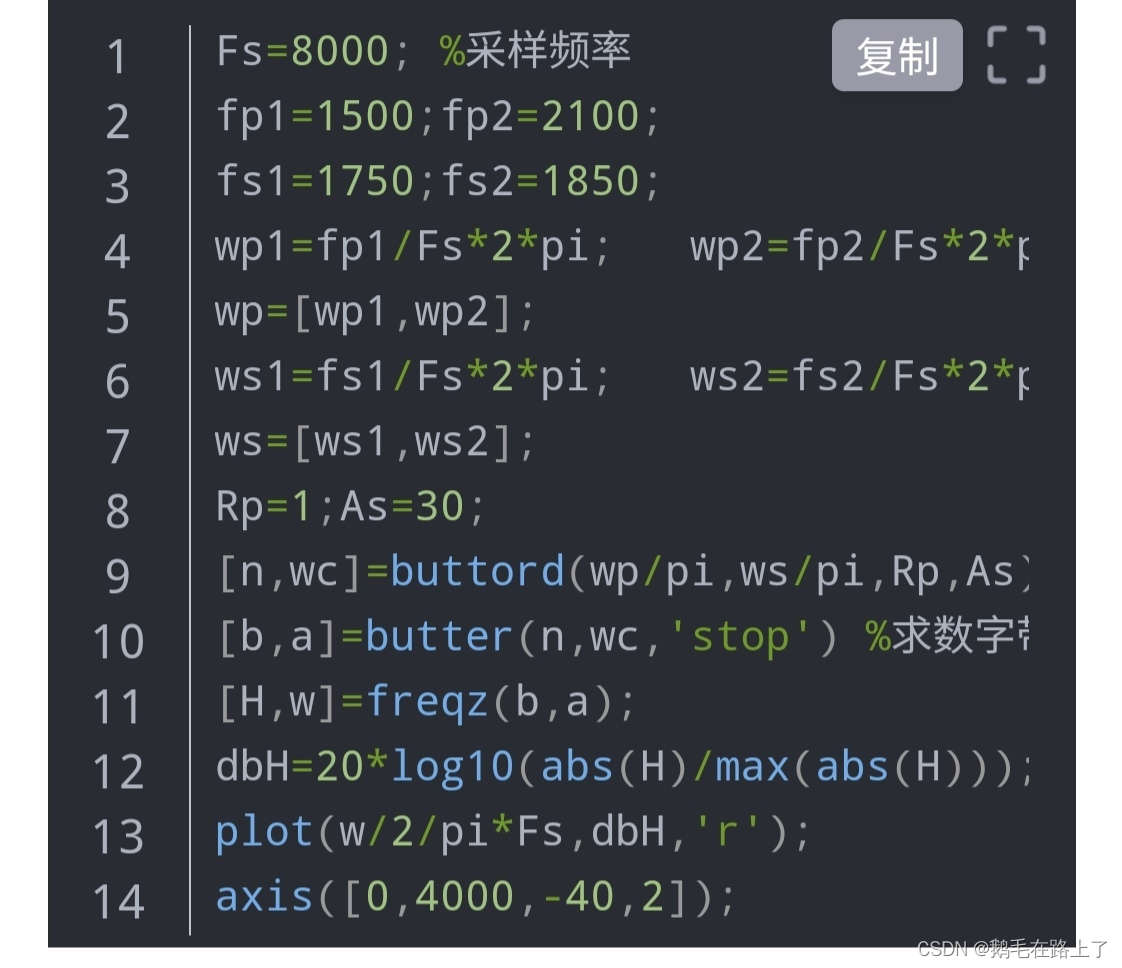

answer :
You want to filter through the band stop filter , The frequency of the noise signal must be within the stopband ; Useful signals are 0~5000Hz, Therefore, the passband cut-off frequency fp1 It can be set to 5500Hz, Stopband starting frequency fs1 Must be less than 7000Hz, Can be set as 6000Hz, Stopband cut-off frequency fs2 Must be greater than 7000Hz, Can be set as 8000Hz, Passband starting frequency fp2 Can be set to 8500Hz, In order to guarantee the Nyquist condition , sampling frequency Fs Can be set as 44100Hz.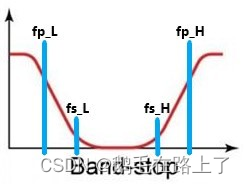
clc,clear,close all;
Fs = 44100;
fp1 = 5500;fp2 = 8500;
fs1 = 6000;fs2 = 8000;
wp1 = fp1/Fs*2*pi;
wp2 = fp2/Fs*2*pi;
wp = [wp1,wp2];
ws1 = fs1/Fs*2*pi;
ws2 = fs2/Fs*2*pi;
ws = [ws1,ws2];
Rp = 1;As = 30;
[n,wc] = buttord(wp/pi,ws/pi,Rp,As);
[b,a] = butter(n,wc,'stop');
freqz(b,a);

0.32π*44100/2π About equal to 7000Hz, It can be seen that the noise frequency falls within the stopband range .
边栏推荐
- What experience is there only one test in the company? Listen to what they say
- Where is the win11 microphone test? Win11 method of testing microphone
- Go basic anonymous variable
- 公司里只有一个测试是什么体验?听听他们怎么说吧
- Convolution和Batch normalization的融合
- PR FAQ, what about PR preview video card?
- Detailed explanation of 'viewpager' in compose | developer said · dtalk
- 95 pages of smart education solutions 2022
- MFC 获取当前时间
- Fudian bank completes the digital upgrade | oceanbase database helps to layout the distributed architecture of the middle office
猜你喜欢
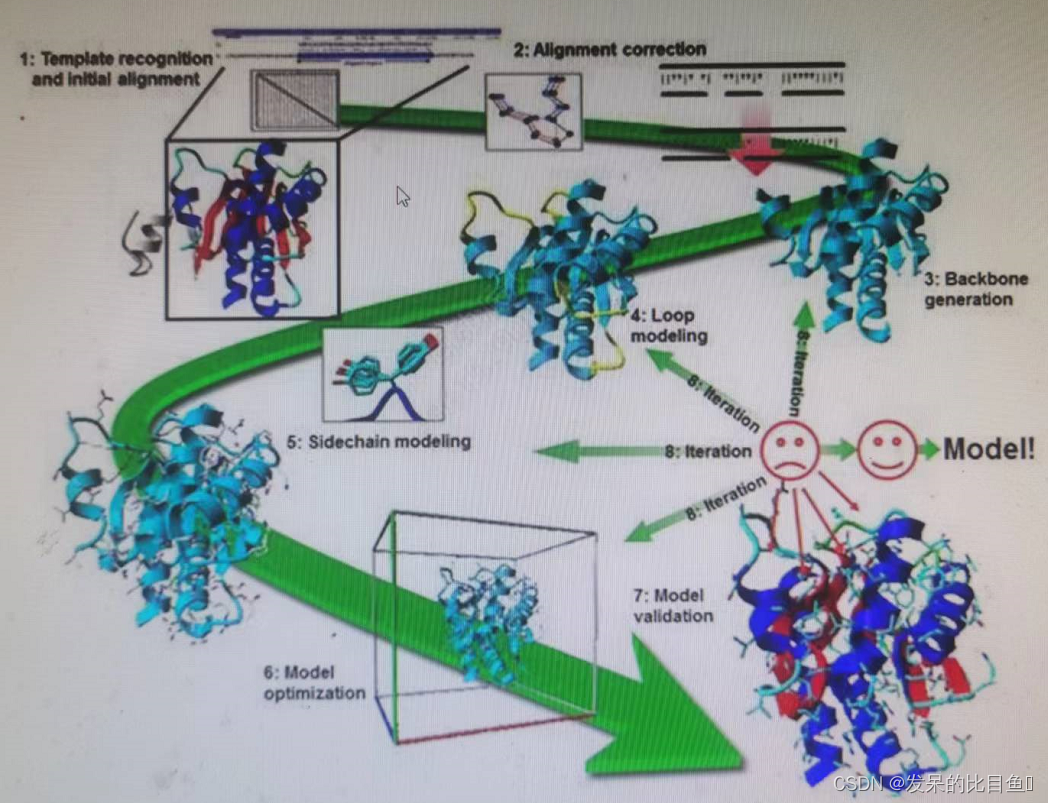
CADD course learning (4) -- obtaining proteins without crystal structure (Swiss model)

Markdown basic grammar

RuntimeError: no valid convolution algorithms available in CuDNN
QT 如何将数据导出成PDF文件(QPdfWriter 使用指南)

95 pages of smart education solutions 2022

基于FPGA的VGA协议实现
【直播预约】数据库OBCP认证全面升级公开课

The privatization deployment of SaaS services is the most efficient | cloud efficiency engineer points north

How to apply for company email when registering in company email format?

Highly available cluster (HAC)
随机推荐
What can I do after buying a domain name?
Wechat applet basic learning (wxss)
流媒体技术优化
JDBC practice cases
php 获取真实ip
Highly available cluster (HAC)
Integration of revolution and batch normalization
Markdown basic grammar
可知论与熟能生巧
Installing redis under Linux
QT 如何将数据导出成PDF文件(QPdfWriter 使用指南)
Where is the win11 microphone test? Win11 method of testing microphone
Develop knowledge points
Maybe you read a fake Tianlong eight
Convolution和Batch normalization的融合
基于Pyqt5工具栏按钮可实现界面切换-2
Top Devops tool chain inventory
采用VNC Viewer方式遠程連接樹莓派
采用VNC Viewer方式远程连接树莓派
JSON数据传递参数