当前位置:网站首页>Gee: explore the characteristics of precipitation change in the Yellow River Basin in the past 10 years [pixel by pixel analysis]
Gee: explore the characteristics of precipitation change in the Yellow River Basin in the past 10 years [pixel by pixel analysis]
2022-07-02 05:11:00 【Gee water ecological space】
Catalog
Preface
GEE, How to analyze the Yellow River Basin 10 Characteristics of precipitation changes in recent years ?
For similar analysis, see :
GEE: Explore the Yellow River Basin 10 Characteristics of vegetation changes over the years 【 Pixel by pixel analysis 】
The areas for this analysis are as follows :
One 、 Analysis steps
Main analysis steps :
Two 、python Code
1、 Load image set
The data set used is : Monthly climate and water balance data set 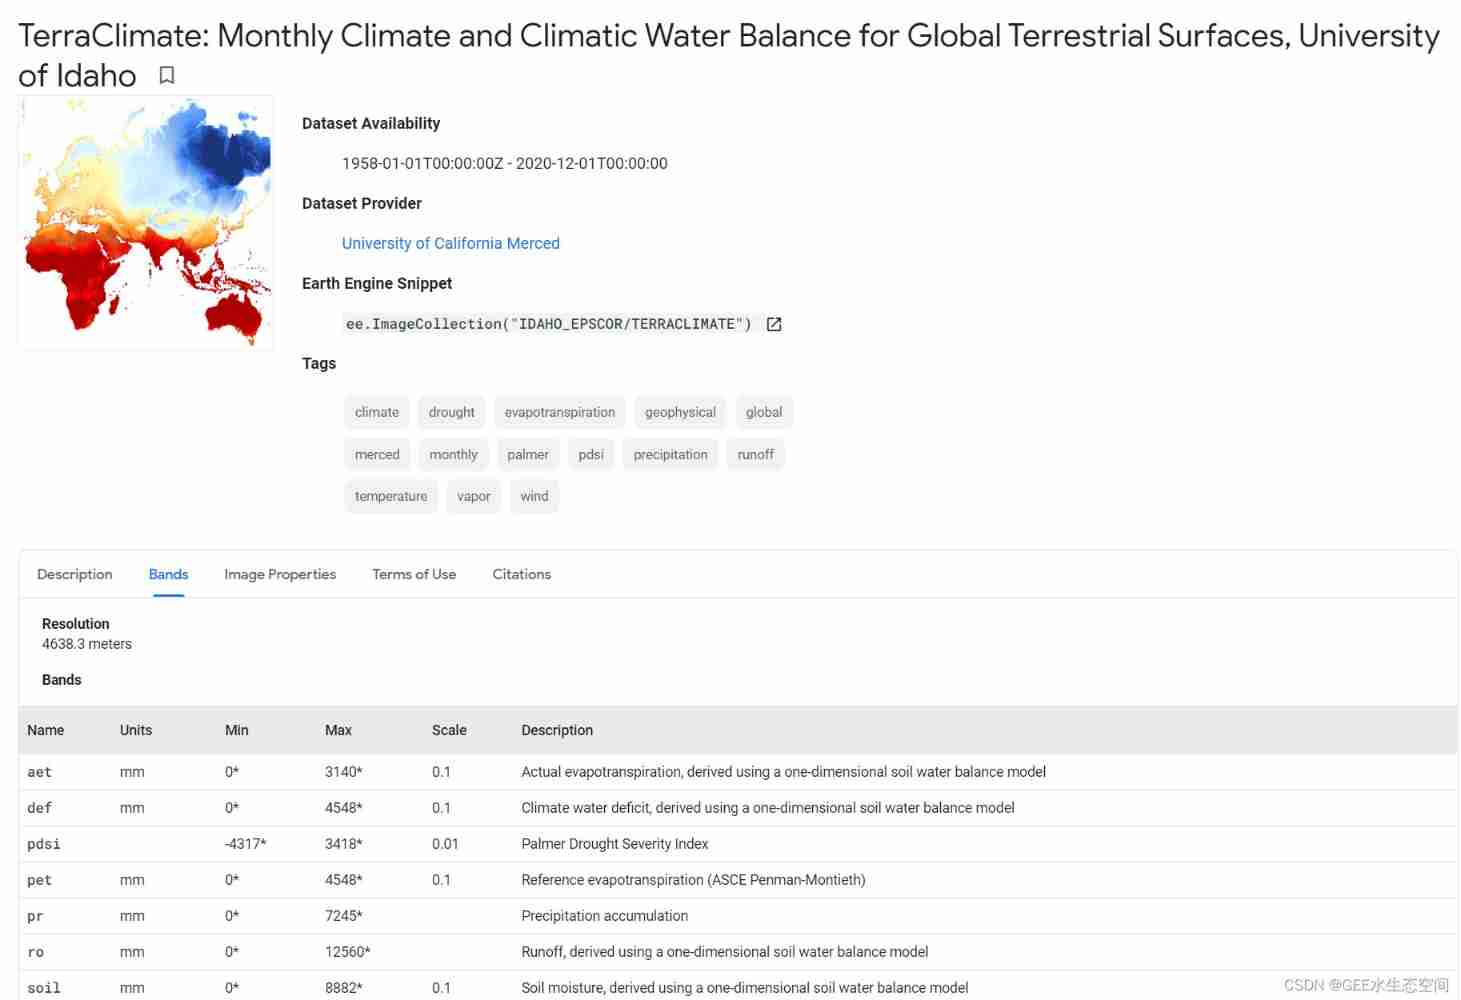
python The code is as follows
#  Add display underlay , Select Gaode map
Map = geemap.Map()
# Map.basemap_demo()
Map.add_basemap('Gaode.Normal')
Map
2、 Characteristics of precipitation variation in the basin
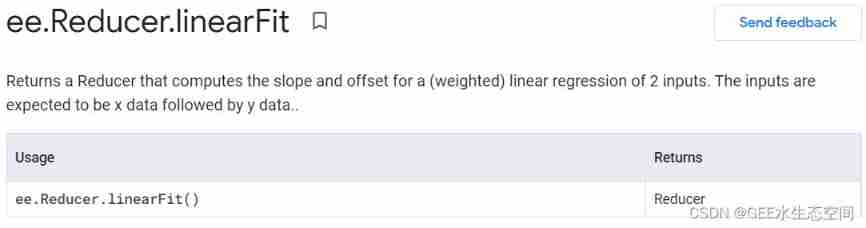
- ee.Reducer.linearFit()
python The code is as follows :
#  Watershed boundary
basin_shp = '../world_basins/worldrivers2/huanghe.shp'
basin_bj = geemap.shp_to_ee(basin_shp)
roi = basin_bj.geometry()

Map.centerObject(roi)
Map.addLayer(ee.Image().paint(roi, 0, 2), {
    'palette':'darkblue'}, 'huanghe')

#  Define and add time band function
def addTime(image):
    return image.addBands(image.metadata('system:time_start').divide(1000 * 60 * 60 * 24 * 365))

#  Add dataset , Add time band
collection = ee.ImageCollection('IDAHO_EPSCOR/TERRACLIMATE') \
    .filterDate('2010-01-01', '2020-12-31') \
    .map(addTime)

#  Select the band used for linear trend prediction
trend = collection.select(['system:time_start', 'pr']) \
    .reduce(ee.Reducer.linearFit()) \
    .clip(roi)

# Rendering display
visualization = {

    'max':3,
    'min':-3,
    'palette': ['b30000','d7301f','ef6548','fc8d59','fdbb84','fdd49e','fee8c8','f7fcf0','e0f3db','ccebc5','a8ddb5','7bccc4','4eb3d3','2b8cbe','0868ac']
}
#  Slope change of precipitation , reflect 20 The change trend of the increase or decrease of precipitation in the basin in recent years
Map.addLayer(trend.select('scale'),visualization, 'huanghe_pre')
Map
give the result as follows :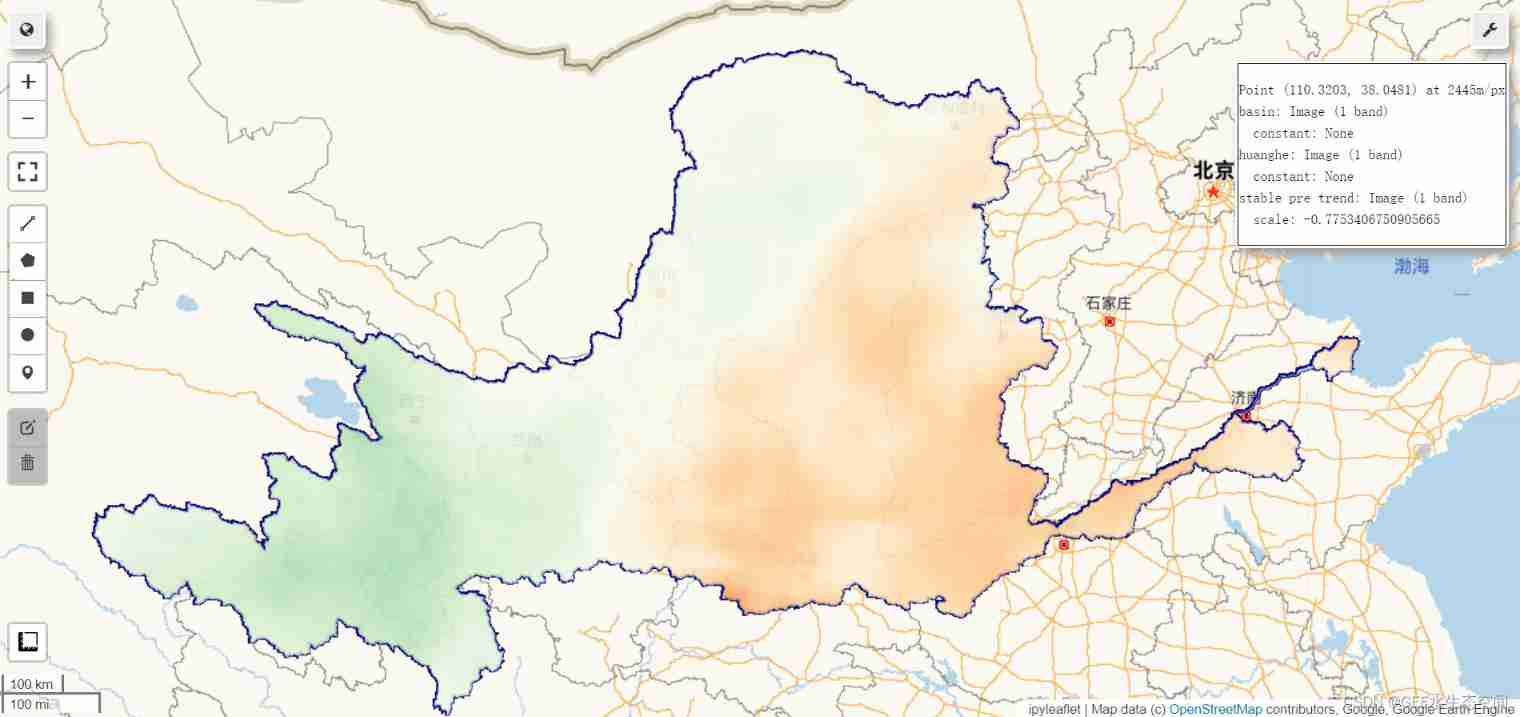
3、 ... and 、 The question of contrast
Here I quote another blog post about the analysis of annual precipitation , Compare the difference between the two calculation results , Its python The code is as follows :
#  Modify from "GEE(Python) Pixel by pixel linear fitting " Of code
# Join the research area
study_area = basin_bj

# Add function of time band
def createTimeBand(img):
    date = img.metadata("date").subtract(2010)
    return date.rename("year").clip(study_area).addBands(img)

# Traverse to obtain monthly precipitation data , And the total annual precipitation is calculated circularly , Deposit in list in
datalist=ee.List([])
year=2010
for i in range(10):
    datalist=datalist.add(ee.ImageCollection("IDAHO_EPSCOR/TERRACLIMATE") \
        .filter(ee.Filter.date(ee.Date(str(year)+"-01-01"), ee.Date(str(year+1)+"-01-01"))) \
        .select('pr')\
        .sum()\
        .clip(study_area)\
        .set("date",ee.Number(year)))
    year += 1

# take list To ImageCollection
varyCollection = ee.ImageCollection.fromImages(datalist)
trend = varyCollection.map(createTimeBand) \
    .reduce(ee.Reducer.linearFit()) # Linear regression for each pixel

print(trend.getInfo())

# Rendering display
visualization = {

    'max':3,
    'min':-3,
    'palette': ['b30000','d7301f','ef6548','fc8d59','fdbb84','fdd49e','fee8c8','f7fcf0','e0f3db','ccebc5','a8ddb5','7bccc4','4eb3d3','2b8cbe','0868ac']
}
Map.addLayer(trend.select('scale'),visualization,'yearly pre trend')
# Map.centerObject(roi)
Map
give the result as follows : Comparison and analysis of the difference between the two calculation results :
- It can be seen that , The results of the two calculations are the same in the general trend , Both show that the precipitation in the eastern region is decreasing , And the precipitation in the western region is increasing .
- However, there are obvious differences in the variation of precipitation . The same place, such as Point (110.8477, 38.0308) It's about , The slope change of precipitation at this pixel fitted by the previous code is -0.85, The slope of the annual total is -12.5, The two are poor 1 An order of magnitude .
- It is preliminarily felt that the annual change rate is 12mm/a The change of is not in line with the actual situation , If so ,10 Decreased in 120mm, It's a little too exaggerated .
Four 、 Summary and discussion
- adopt MODIS Long time series precipitation changes , The temporal and spatial variation characteristics of precipitation in the basin are explored
- Should grasp ee.Reducer.linearFit() Function usage , This function is 2 Output of parameters , Respectively scale( Slope ) and offset( intercept ), Can pass scale We can see the evolution trend of regional vegetation .
- Problems to be explored , Before using linear analog functions , First, the data is processed by adding time bands , The time obtained is metadata in system:time_start Time , This value is converted in years , It is understood that the millisecond unit is converted to the year unit , But why is it different from the result calculated completely according to the total annual precipitation ? What's the problem ? Hope to discuss in the comment area .
Reference resources :
- https://developers.google.com/earth-engine/guides/ic_reducing
- https://blog.csdn.net/alley51775/article/details/121708658?spm=1001.2014.3001.5502
边栏推荐
- Global and Chinese market of cell culture freezers 2022-2028: Research Report on technology, participants, trends, market size and share
- Essence and physical meaning of convolution (deep and brief understanding)
- Mathematical knowledge -- understanding and examples of fast power
- Using Kube bench and Kube hunter to evaluate the risk of kubernetes cluster
- Change deepin to Alibaba image source
- Global and Chinese market of travel data recorder (VDR) 2022-2028: Research Report on technology, participants, trends, market size and share
- A new attribute value must be added to the entity entity class in the code, but there is no corresponding column in the database table
- Leetcode basic programming: array
- [common error] the DDR type of FPGA device is selected incorrectly
- Typescript function details
猜你喜欢


随机推荐
Feign realizes file uploading and downloading
2022 Alibaba global mathematics competition, question 4, huhushengwei (blind box problem, truck problem) solution ideas
Pytest learning ----- pytest Interface Association framework encapsulation of interface automation testing
Precipitate yourself and stay up late to sort out 100 knowledge points of interface testing professional literacy
4. Flask cooperates with a tag to link internal routes
10 minute quick start UI automation ----- puppeter
Getting started with pytest ----- confitest Application of PY
数学知识(欧拉函数)
Creation and destruction of function stack frames
Splice characters in {{}}
Summary of MySQL key challenges (2)
Line by line explanation of yolox source code of anchor free series network (7) -- obj in head_ loss、Cls_ Loss and reg_ Calculation and reverse transmission of loss I
Pytest learning ----- pytest assertion of interface automation testing
CubeMx DMA笔记
Analyzing the hands-on building tutorial in children's programming
About PROFIBUS: communication backbone network of production plant
leetcode两数相加go实现
Application d'un robot intelligent dans le domaine de l'agroécologie
How to configure PostgreSQL 12.9 to allow remote connections
Super detailed pycharm tutorial