当前位置:网站首页>Microsoft planetary computer (MPC) platform introduction, registration and comparison
Microsoft planetary computer (MPC) platform introduction, registration and comparison
2022-06-24 18:40:00 【Geographical space of ruiduobao】
1. Platform profile
1.1 Introduce
Microsoft Planetary Computer ( hereinafter referred to as MPC), It's a service for Environmental Science Sustainability and Earth science Research cloud computing platform . The platform was developed by Microsoft , It is currently in the internal testing stage , Users can obtain permission through simple application .

MPC It's made up of four main parts :
Data sets :PB Level of geoscience data , Hosted in Azure On , And provide users with free use .
Data search : Users can search for relevant data across space and time API.
Data processing : A fully managed computing environment , Enable scientists to process a large number of geospatial data sets .
Related applications : Applications developed by Microsoft and related partners , Directly callable .
The information of the platform can be viewed from the official promotional video :
1.2 Development support
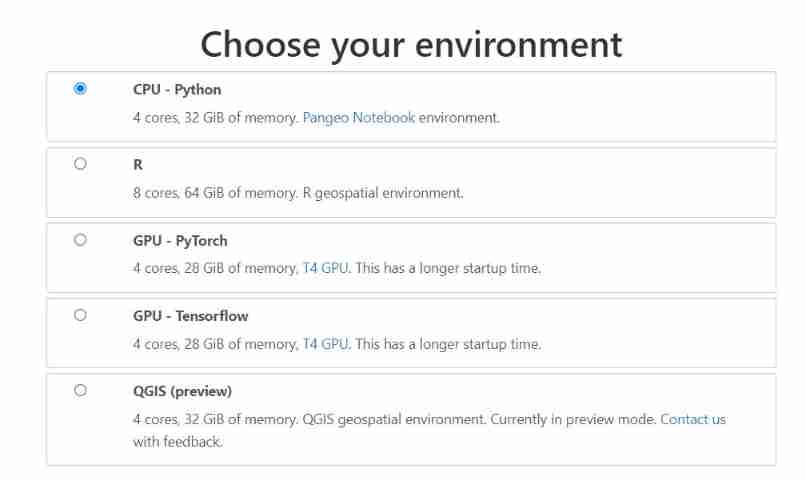
at present MPC Support JavaScript、Python、R Three development languages , And it's based on Tensorflow、PyTorch、Qgis And other virtual development environments . Locally available VS code Develop accordingly :
1.3 Existing data sets
at present MPC There is relatively little data , So I have listed all the data I have :
Biodiversity:
HGB: Harmonized Global Biomass for 2010(300m Resolution 2010 Annual biomass density map )
MoBI: Map of Biodiversity Importance( Of the American continent 2216 Habitat of endangered species )
DEM:
ALOS World 3D-30m(ALOS Satellite acquired global 30m The resolution of the DEM)
Copernicus DEM GLO-30( Copernicus' global plan 30m The resolution of the DEM)
Copernicus DEM GLO-90( Copernicus' global plan 90m The resolution of the DEM)
NASADEM HGT v001( The global 30m Of DEM)
USGS 3DEP Seamless DEMs(1 To 60 Meter resolution of the United States DEM)
Fire:
MTBS: Monitoring Trends in Burn Severity( Us fire severity products )
Imagery:
ASTER L1T
GOES-R Cloud & Moisture Imagery( Cloud and water vapor imaging products )
Landsat 8 Collection 2 Level-2(Landsat Second level product of )
NAIP: National Agriculture Imagery Program( Contains high-resolution aerial images )
Sentinel-2 Level-2A( The secondary product of sentry satellite )
Infrastructure:
HREA: High Resolution Electricity Access( Light data ,VIIRS Satellite images capture global power )
Land use/Land cover:
Esri 10-Meter Land Cover( The global 10m Land cover )
USGS Gap Land Cover( Land cover in the United States )
Water:
JRC Global Surface Water( be based on Landsat Global water bodies )
2. register
Enter the official , Link to :https://planetarycomputer.microsoft.com/

Click to enter Explore Interface , Select the data you are interested in , I chose sentinel data here

Click to enter an image , Select the brackets that represent the encoding , A calling code will pop up , Click again on the Launch Hub:

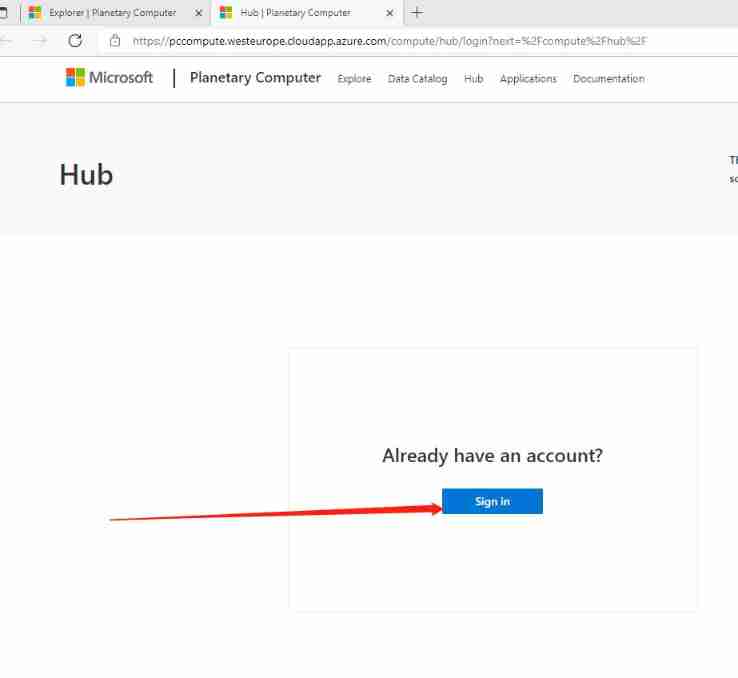
At this time, choose to log in with Microsoft account ( The default is your computer Microsoft account number ), If you don't have a Microsoft account, you can register a Microsoft account first :
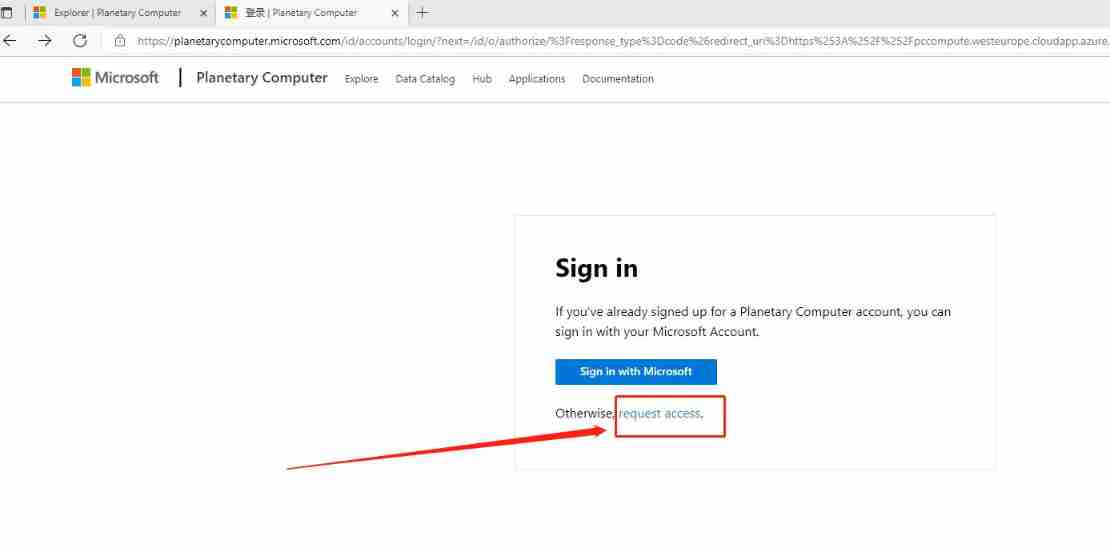
at present MPC It's in the internal test stage , Use MPC You need to apply for permission , Click on request access:
Fill in personal information , This should be filled in according to the real information :

After filling in , Submit , The submitted information will be displayed , Generally wait One day You can get permission by left or right . If you don't have permission , You can send an email to the official , Express your willingness to use the platform .

Last , After passing the application , You can enter MPC Code :

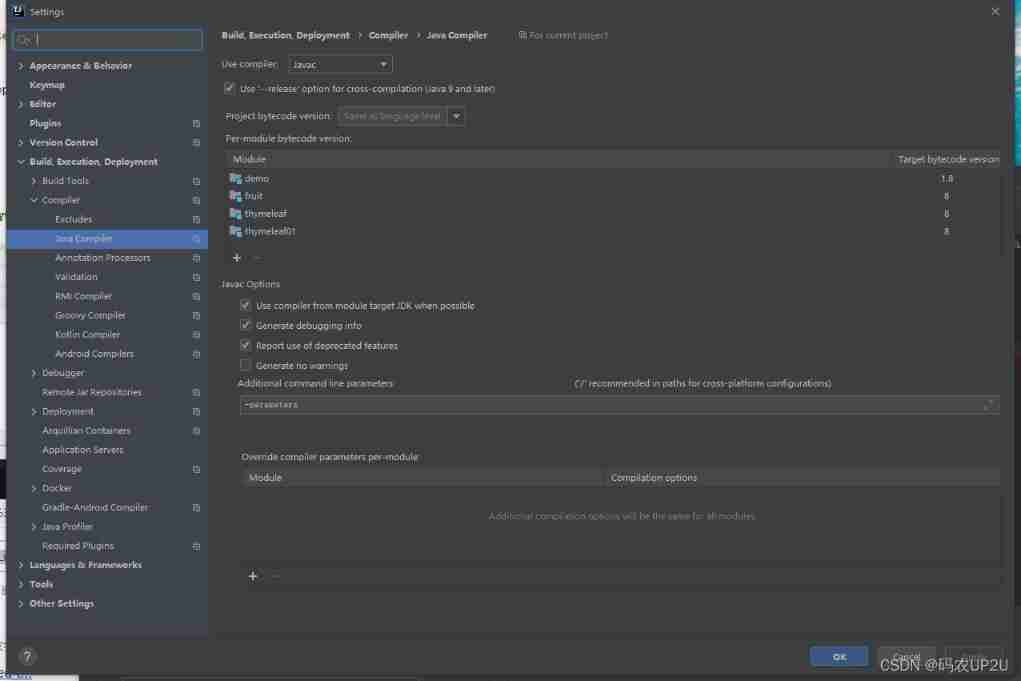
If you are not used to online operation , You can also use VS code Make local configuration ( They are all products of Microsoft , Good support ):

3. Platform comparison
At present, remote sensing cloud computing platforms are emerging , Has begun to change the way remote sensing data are processed . I have simply sorted out the following four platforms , As shown below :
| platform | Google Earth Engine(GEE) | PIE-Engine(PIE) | Microsoft Planetary Computer(MPC) | ESA-USGS |
|---|---|---|---|---|
| manufacturer | Space grand plan | Microsoft | esa 、 U.S. Geological Survey | |
| Public measurement time | 2015 year | 2020 year | Internal testing stage , Not yet in public beta | The development phase |
| Official programming language | JavaScript、Python | JavaScript、Python | JavaScript、Python、R | No information |
| Number of data sets | 495 Data sets | 143 Data sets | 17 Data sets | No information |
| network connections | Need scientific Internet | Direct connection | Direct connection | No information |
| remarks | The pioneer of remote sensing cloud computing | Domestic independent controllable | Focus on climate change and earth protection | No information |
The number of data sets comes from the official website , Through data sets HTML Count the number of tags ( By the time :2021 year 12 month 20 Japan ). among ESA-USGS Remote sensing cloud computing platform is the news released this year , It's currently in the development phase , The official online time is unknown .
4. At the end
(1)MPC, Backed by international manufacturers , It can ensure a high degree of completion of this platform . It is not directly related to GEE For standard , Instead, find your own starting point : Global environmental change .
(2) in consideration of GEE There have been , It is easy to apply through the user at the beginning , At present, the application is rather cumbersome . If readers are interested in studying remote sensing Cloud Computing , Register as soon as possible MPC.
(3) You can go to “ Geoscience remote sensing data collection ”(www.gisrsdata.com) Get more data .
边栏推荐
- "2022" plans to change jobs and raise salary. It is necessary to ask interview questions and answers - browser
- Selection (031) -cool_ How long can secret be accessed?
- About pyqt5 to realize paging function (one window implements different interfaces)
- JS deep understanding of functions
- Bigdecimalavoiddoubleconstructorrule: do not directly use the double variable as a parameter to construct BigDecimal
- 香港服务器租用错误可能导致严重后果
- 如何在 R 中创建线性模型预测区间 并可视化
- 25.sql statement differentiation
- 2022 network security C module of the secondary vocational group scans the script of the surviving target aircraft (municipal, provincial and national)
- 【leetcode】838. Push domino (Analog)
猜你喜欢
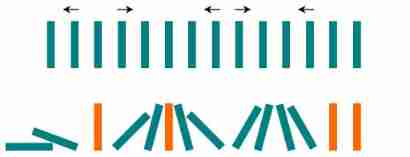
【leetcode】838. Push domino (Analog)
DOM (document object model)

About pyqt5 to realize paging function (one window implements different interfaces)
Millions of dollars worth of NFT were stolen in the attack, and Google issued an emergency warning to 3.2 billion users worldwide | February 21 global network security hotspot
Get the actual name of the method parameter through the parameter

360 digital released information security trends in January: 120000 fraud risks were captured and users were reminded 2.68 million times
Paper sharing | self supervised learning paper jointly released by Yann Lecun and read by engineers

What is decision intelligence?

Business leaders compete for CIO roles

SAP license: ERP for supply chain management and Implementation


随机推荐
Redis series (3) - sentry highly available
Wechat applet to realize stacked rotation
Mariana Trench, Facebook's open source code analysis tool
面试算法 - 字符串问题总结
Navigator object
Recommend a distributed JVM monitoring tool, which is very practical!
2022 network security C module of the secondary vocational group scans the script of the surviving target aircraft (municipal, provincial and national)
Why are more and more people studying for doctors? Isn't it more and more difficult to graduate a doctor?
Redpacketframe and openmode packages
What are the grades of financial products?
Complete Guide to web application penetration testing
25.sql statement differentiation
Some knowledge of the beginning of 2022
Huitongda officially landed at the Hong Kong Stock Exchange: the gross profit margin continued to decline, and the book value of several shareholders still suffered losses
JDBC writes Chinese garbled code to the database
How to perform power regression in R
How MySQL works - Chapter 14
Analysis on the issue of raising the right of MSSQL in 2021 secondary vocational group network security competition in Shandong Province
Architecture decryption from distributed to microservice: several common microservice architecture schemes
微服务系统设计——子服务项目构建