当前位置:网站首页>The monitoring of Doris study notes
The monitoring of Doris study notes
2022-07-31 04:56:00 【coder_szc】
背景
Doris可以使用Prometheus和GrafanaMonitor and collect,Official website to download the latest version.
- Prometheus官网下载:https://prometheus.io/download/;
- Grafana官网下载:https://grafana.com/grafana/download.
Doris的监控数据通过FE和BE的http接口向外暴露.监控数据以key-valueThe text form of external show.每个keyThere could be differentLabel加以区分.When a user build goodDoris 后,可以在浏览器,Through the following interface to access monitoring data:
- Frontend: fe_host:fe_http_port/metrics,如http://scentos:8030/metrics;
- Backend: be_host:be_web_server_port/metrics,如 http://scentos:8040/metrics
The whole monitoring architecture below:
Prometheus
首先下载压缩包(https://github.com/prometheus/prometheus/releases/download/v2.26.0/prometheus-2.26.0.linux-amd64.tar.gz),上传,解压,重命名:
[[email protected] szc]# tar -zxvf prometheus-2.26.0.linux-amd64.tar.gz
[[email protected] szc]# mv prometheus-2.26.0.linux-amd64/ prometheus-2.26.0/
[[email protected] szc]# cd prometheus-2.26.0/
修改prometheus.yml,配置两个targets,分别表示FE和BE,并定义labels和groups:
[[email protected] prometheus-2.26.0]# vim prometheus.yml
...............
scrape_configs:
  # The job name is added as a label `job=<job_name>` to any timeseries scraped from this config.
  - job_name: 'prometheus-doris'


    # metrics_path defaults to '/metrics'
    # scheme defaults to 'http'.


    static_configs:
    - targets: ['scentos:8030']
      labels:
          group: fe
    - targets: ['scentos:8040']
      labels:
          group: be
启动Prometheus:
[[email protected] prometheus-2.26.0]# nohup ./prometheus --config.file=./prometheus.yml
在浏览器访问ip:9090,并查看Status->Targets:
便可以看到FE和BE已经上线:
点击一个,结果如下:
Grafana
Download and install and start the:
[[email protected] szc]# wget https://dl.grafana.com/enterprise/release/grafana-enterprise-7.5.2-1.x86_64.rpm
[[email protected] szc]# yum install grafana-enterprise-7.5.2-1.x86_64.rpm
[[email protected] szc]# service grafana-server start
访问ip:3000,用户名密码都是admin: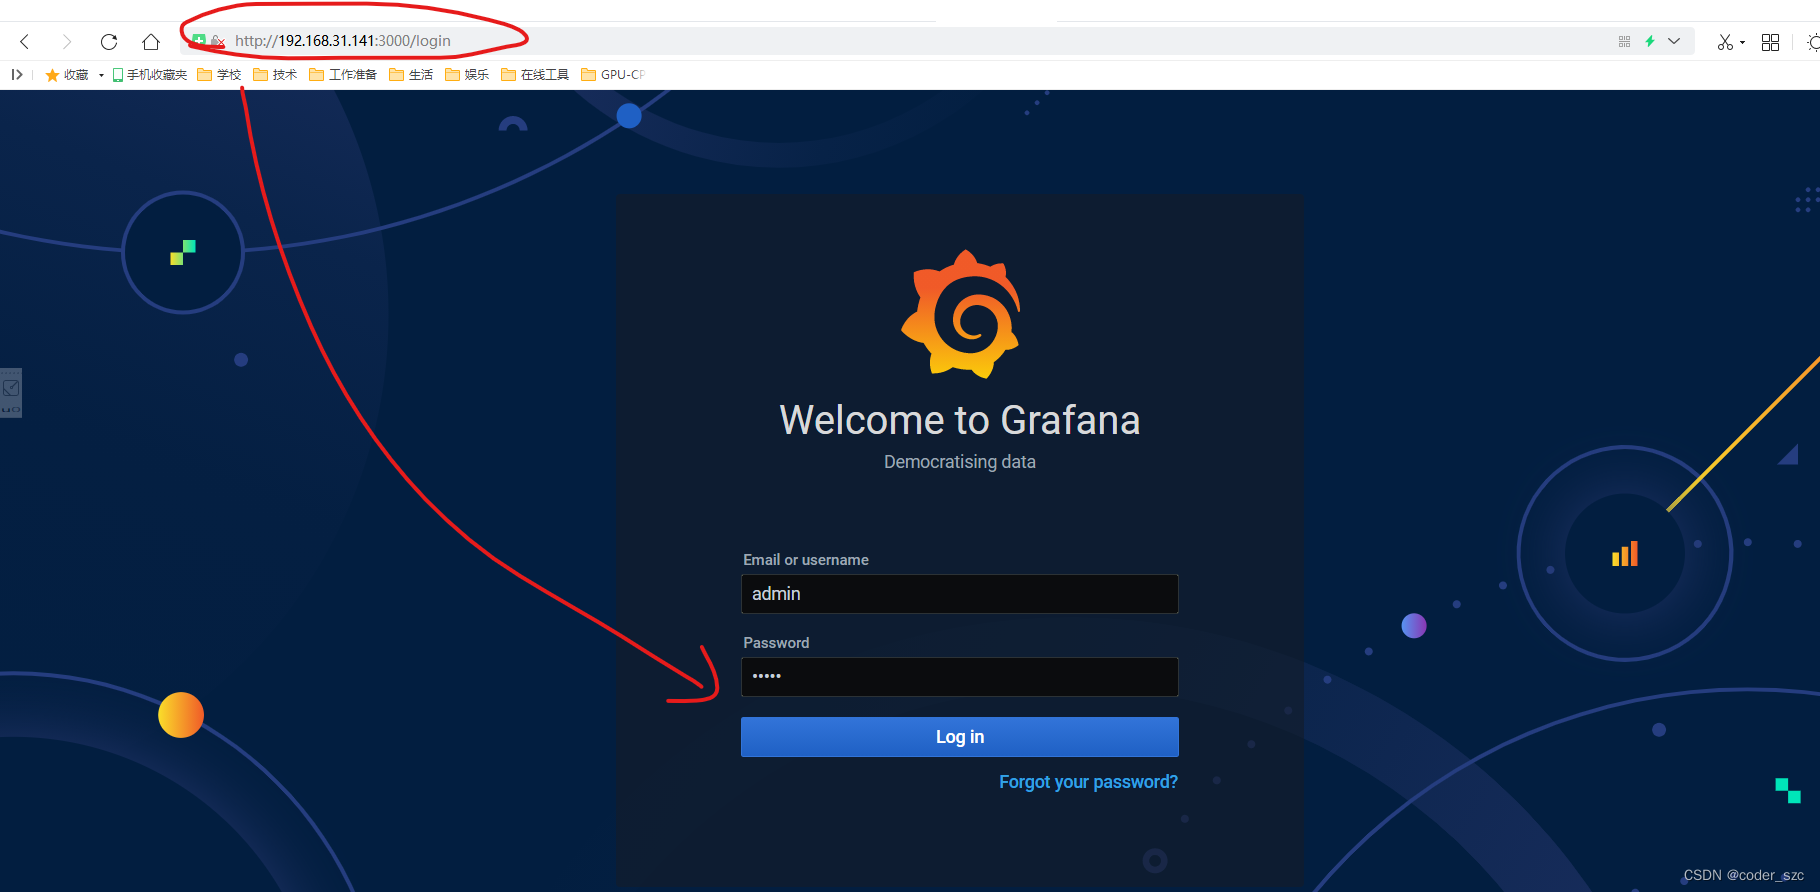
第一次访问要修改密码,不过可以点击下面的skip跳过这一步,就进入grafana的主界面: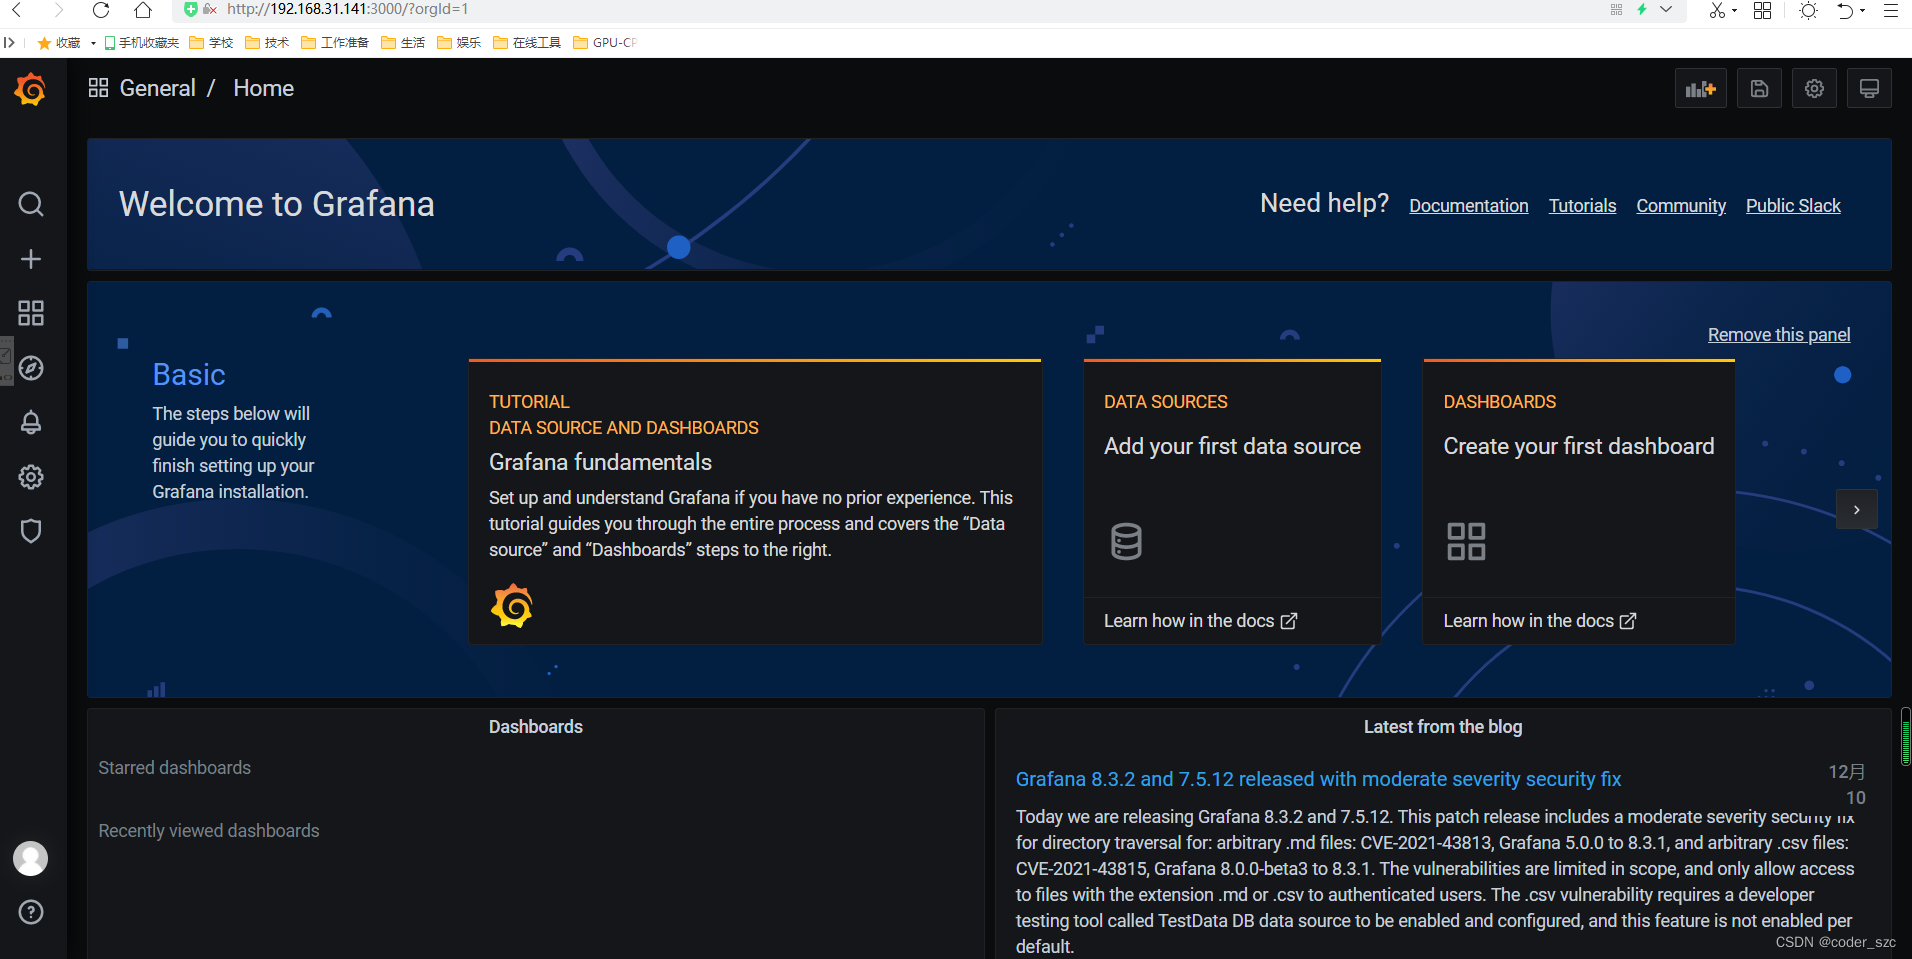
然后,添加数据源: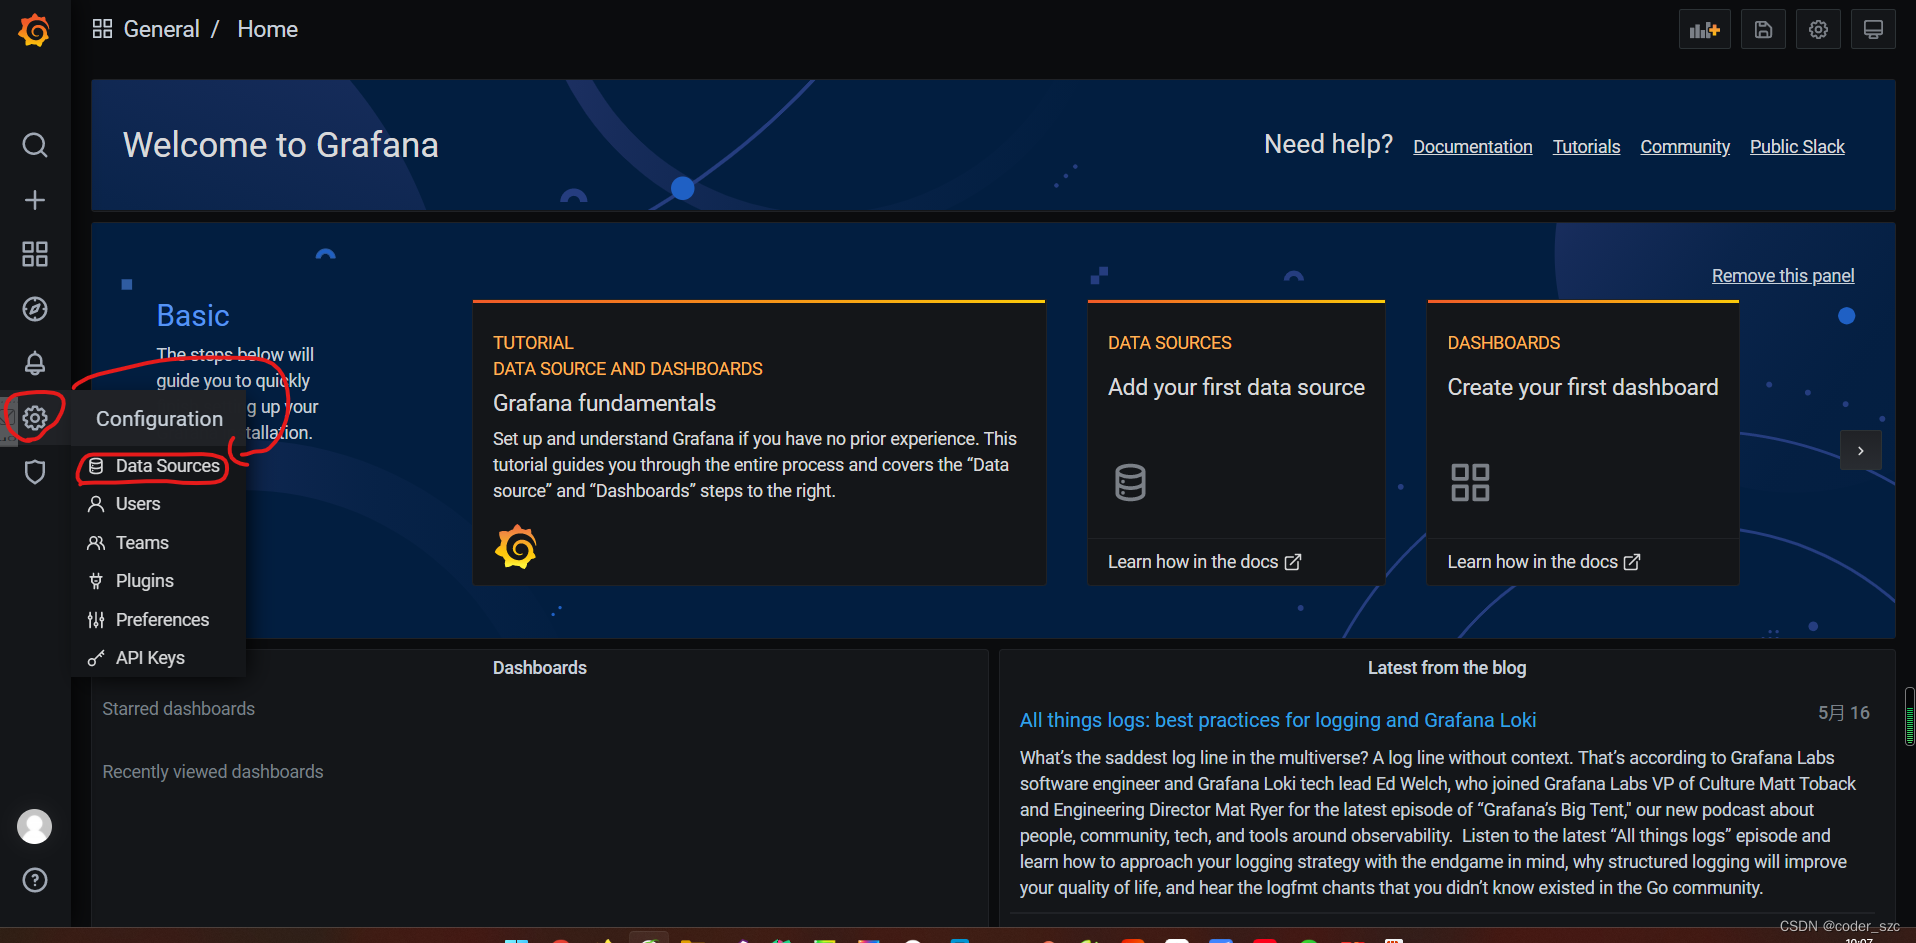

选中Prometheus,点击Select,然后配置URL即可:
Click the save and test below,A data source is normal: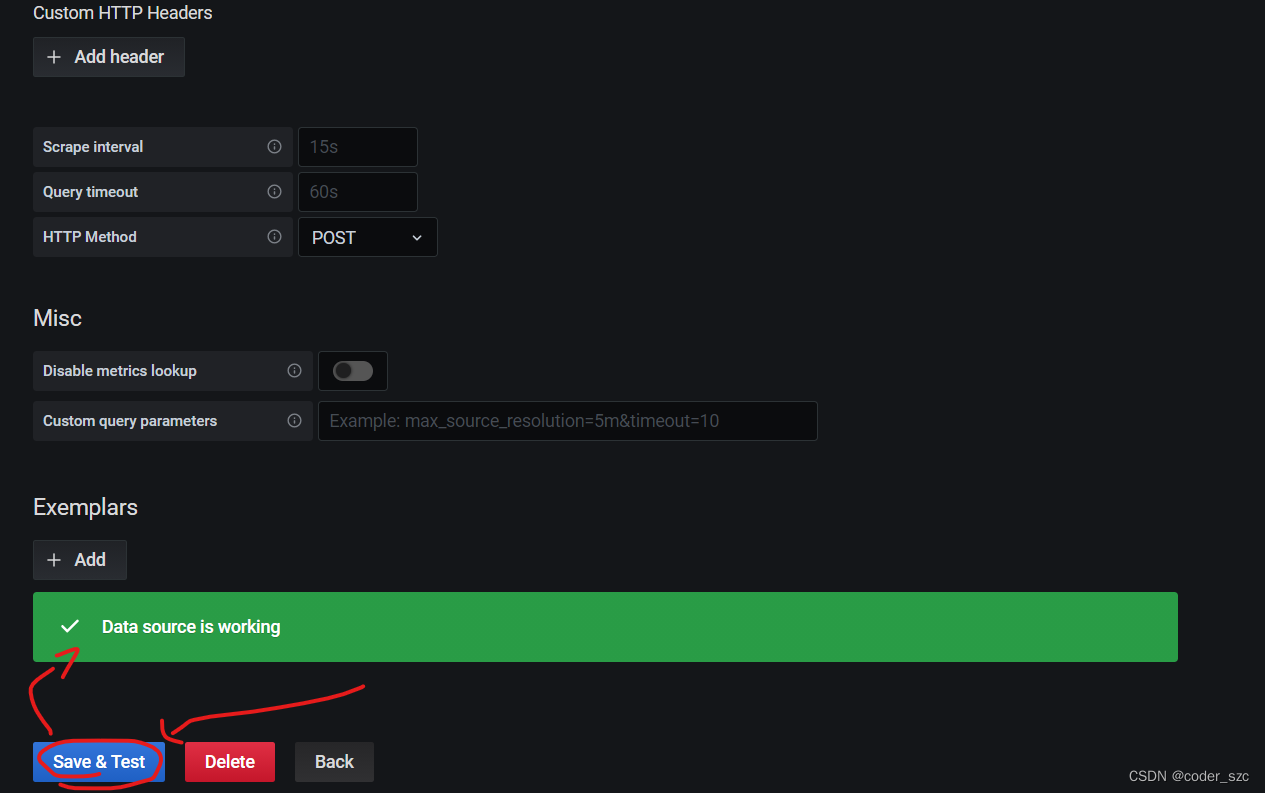
然后添加Dashboard,点击导入: 通过面板jsonImport the content of the need to enter in the see baidu network location:链接:https://pan.baidu.com/s/1OTaQd3CZSSKmsJFwhn6HrQ ,提取码:y4p1
再点击加载: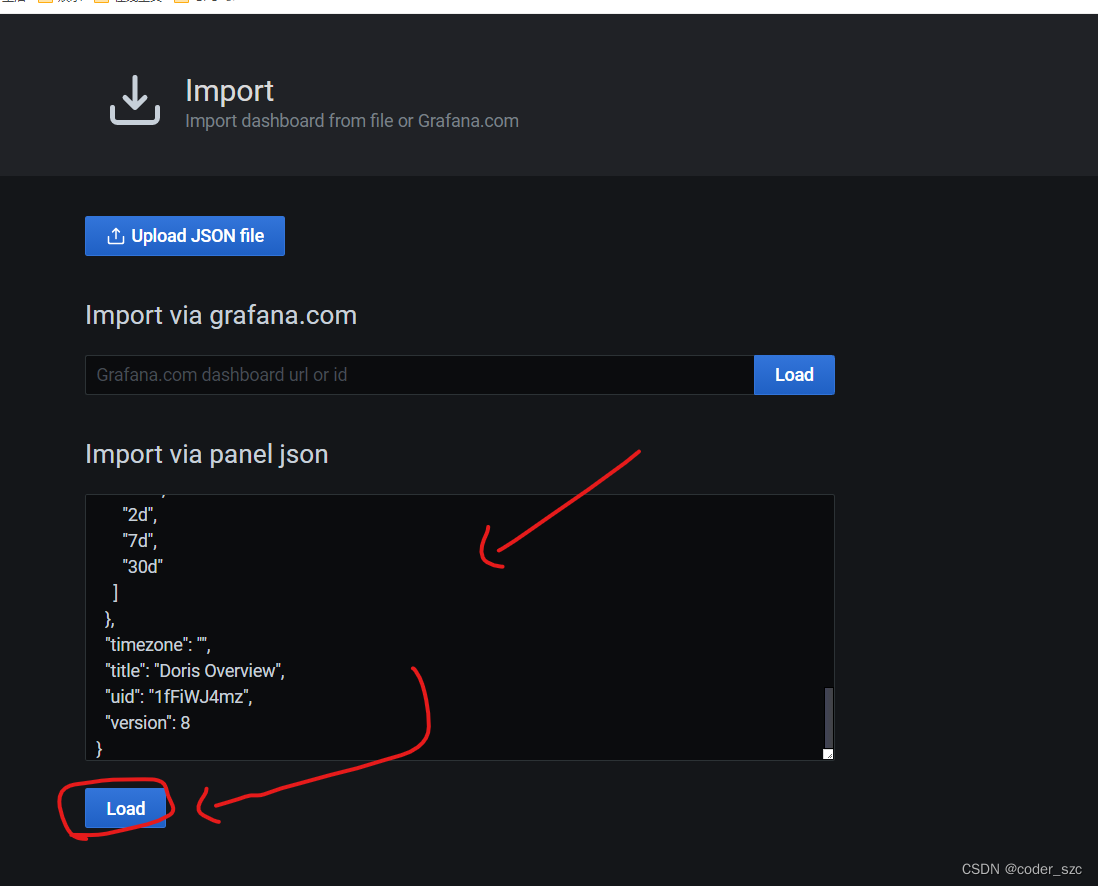
In the next step,palo选择上一步创建的Prometheus数据源,点击导入:
In the next step,palo选择上一步创建的Prometheus数据源,点击导入:
边栏推荐
- CentOS7 安装MySQL 图文详细教程
- 开放原子开源基金会秘书长孙文龙 | 凝心聚力,共拓开源
- 重磅 | 基金会为白金、黄金、白银捐赠人授牌
- Minio上传文件ssl证书不受信任
- Blockbuster | foundation for platinum, gold, silver gave nameboards donors
- Unity资源管理系列:Unity 框架如何做好资源管理
- The input input box displays the precision of two decimal places
- The idea project obviously has dependencies, but the file is not displayed, Cannot resolve symbol 'XXX'
- SQL injection of DVWA
- SQL语句中对时间字段进行区间查询
猜你喜欢
MySQL开窗函数

sql statement - how to query data in another table based on the data in one table

Hand in hand to realize the picture preview plug-in (3)
STM32——DMA

MySQL优化之慢日志查询

npm、nrm两种方式查看源和切换镜像
mysql使用on duplicate key update批量更新数据
ENSP,划分VLAN、静态路由,三层交换机综合配置

Blockbuster | foundation for platinum, gold, silver gave nameboards donors

Industry-university-research application to build an open source talent ecosystem | 2022 Open Atom Global Open Source Summit Education Sub-Forum was successfully held
随机推荐
Multiple table query of sql statement
CentOS7 install MySQL graphic detailed tutorial
参考代码系列_1.各种语言的Hello World
MySQL常见面试题汇总(建议收藏!!!)
1. 获取数据-requests.get()
MySQL忘记密码怎么办
微信小程序使用云函数更新和添加云数据库嵌套数组元素
PCL 计算点云坐标最值及其索引
ERROR 1819 (HY000) Your password does not satisfy the current policy requirements
SQL row-column conversion
[Cloud Native] DevOps (5): Integrating Harbor
1. Get data - requests.get()
mysql数据库安装(详细)
行业落地呈现新进展 | 2022开放原子全球开源峰会OpenAtom OpenHarmony分论坛圆满召开
Musk talks to the "virtual version" of Musk, how far is the brain-computer interaction technology from us
MySQL事务隔离级别详解
ENSP, VLAN division, static routing, comprehensive configuration of Layer 3 switches
矩池云快速安装torch-sparse、torch-geometric等包
ERROR 2003 (HY000) Can't connect to MySQL server on 'localhost3306' (10061)
信息系统项目管理师核心考点(五十五)配置管理员(CMO)的工作