Now most companies have their own complete set of monitoring system , For example, meituan's CAT, Our company's monitoring system is also based on CAT Do secondary development . General test environment or production environment has problems, you can directly use these systems to view the running situation of threads and memory , Analyze and solve problems .
It is necessary for us to understand the original process , That is, without the help of these systems , Use the most basic commands to solve , After all, it's helpful to understand these underlying implementations for your own development .
There are a lot of articles like this on the Internet , For example, check cpu Too high , Deadlock problem article , But most of it is about Linux How to do it in the environment , In fact, many problems can be found and checked in local development , So I'll mainly talk about Windows How to investigate in the environment , Here's an example of java Apply the troubleshooting method for deadlock problems .
There are two main ways , One is to use JVM Instructions +Process Explorer Tools , The other is to use jdk/bin In the catalog jvisualvm.exe Tools
One . JVM Instructions +Process Explorer
Commonly used JVM Instructions :
jpsIt is mainly used to output jvm Running process statusjstackView a certain java In process thread stack information
For all commands, please refer to the official documentation
Process Explorer yes windows The process manager of the system , You can view the corresponding pid( process id) Thread information under , It is convenient to locate which thread owns cpu High resources .
The screening process :
1. open Process Explorer Tools , Find one's own java application , If you don't know what's wrong java Which process is , Can be in windows Of cmd Input in the command window jps Command to see all java Application process id, Pictured :

If you're not sure which pid Is your java application , You can add -lm Parameters ,
namely :jps -lm, Print out the detailed class name , It's easy to find the corresponding pid
Another way is in the task manager ( Task manager - see - Select column -pid) You can also find the corresponding pid
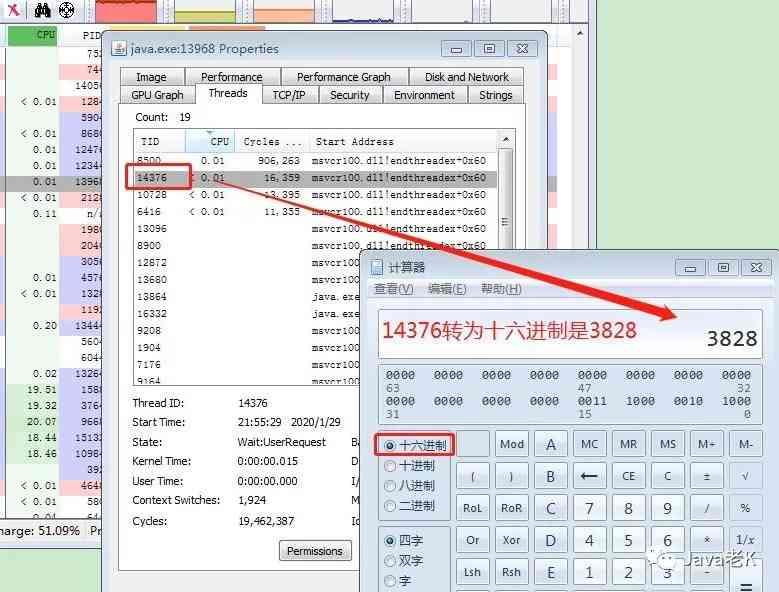
2. According to the first step we found pid stay Process Explorer The tool finds that line of record and double-click to open it Thread One column tab, You can see it java process pid The corresponding thread information ,TID It's the corresponding thread id, Pictured :

3. stay cmd The command line window uses jstack Give orders to java Stack information of the application dump Local analysis , Of course, you can also analyze it directly in the command line window , But the general stack information is relatively large , All the thread information is in it , We only care about the stack information of the thread in question , In this way, you can use : jstack pid|findstr tid This command finds the thread we care about id, But still suggest dump Search locally , there tid Pay attention to ,jstack Thread in id It's in hexadecimal , You need to put the number 2 Step inside tid( Decimal system ) To hexadecimal , Pictured :

jstack After the order -l The parameter represents the output lock information

- open dump text file , Through hexadecimal tid Find the corresponding stack information , You can locate the specific business code call location :

As can be seen from the figure above, the code that caused the problem is DeadLockTest Of 70 That's ok , The status of the thread is BLOCKED, because dump Thread with -l Parameters of (jstack -l pid), So in dump Bottom of jvm Will output deadlock information :
Obviously Thread-1 The thread is waiting 0x000000076b940cf0 This lock , It holds 0x000000076b940d00 This lock , and Thread-0 Just waiting for 0x000000076b940d00 This lock , The lock it holds is 0x000000076b940cf0, In this way, two threads wait for each other's locks , It leads to deadlock .
Two . jvisualvm.exe Tools
This tool is in JDK Of the installation directory bin Folder , Open it and find the corresponding one pid, It's actually a visit to us JVM Stack information in the virtual machine , The advantage is that it is intuitive and convenient to view the running situation of the thread , If there is a deadlock, it will be prompted , Pictured :
Source of the article :http://javakk.com/176.html


