当前位置:网站首页>Learning records of data analysis (II) -- simple use of response surface method and design expert
Learning records of data analysis (II) -- simple use of response surface method and design expert
2022-07-02 22:55:00 【Cannon cannon cannon~~】
Data analysis learning records ( Two )— Response surface method and Design-Expert Simple use
notes : This article refers to the blog link :https://www.biomart.cn/experiment/793/2714853.htm
One introduction
Response surface method (Response surface methodology) Explanation on Baidu Encyclopedia :
“ Response surface method is a statistical test method for optimizing random processes . The goal is to find the quantitative law between the test index and each factor , Find out the best combination of each factor level . Actively collect data on the basis of multiple linear regression , To obtain a regression equation with better properties . The complex multi-dimensional space surface established is closer to the actual situation , The number of test groups required is relatively small , It is widely used in simulation and system dynamics .”
For me, how to understand it more simply and intuitively is the primary consideration when I teach myself . The first point , Why do we need to use response surface method ? Here we will introduce another most commonly used process optimization method , Single factor test .
Single factor test is based on the assumption that there is no interaction between various factors , Change only one factor at a time , Other factors need to be kept at a constant level , Then study the influence of different test levels on the response value .
In reality, the influencing factors of the process are very complex , And there is usually some interaction between factors , When there are many experimental factors , We need several single factor analysis and a long test cycle to optimize each factor one by one , Such efficiency is not necessarily too low .
At this time, we have to mention a process optimization method with higher efficiency than single factor analysis , That's it Orthogonal test . Orthogonal test can consider many factors at the same time , Under the condition of reasonably reducing the number of tests of single factor analysis , Looking for the best factor level combination , The primary and secondary factors affecting the results are obtained through variance analysis , However, when dealing with the interaction between factors, the orthogonal test needs to design the interaction table , When the interaction between factors is more complex , The workload of orthogonal test will also increase .
therefore ..
Response surface method came into being . Response surface method is also called regression design , In fact, after understanding the analysis principle of response surface method, its name is not difficult to understand , It establishes a primary term including all significant factors on the basis of multiple linear regression 、 The quadratic term and the first-order interaction term between any two factors , It can be said to be set statistics 、 Mathematical and computer integrated statistical process optimization methods .
Response surface method through the design of a reasonable number of experiments , Accurately study the relationship between each factor and the response value we want , Quickly and effectively determine the best conditions of multi factor system .
Two example
Here I found a document , Combine the data analysis Design-expert Software for response surface analysis . There are two common methods of response surface : Central composite experimental design (central composite design,CCD) and Box-Behnken Experimental design (BBD).
Common response surface design and analysis software are Matlab、SAS and Design-Expert. In the relevant response surface that has been published (RSM) In the paper of optimization experiment ,Design-Expert Is the most widely used software .
Reference information :
[1] Hu Dong , Ke LingChao , Zhangjingyu , etc. . Response surface methodology was used to design and optimize the fermentation medium for avermectin chemical synthesis [J]. Chinese Journal of antibiotics , 2018, 043(008):1055-1061.
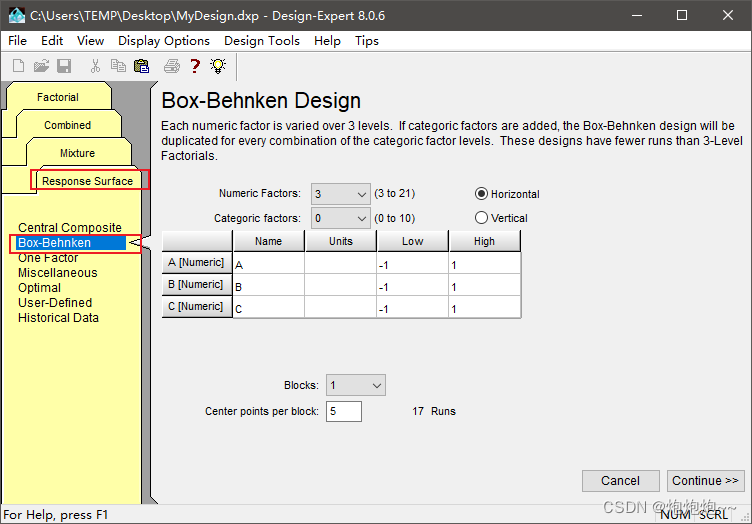
First open the software , Select new analysis , Then select response surface analysis , Choose the second Box-Behnken , Pictured :
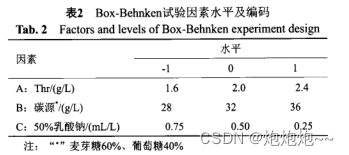
We fill in the data table in the literature , Enter the number of corresponding factors and the absolute factors in the test ( The default is 0), Then enter the name and unit of the factor 、 Maximum and minimum , Click on continue Go to the next page :
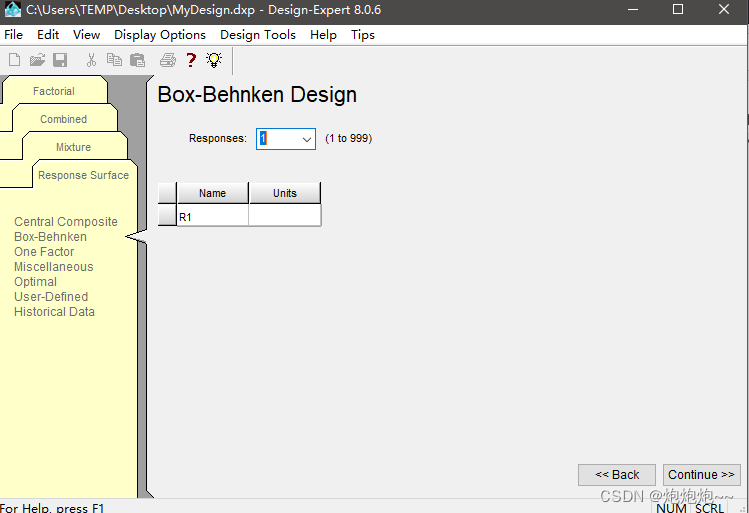
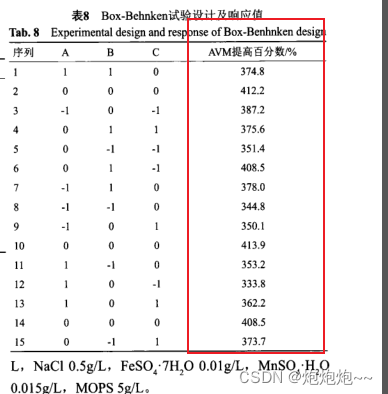
Fill in the response value we want to optimize here , Only A response value , by Avermectin increases the percentage , So we filled in , Unit is **%**, Click on continue:
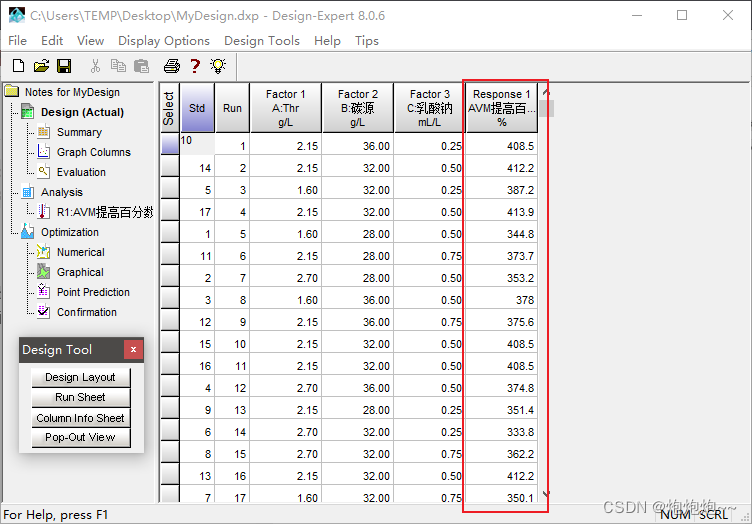
The response value data at the back of the table above needs to be entered manually , Corresponding to the data in the above table .
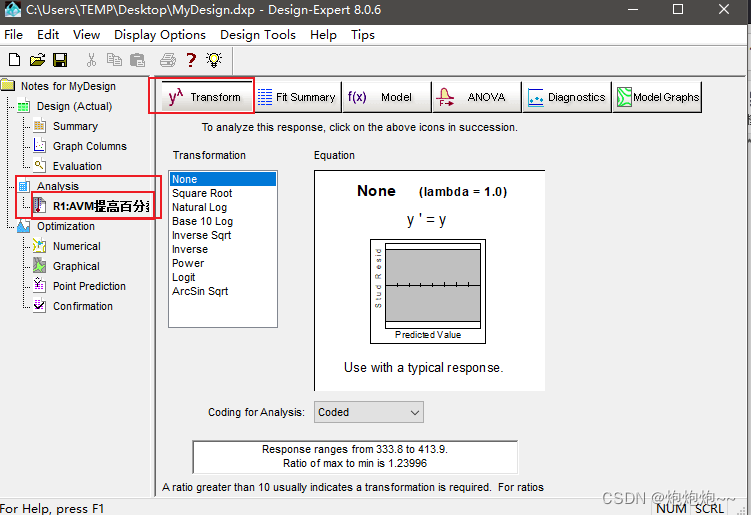
After typing, we click Analysis Of R1:Transform tab , Generally, you can choose the default value . If there are other requirements , You can find the detailed description of each mode according to your needs and instructions, and then choose .
FitSummary, Look at the suggested factors .

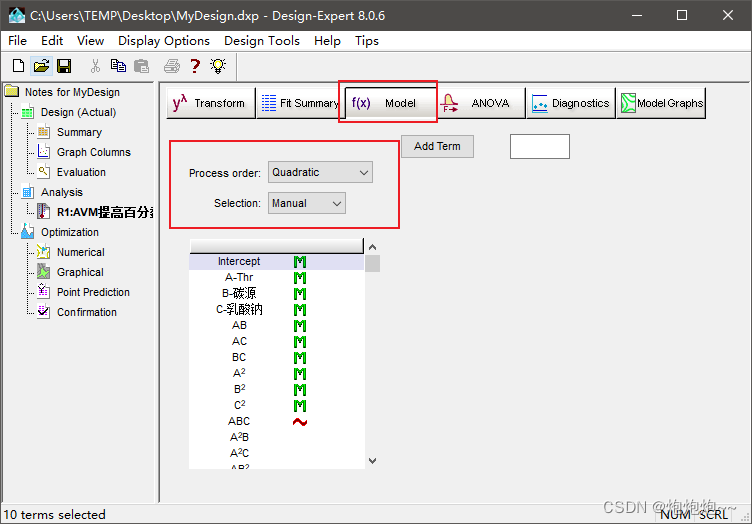
Model Take the default value of the tab , Click on ANOVA tab , Show ANOVA , Significance test of variance , Coefficient significance test regression equation .

Click on Diagnostics tab , Click the options on the left side in turn , The first thing to show is Normal Plot, Uneven normal distribution diagram , The closer the point in the figure is to the straight line, the better .
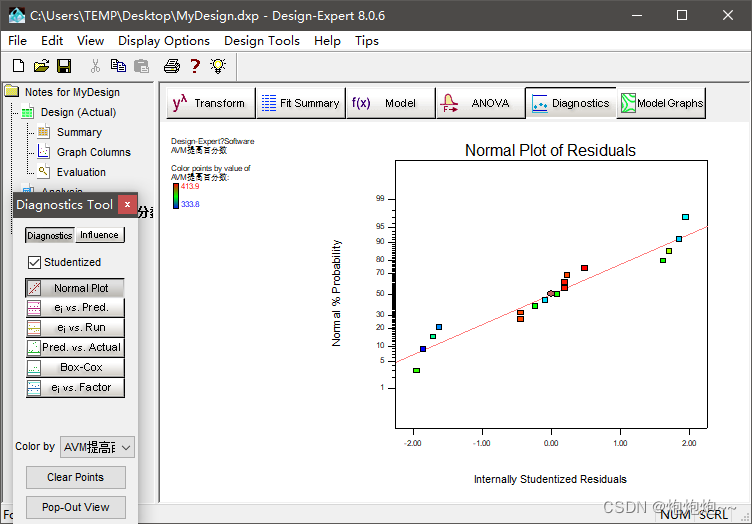
The second one shows the corresponding relationship between the residual error and the predicted value of the equation , The more scattered and irregular the distribution, the better .

Finally, the corresponding relationship between the predicted value and the actual value of the test is shown , The closer the point is to the same straight line, the better .

And then click Influence Click later Report Enter the result interface , The data is shown in the figure , Include the actual measured value of the test ( Left ) And equation prediction ( Right ).

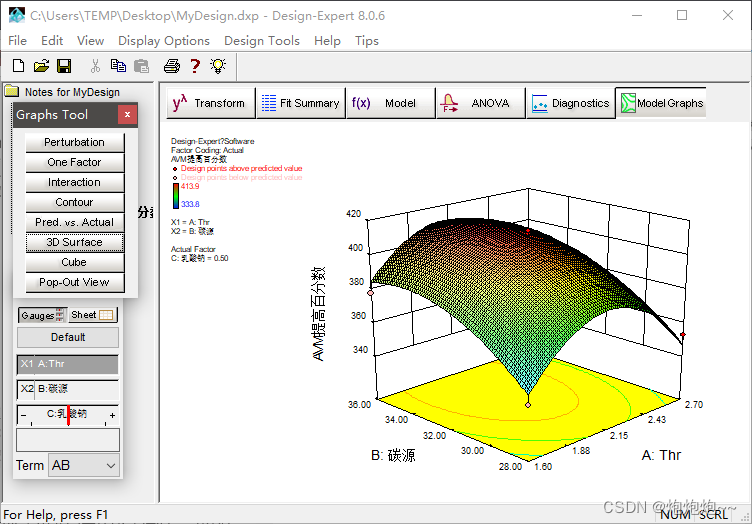
And then click Model Graphs View contour map , The contour map examines the impact of each of the two factors on the dependent variable , And form contour lines by fitting equations , It is a two-dimensional plane figure , A better range can be found through this figure .

The three-dimensional response surface graph can more intuitively see the influence of the two factors , You can intuitively find out the optimal range , The two-dimensional contour map just seen is the projection of the three-dimensional response surface map on the bottom .
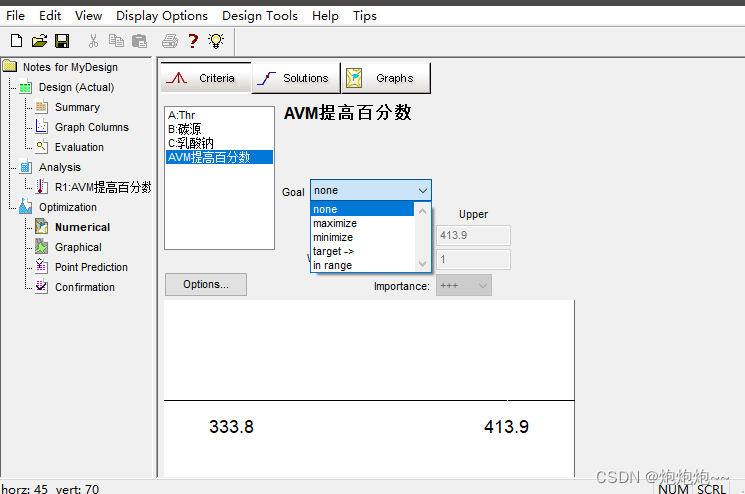
Next is the key optimization condition options , Determine the value range of each factor according to the actual situation , Then proceed 「 Response value target 」 The determination of , Each experiment has a different purpose , For example, here we want to find the optimal culture conditions that can maximize the yield of avermectin , But in other experiments, the requirements for the target need the maximum , There is a minimum value required , Sometimes it is necessary to stabilize the result in a certain range or a fixed value . Then the corresponding situation can be selected in these four modes .

Click on Solutions tab , You can see the optimal value obtained through analysis , Generally, many schemes are listed , The first solution is to maximize the result of taking the optimal value of each factor , For the predicted value .

above !!! If there is something wrong , Welcome to exchange and point out .
边栏推荐
- 杰理之快速触摸不响应问题【篇】
- Share 10 JS closure interview questions (diagrams), come in and see how many you can answer correctly
- Build your own website (22)
- go 条件变量
- Radis:Linux上安装Redis(步骤)
- Introduction to database system Chapter 1 short answer questions - how was the final exam?
- Solve the error of changing the selected file when uploading excel file. Net:: err_ UPLOAD_ FILE_ CHANGED
- Additional: [login information storage] and [login status verification]; (including: summarizing all the contents of [login information storage] and [login status verification] so far;)
- [羊城杯2020]easyphp
- 【喜欢的诗词】好了歌
猜你喜欢
![The kth largest element in the [leetcode] array [215]](/img/72/d3e46a820796a48b458cd2d0a18f8f.png)
The kth largest element in the [leetcode] array [215]

MySQL reset password, forget password, reset root password, reset MySQL password

附加:【登录信息存储】与【登录状态校验】;(包括:总结了到目前为止,有关【登录信息存储】与【登录状态校验】的所有内容;)

Qt QProgressBar详解
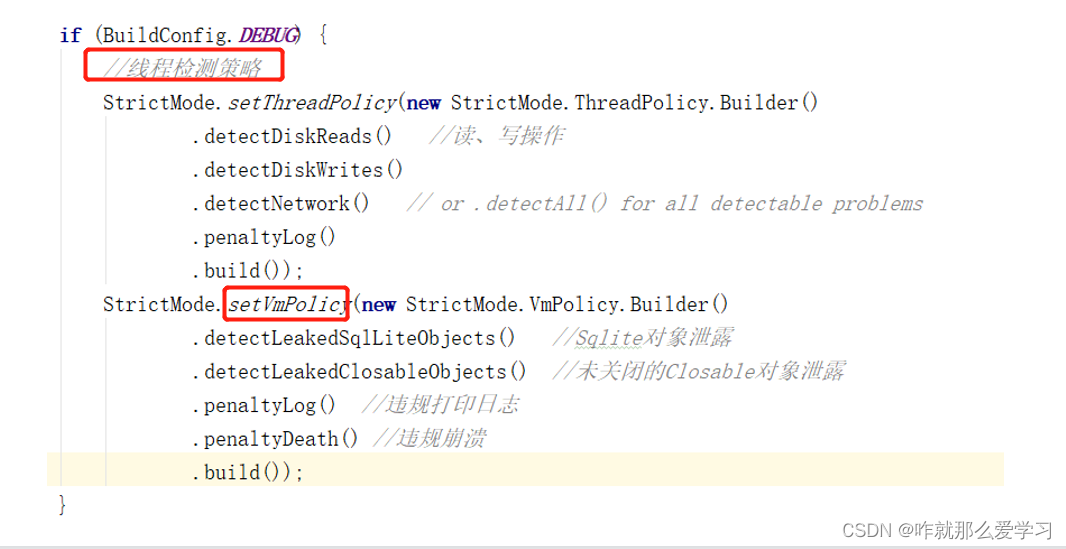
Performance optimization - rigorous mode

Local dealers play the community group purchase mode and share millions of operations
Simpleitk use - 3 Common operations

从2022年Q1财报看携程的韧性和远景

wait解决僵尸进程
![[羊城杯2020]easyphp](/img/12/da28f738e50e625b0a66a94af3703d.png)
[羊城杯2020]easyphp
随机推荐
Jerry's charge unplugged, unable to touch the boot [chapter]
Developers share | HLS and skillfully use Axi_ Customize the master bus interface instructions and improve the data bandwidth - area exchange speed
Jatpack------LiveData
數據分析學習記錄--用EXCEL完成簡單的單因素方差分析
E-commerce system microservice architecture
【板栗糖GIS】global mapper 如何通过dsm批量制作贴地等高线
分享 10 个 JS 闭包面试题(图解),进来看看你能答对多少
Objects and object variables
Jerry's modification does not require long press the boot function [chapter]
[ODX studio edit PDX] -0.1- how to quickly view the differences in supported diagnostic information between variant variants (service, sub function...)
大一学习分享
创新实力再获认可!腾讯安全MSS获2022年度云原生安全守护先锋
Introduction to database system Chapter 1 short answer questions - how was the final exam?
JS syntax ES6, ES7, es8, es9, ES10, es11, ES12 new features (Abstract)
高并发介绍及应对
用sentinel熔断比例阈值改不了,设置慢调用比例没效果
Kubernetes uses the host name to allocate the pod on the specified node
Notes on key vocabulary in the English original of the biography of jobs (11) [chapter nine]
中国信通院、清华大学、腾讯安全,云原生安全产学研用强强联合!
Oracle cursor